Break It Down
- Indicadores
- Versión: 1.1
- Actualizado: 21 julio 2017
- Activaciones: 20

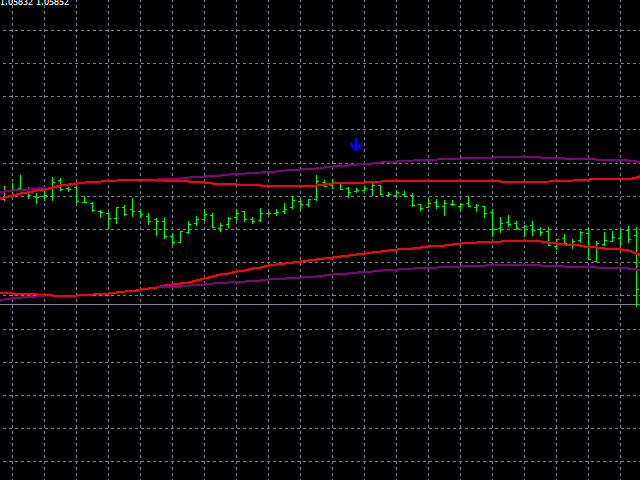
Break It Down se basa en el Índice de Movimiento Direccional e indica al operador cuándo una tendencia de mercado probablemente ha llegado al máximo y está lista para retroceder. Este patrón es más predecible cuando aplicamos este sistema sólo cuando el mercado está subiendo, pero dentro de un rango de negociación. Debido a que los operadores venden con miedo, el mercado a menudo se mueve más rápido cuando declina. Cuando esto sucede, pueden ocurrir buenos movimientos.
Como los operadores ya no están interesados en la tendencia, el volumen disminuirá y el precio normalmente caerá sobre sí mismo. Como las ventas suelen ser más rápidas que los repuntes, este sistema es adecuado para estrategias rápidas de entrada/salida de scalping.
Detectamos cuando las tendencias están al máximo utilizando un Índice de Movimiento Direccional Medio y una media de Volumen. Decimos que el mercado está en un rango de negociación mediante el uso de bandas de Bollinger más grandes y las bandas de Keltner (se recomienda tener ambos 5 veces más grande que el promedio regular de 20 períodos) y determinar cuando las líneas de Bollinger superior e inferior caen dentro de las líneas de Keltner para saber cuando el mercado está en un rango estrecho. Cuando el mercado se encuentra en un rango estrecho, es más probable que se produzca el patrón de ruptura a la baja, por lo que se mostrará una señal.
- Una forma inteligente de reconocer cuando una tendencia alcista está a punto de retroceder o invertirse totalmente.
- Establezca el número para el que es más probable que la diferencia de línea prediga un rango de cotización.
- Elija su señal favorita y los colores de la línea de Bollinger.
- Envíe alertas a su PC, correo electrónico o dispositivo móvil.
Ajustes :
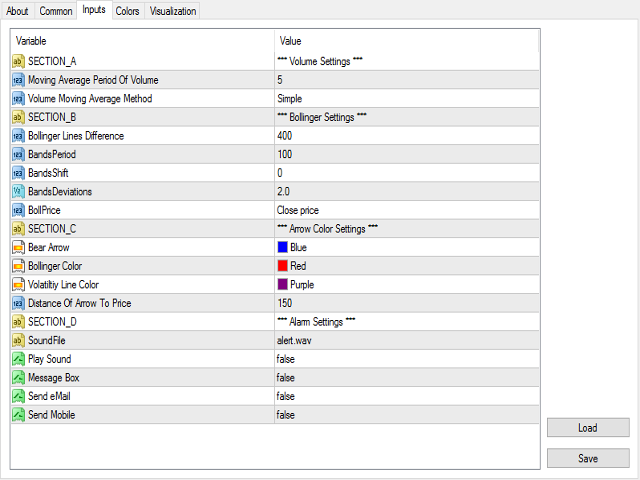
Ajustes de las Bandas Bollinger
- Bands_Period - establece el periodo de la media móvil de las Bandas de Bollinger (¡NOTA IMPORTANTE! Se recomienda dejarla en 100 a 5x mayor que la habitual de 20)
- Bands_Shift - establece la barra hacia atrás desde la actual en la que basamos el cálculo. EG 0 = barra actual, 1 = barra anterior a la actual
- Bands_Deviation - establece el cálculo de la desviación estándar.
- Bands_Price - establece el tipo de precio en el que basamos nuestro cálculo: PRECIO_CIERRE, PRECIO_APERTURA, PRECIO_ALTO, PRECIO_BAJO, PRECIO_MEDIANO, PRECIO_TÍPICO, PRECIO_PONDERADO
Ajustes de Keltner
- Periodo K eltner - establece el periodo de la media móvil en la que se basa nuestro canal Keltner (¡NOTA IMPORTANTE! Se recomienda dejarlo en 100 a 5x mayor que el habitual 20)
- Keltner ATR - establece el Average True Range (¡NOTA IMPORTANTE! Se recomienda dejarlo en 5.0 en lugar del 1.5 habitual)
- Keltner Moving Average Mode - establece el tipo de media móvil que utilizamos. EG 0 = Simple, 1 = Exponencial, 2 = Suavizada y 3 = Lineal Ponderada
Configuración del objeto gráfico
- Bear Arrow Color - Establece el color de la flecha del oso.
- Bollinger Color - establece el color de la línea de las Bandas de Bollinger
- Volatility Line Color - establece el color de la línea que creamos a partir de nuestra diferencia de línea decidida
Ajustes de alerta
- Soundfile - qué sonido de archivo de onda utilizamos para nuestra alarma de PC
- PlaySound - true significa que escuchamos nuestra alarma de PC, false significa que no escuchamos nuestra alarma de PC
- MessageBox - true significa que vemos un cuadro de mensaje, false significa que no vemos un cuadro de mensaje
- SendeMail - true significa que recibimos una alerta enviada a nuestro correo electrónico, false significa que no recibimos una alerta enviada a nuestro correo electrónico
- SendMobile - true significa que recibimos una alerta enviada a nuestro dispositivo móvil, false significa que no recibimos una alarma enviada a nuestro dispositivo móvil

El usuario no ha dejado ningún comentario para su valoración