Angle High Low MT5
- Indicadores
- Versión: 1.30
- Actualizado: 10 junio 2020

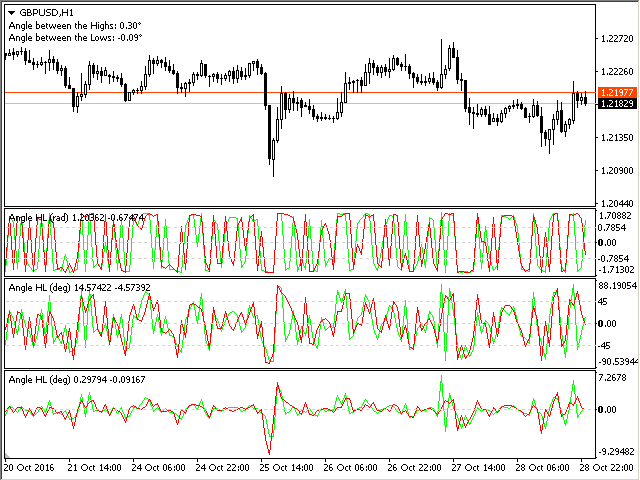
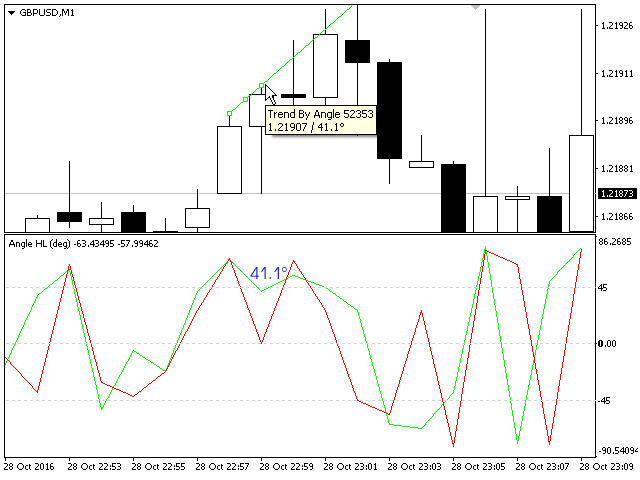
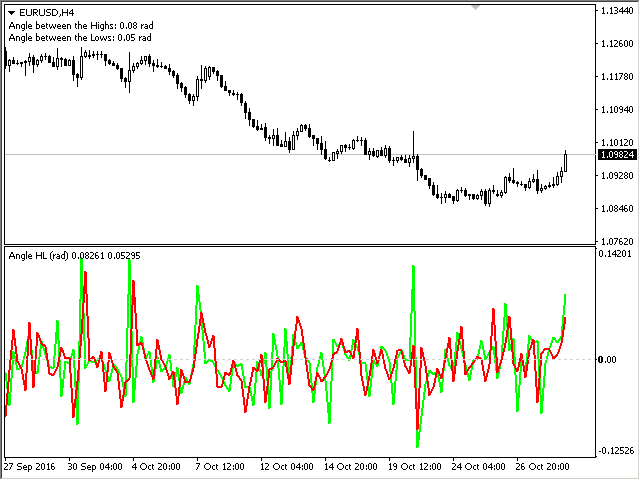
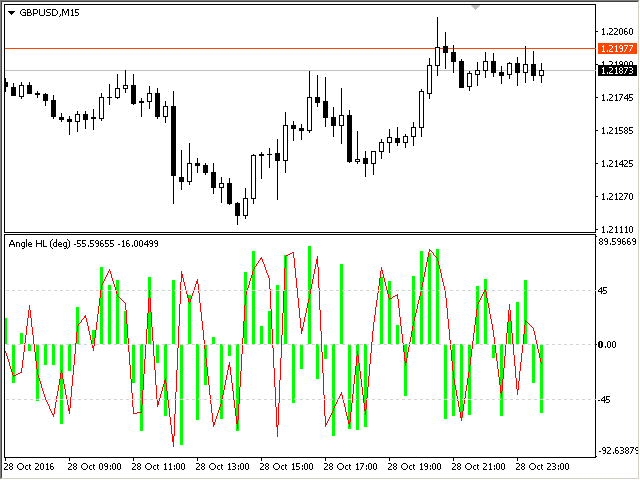
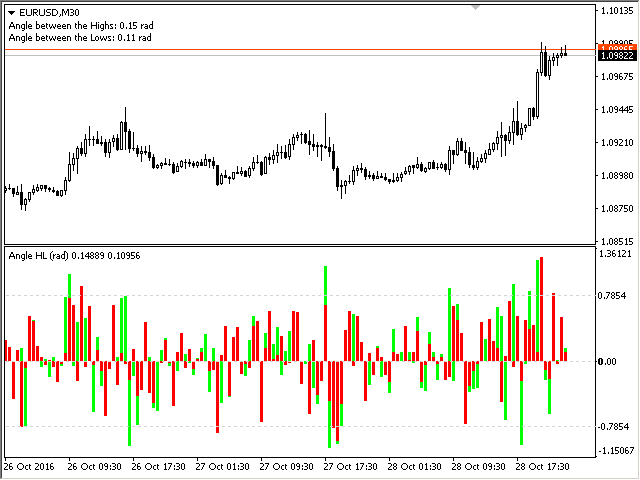
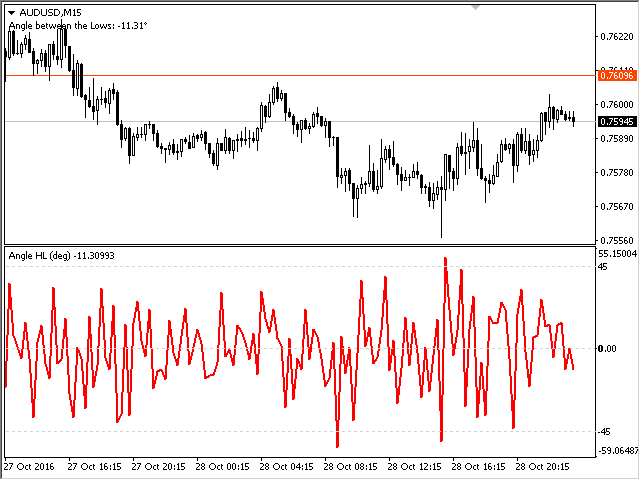
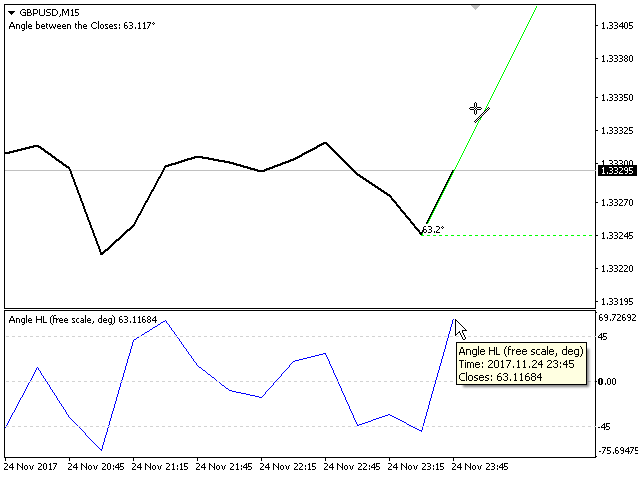
El indicador calcula el ángulo de inclinación entre los máximos, mínimos y cierres de barras adyacentes. El ángulo puede medirse en grados o radianes. En una subventana se dibuja un gráfico lineal o un histograma. Puede establecer la escala para el cálculo: flotante o fija.
Para su uso en Asesores Expertos o indicadores, debe especificar una escala fija.
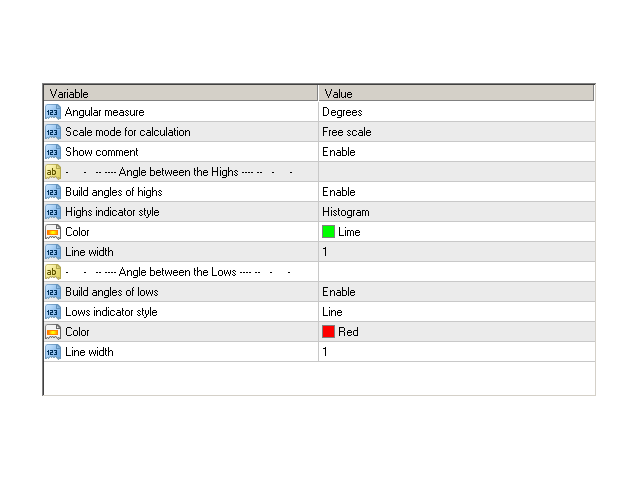
Parámetros
- Medida angular - grados o radianes.
- Modo de escala para el cálculo - modo de escala. Escala libre - transformación libre, el indicador calculará los valores cada vez que se cambie la escala del gráfico. Fija 1:1 - escala fija (los datos no se modificarán cuando cambie la escala del gráfico), los cálculos se realizan en la escala 1:1 del gráfico. Fijo 1:10 - escala fija 1:10, 1 unidad a lo largo del eje Y se multiplica por diez. Las demás escalas cambian en consecuencia.
- Mostrar comentario - mostrar los datos actuales en un comentario.
- Indicador Nivel 1 - valor 1 para el nivel del indicador.
- Indicador Nivel 2 - valor 2 para el nivel del indicador.
- Indicador Nivel 3 - valor 3 para el nivel del indicador.
- Construir ángulos de Cierres - habilitar el trazado de ángulos basados en Cierres.
- Estilo - estilo de dibujo para los Cierres: línea o histograma.
- Color - el color de las líneas de Cierre.
- Ancho de línea - ancho de las líneas de Cierre.
- Construir ángulos de Altos - permite trazar ángulos basados en Altos.
- Estilo - estilo de trazado para los Altos: línea o histograma.
- Color - el color de las líneas de Máximos.
- Ancho de línea - ancho de las líneas de máximos.
- Construir ángulos de Mínimos - permite trazar ángulos basados en Mínimos.
- Estilo - estilo de trazado para los Bajos: línea o histograma.
- Color - el color de las líneas de Bajos.
- Ancho de línea - el ancho de las líneas de Bajos.
La escala fija en MT5 difiere 10 veces de la misma escala en MT4.
Para su uso en el EA, es necesario especificar una escala fija.


El usuario no ha dejado ningún comentario para su valoración