Resistance and Support Zones
- Indicadores
- Versión: 1.4
- Actualizado: 26 abril 2022
- Activaciones: 10

El indicador utiliza un enfoque mecánico para identificar las zonas de resistencia/soporte y evaluar sus niveles de fuerza, mostrando qué zonas de precios son más importantes que otras.
La resistencia y el soporte son los principales indicadores utilizados por la mayoría de los operadores de todo el mundo. Para ser un trader de éxito, todo trader necesita dominar la detección adecuada de las zonas de precios.
Este indicador fue creado para evitar reglas de subjetividad al trazar zonas de soporte/resistencia.
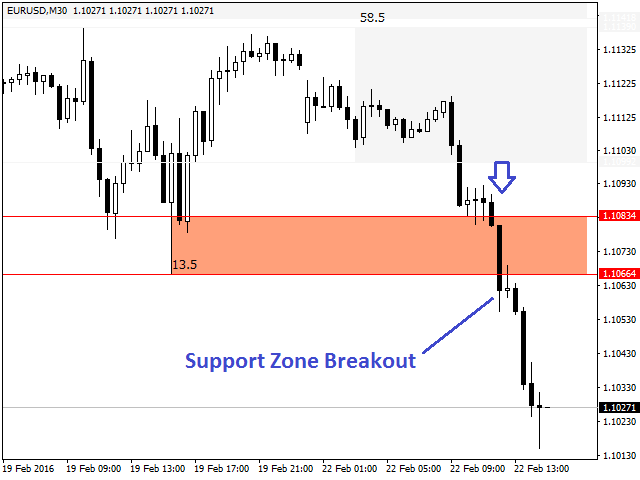
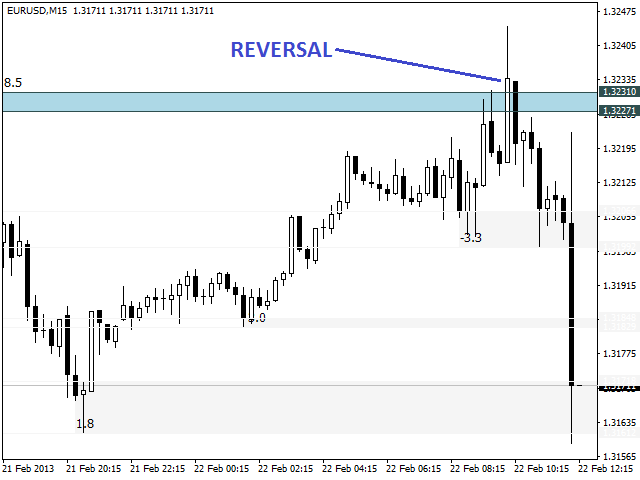
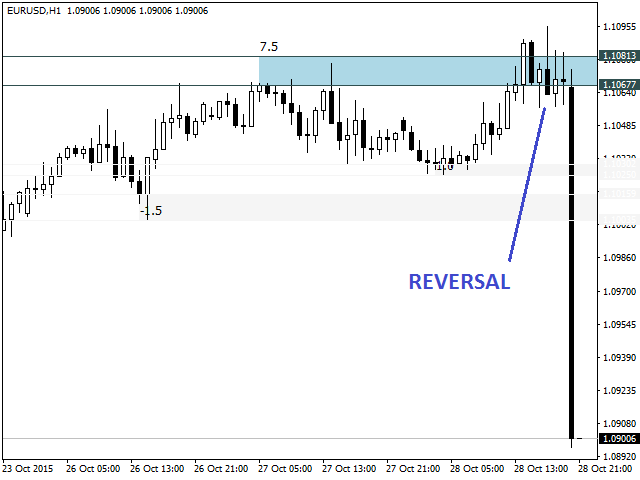
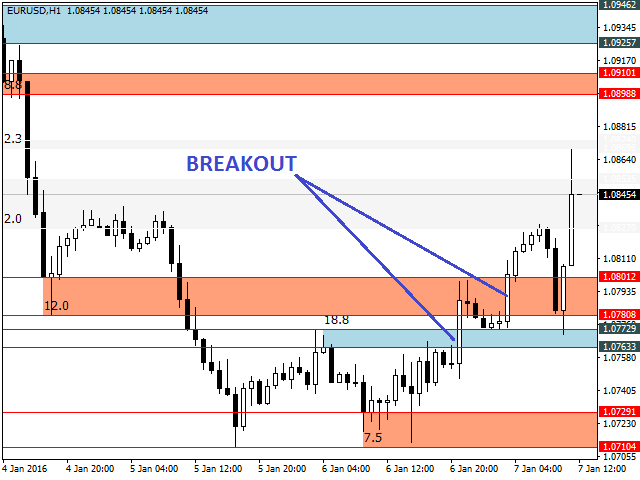
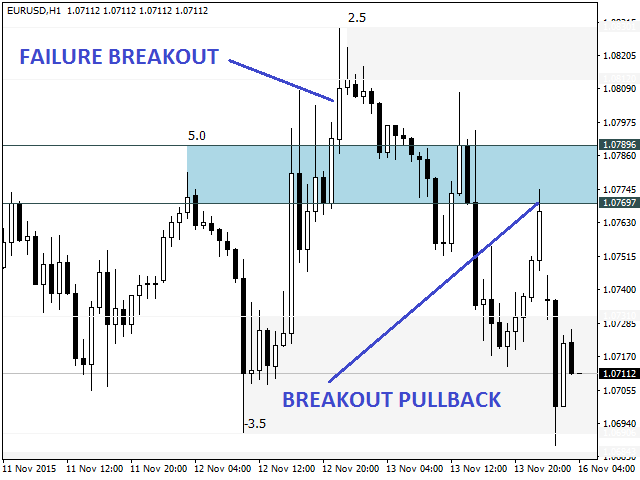
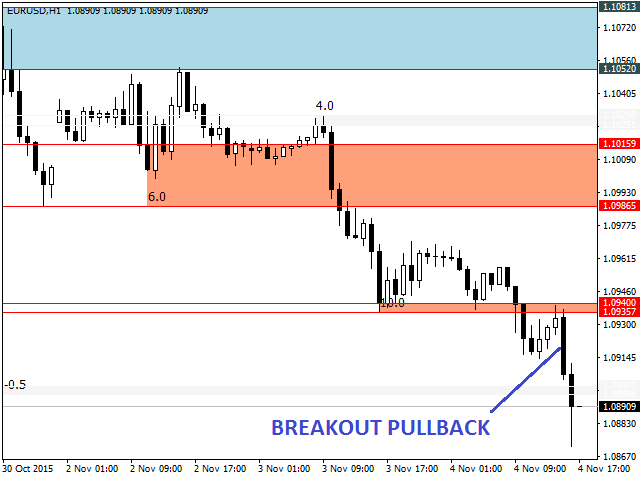
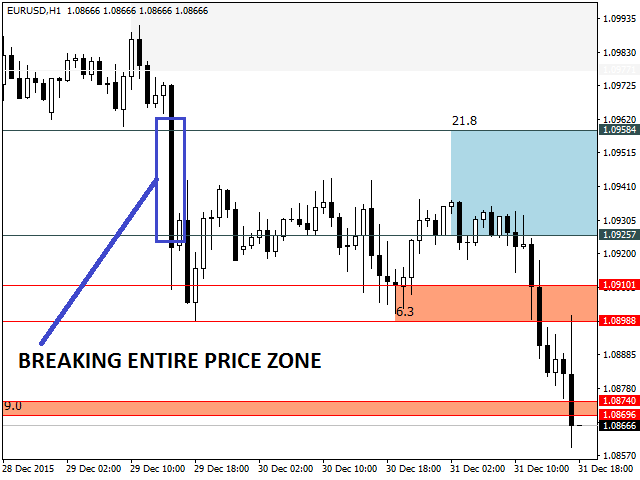
La mayoría de las veces, la resistencia y el soporte no son una simple línea que divide el gráfico de precios, sino una zona de precios, donde el mercado reacciona al tocarla.
La acción del precio puede realizar una reversión o una ruptura al alcanzar zonas de precios importantes, generando así oportunidades de trading.
Operación
El indicador busca los máximos y mínimos recientes para construir las zonas de resistencia/soporte.
Una vez construidas las zonas de precios, el indicador realiza una agrupación sólo para las zonas de precios que se solapan (consejo: Evite aumentar demasiado el número de parámetros de máximos y mínimos. Generalmente resultará en zonas de precios más grandes).
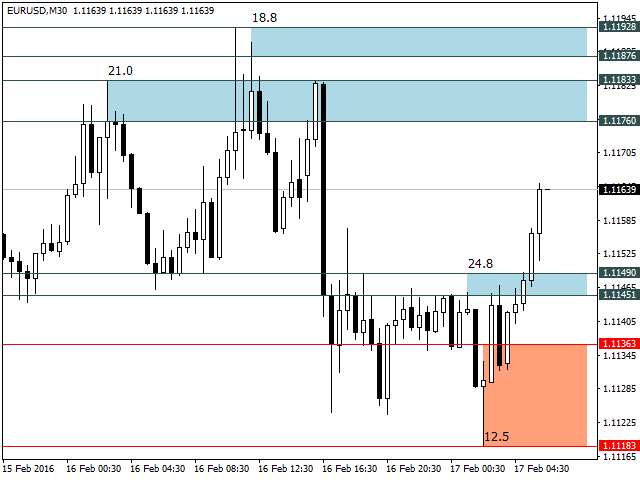
Por último, el indicador evalúa el nivel de fuerza de cada zona de precios.
Filtro automático de fuerza
El nivel de fuerza de una zona se mide analizando la acción del precio cuando el mercado alcanza estas zonas de precios.
Una zona de precios con un mayor nivel de fuerza significa que la acción del precio tiende a corresponder fuertemente a esta zona de precios.
El indicador se construyó para analizar los puntos fuertes y débiles de una zona de precios, mostrando un nivel de fuerza para cada zona dibujada en un gráfico.
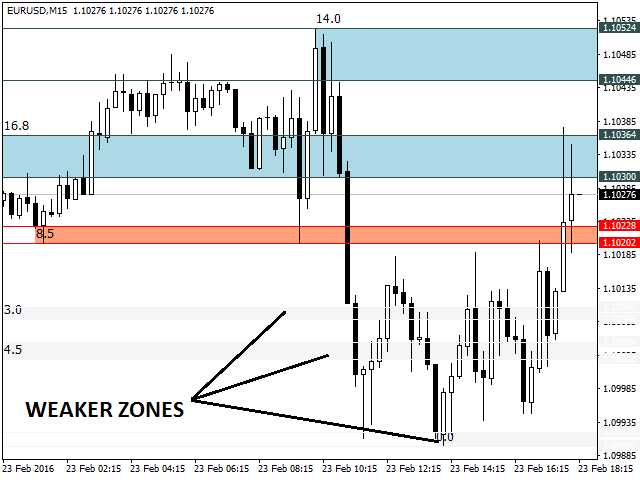
El operador puede aplicar un filtro de nivel de fuerza y el indicador suavizará las zonas de precios más débiles.
Los siguientes criterios se utilizan para determinar el nivel de fuerza de una zona de precios:
- Cuántas veces la zona de precios funcionó como barrera para el avance del precio en el pasado reciente.
- Cuántas veces el precio utilizó esta zona como soporte o resistencia en el pasado reciente.
- Cuántas veces el precio reaccionó con fuerza al alcanzar esta zona de precios en el pasado reciente.
Analizando los criterios anteriores, el indicador es capaz de establecer puntos positivos o negativos para cada zona de precios.
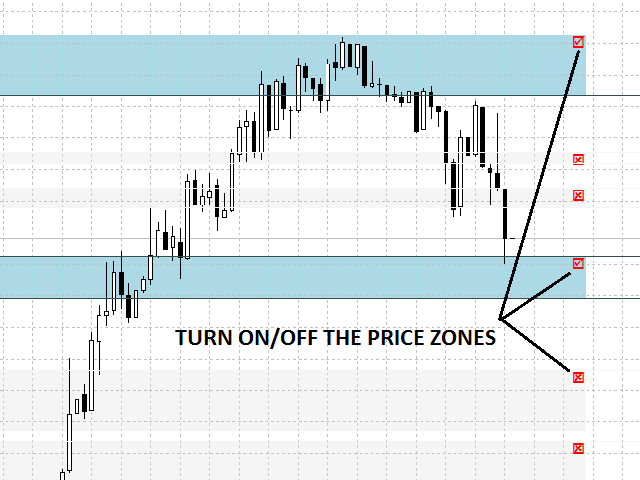
Filtro Manual
Además del Filtro Automático de Fuerza, el usuario puede activar/desactivar manualmente una zona de precio específica haciendo clic en su respectiva casilla de verificación.
Características principales
- Muestra las zonas de resistencia y soporte según la fuerza de su nivel, suavizando las zonas de precios débiles si se aplica el filtro.
- Se puede utilizar junto con marcos temporales superiores.
- Actualización automática de las zonas de precios a medida que se forman nuevos máximos y mínimos, evitando convertir el gráfico en un lío de líneas.
- Debido al nivel de fuerza de cada zona de precios, las zonas de precios pueden ser comparadas y los operadores pueden centrarse en las más fuertes.
- Funciona en todos los símbolos y marcos temporales.
- Se ejecuta sólo cuando se forma una nueva barra.
- Pocos parámetros de entrada para ajustar.
- Búferes accesibles para los desarrolladores de EA.
Ajustes
- Timeframe - marco de tiempo utilizado para construir zonas de precios.
- Filtro de fuerza - activar/desactivar el filtro de fuerza. Cuando está activado, las zonas de precios más fuertes se resaltarán y las zonas de precios más débiles se suavizarán.
- Nivel de filtro defuerza: nivel utilizado para filtrar las zonas de precios más fuertes de las más débiles (Estándar=8).
- Número de máximos y mínimos - número de máximos y mínimos recientes que el indicador buscará para construir las zonas de precios (Estándar=5).
- Color dela línea de soporte: color de las líneas horizontales de las zonas de soporte.
- Color de la línea de resistencia: color de las líneas horizontales de las zonas de resistencia.
- Support Zone Color - color de las zonas de soporte.
- Color de la zona de resistencia: color de las zonas de resistencia.
- ZonaDébil Color - color de las zonas débiles.
- Color de las casillas deverificación - color de las casillas de verificación de las zonas de precios.
- Color dezona oculta - color de las zonas de precio ocultas (filtro manual).
Para desarrolladores de EA
Buffers disponibles:
- Buffers 0 y 3 - zona de precio inferior para resistencia y soporte respectivamente.
- Buffers 1 y 4 - zona superior del precio para resistencia y soporte respectivamente.
- Buffers 2 y 5 - nivel de fuerza para las zonas de resistencia y soporte respectivamente.
La información de las zonas de precios siempre se almacenará al principio de los buffers. El resto de los búferes se llenarán con ceros.
¿Cómo operar?
Por sí solas, las zonas de precios no pueden servir como puntos de entrada, pero en conjunción con otros indicadores, como patrones de velas, correlación y osciladores, se convierten en una poderosa herramienta. El siguiente vídeo contiene una estrategia de trading utilizando el oscilador estocástico.


Very bad and regretted losing $ 50 for nothing
such indicators are better than hundreds of times available and free .
but unfortunately this indicator is added to the fact that it is stolen from the free indicators that it is also stupid and ignores show of support and resistance in the required area