FIBO Price Alert Indicator
- Indikatoren
- Version: 1.30
- Aktualisiert: 23 August 2017
- Aktivierungen: 20

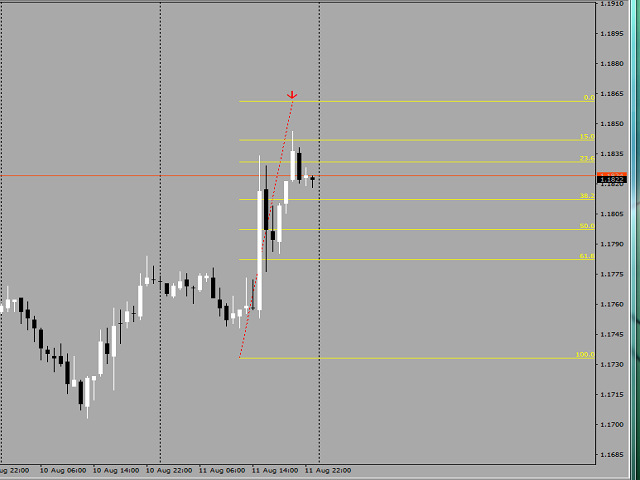
FIBO Price Alert Indicator ist ein sehr einfacher, aber leistungsfähiger Indikator. Es handelt sich um einen sehr bekannten Indikator, mit dem Sie Fibonacci-Retracements erkennen und ausnutzen können.
Dieser Indikator kann in allen Währungspaaren und auf jedem Zeitrahmen verwendet werden, vorzugsweise jedoch auf höheren Zeitrahmen. Außerdem ist es relativ einfach, mit dem FIBO Price Alert Indicator zu handeln.
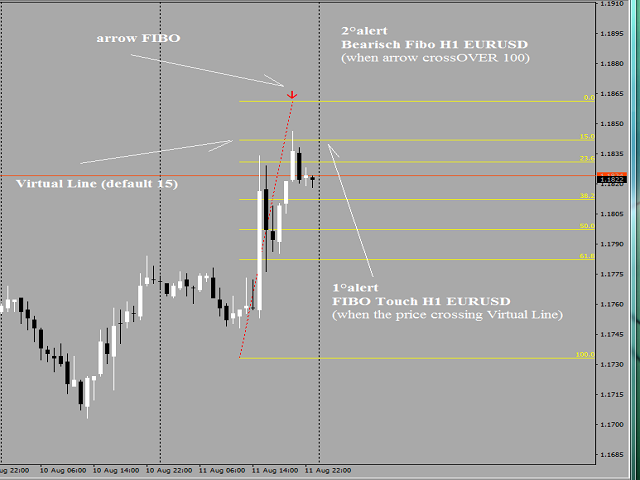
Dieser Indikator erzeugt zwei Signale:
- KAUFEN-Signal: Wenn der Kurs die virtuelle Linie überquert.
- VERKAUFSSIGNAL: Wenn der Preis unter der virtuellen Linie kreuzt.
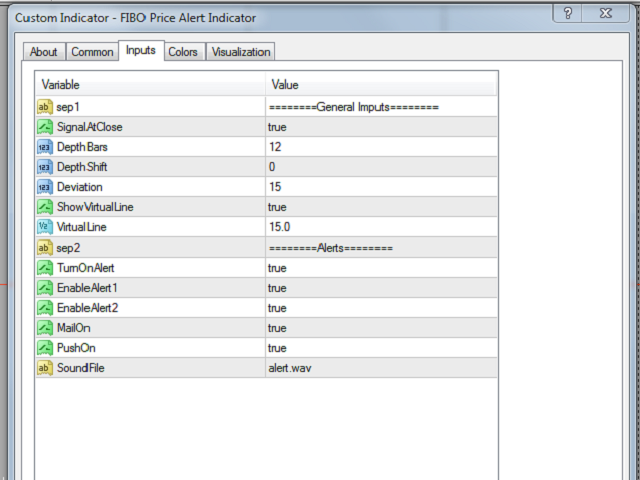
Parameter des Indikators
- Auslösung des Signals - bei geschlossenem Balken oder Tick für Tick.
- Tiefe Balken - Anzahl der Balken für die Berechnung der FIBO-Signale.
- Tiefenverschiebung - Verschiebung.
- Abweichung - maximale Preisabweichung.
- Virtuelle Linie anzeigen - virtuelle Linie im Chart sehen oder nicht sehen
- Virtuelle Linie - Wert der virtuellen Linie.
- Alert einschalten - Alarm ein- oder ausschalten.
- Aktiviere Alert 1 - Alarm, wenn der Preis die Linie 0,0 oder 23,6 oder 38,2 oder 50,0 berührt. CHANGE IN: wenn der Kurs die virtuelle Linie überschreitet.
- Aktivieren Sie Alert 2 - Alarm, wenn der Kurs die virtuelle Linie über- oder unterschreitet. CHANGE IN: wenn der Pfeil FIBO den Wert 100 über- oder unterschreitet.
- Mail On - Mail-Alarm.
- Push On - Push-Alarm.
- Sound File - Tonalarm.
Probieren Sie die DEMO-Version