PZ Harmonacci Patterns
- Indicadores
- Versão: 12.0
- Atualizado: 16 julho 2024
- Ativações: 20

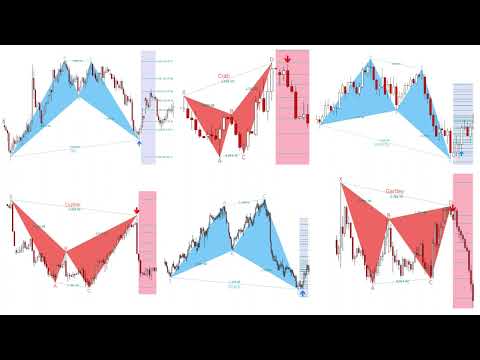
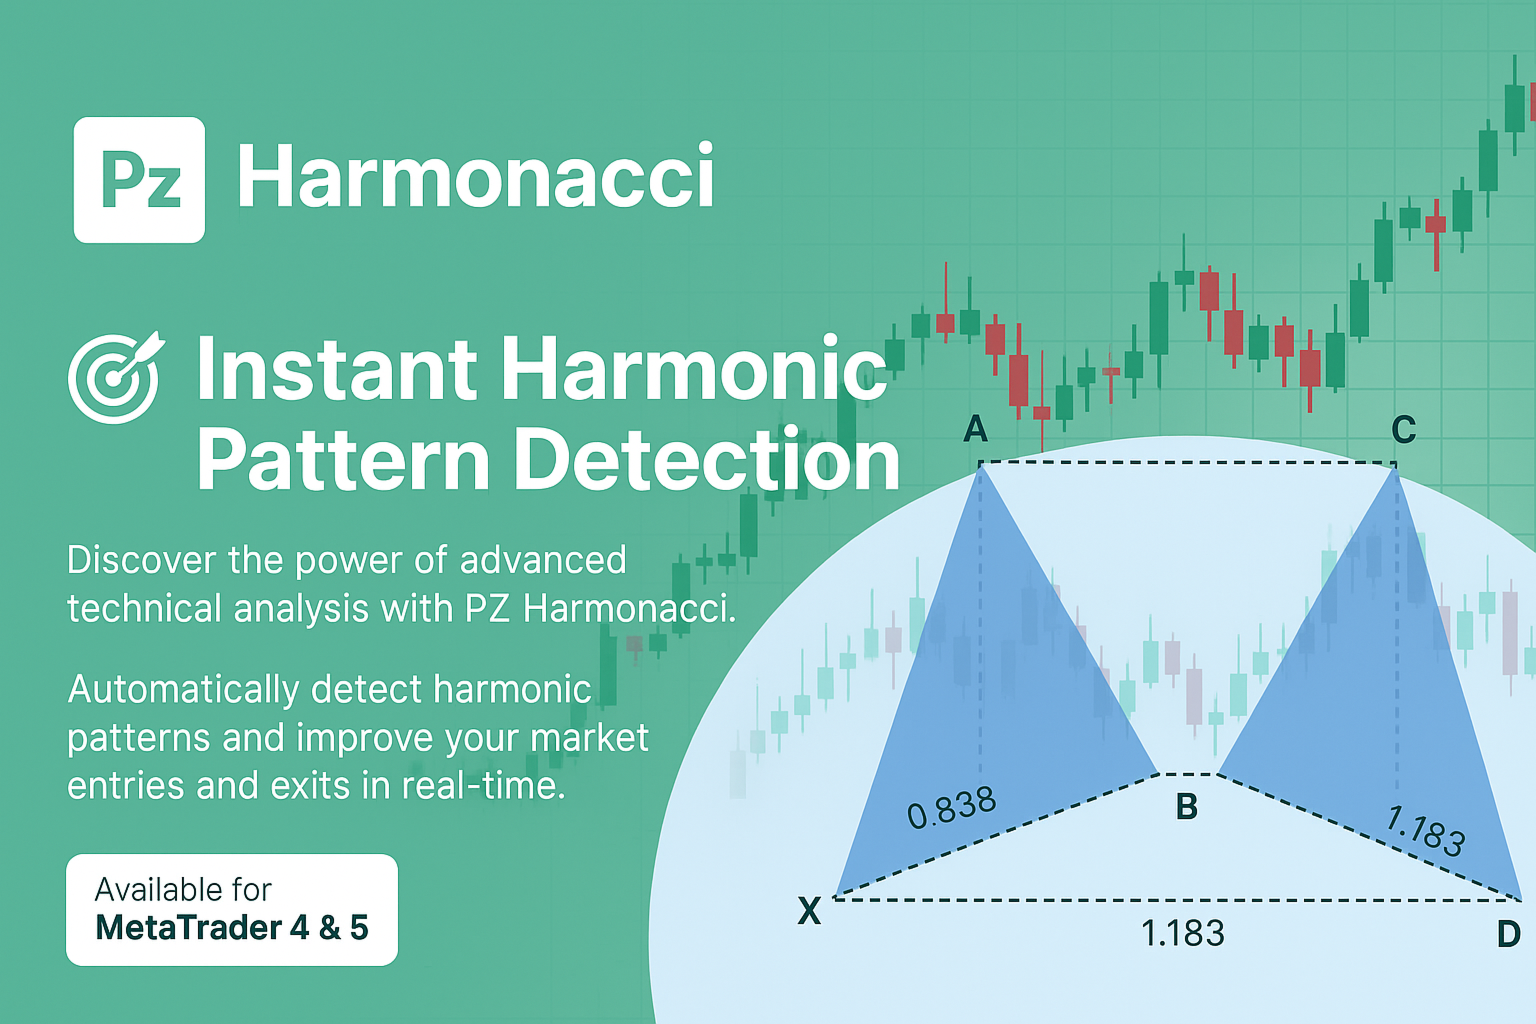
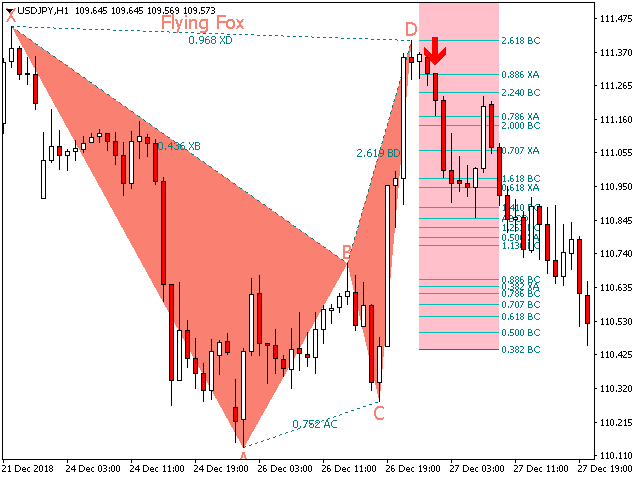
Este é sem dúvida o indicador de reconhecimento automático de formação de preço harmônico mais completo que você pode encontrar para a MetaTrader Platform. Ele detecta 19 padrões diferentes, leva as projeções de Fibonacci tão a sério quanto você, exibe a Zona de Reversão Potencial (PRZ) e encontra níveis adequados de stop loss e take-profit.
[ Guia de instalação | Guia de atualização | Solução de problemas | FAQ | Todos os produtos ]
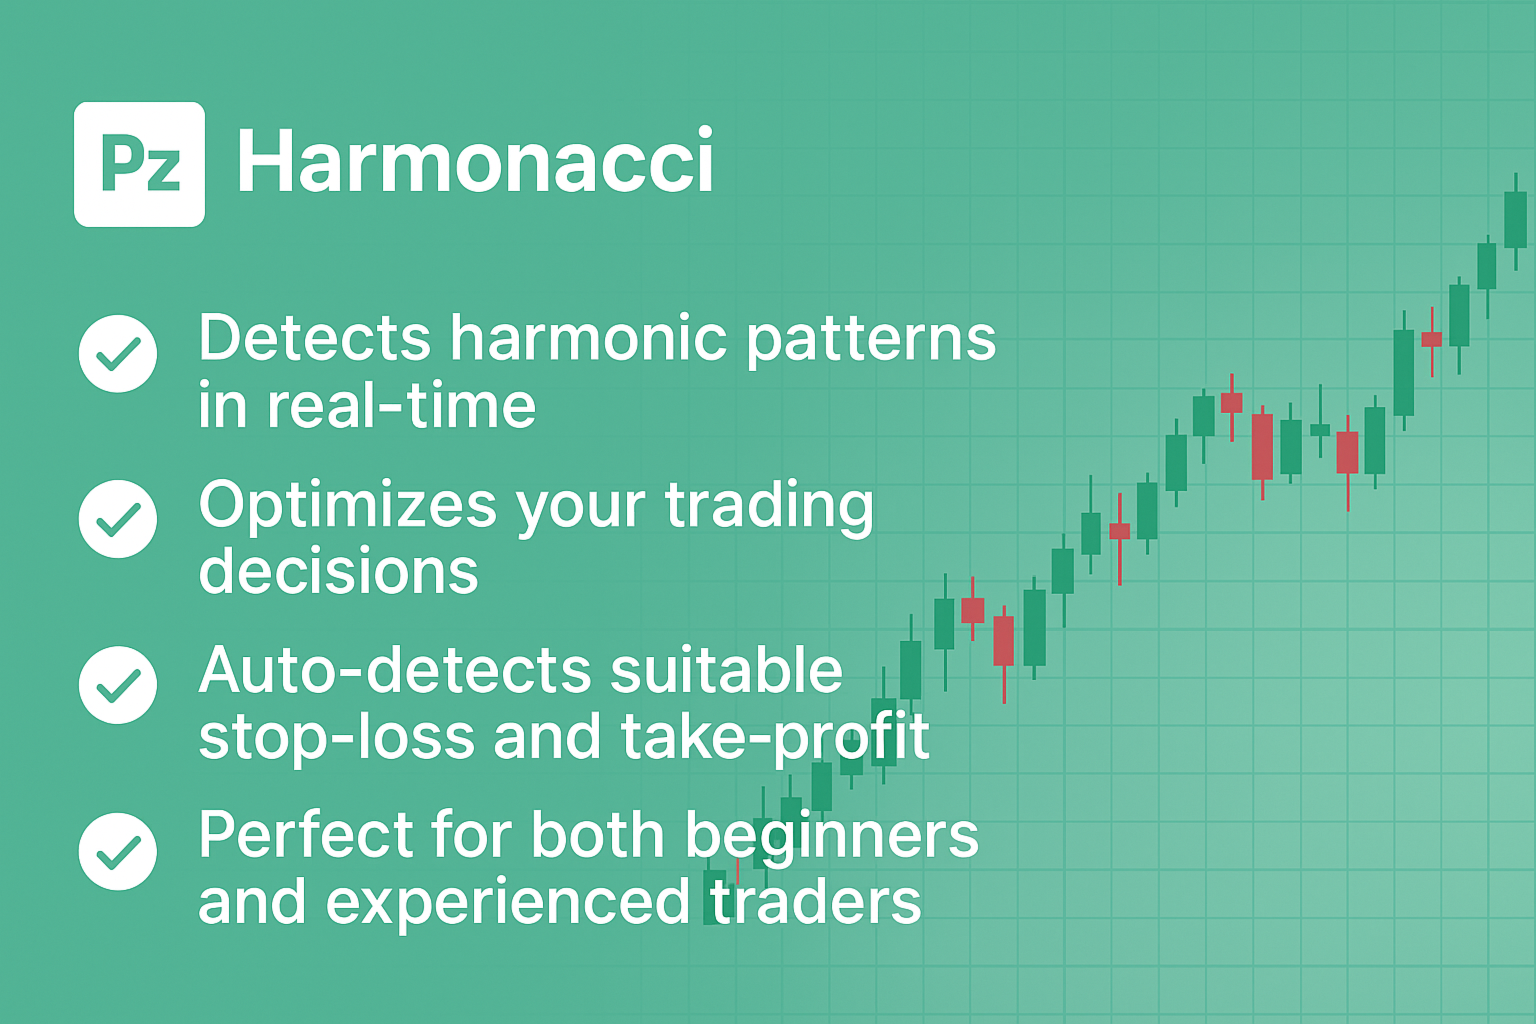
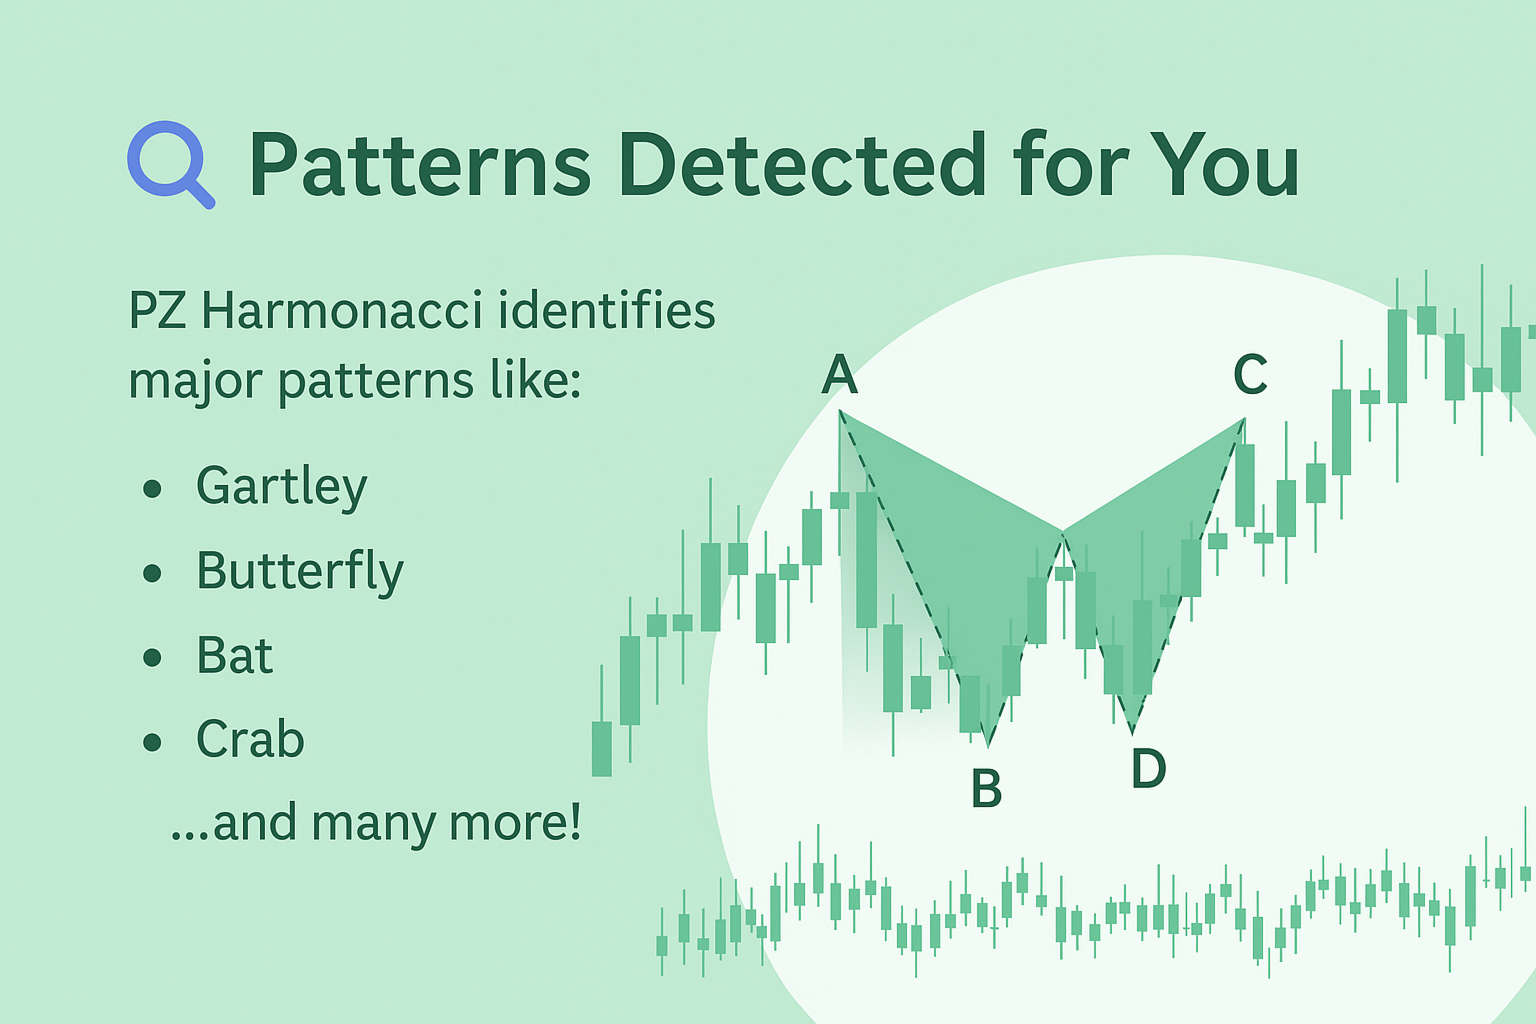
- Detecta 19 formações harmônicas de preços diferentes
- Traça projeções de Fibonacci primárias, derivadas e complementares (PRZ)
- Avalia a ação do preço passado e exibe todos os padrões passados
- O indicador analisa sua própria qualidade e desempenho
- Ele exibe níveis adequados de stop-loss e take-profit
- Utiliza breakouts para sinalizar negociações adequadas
- Plota todas as proporções de padrão no gráfico
- Implementa alertas de email / som / visuais
Inspirado no livro de Scott M. Carney, este indicador foi projetado para atender às necessidades dos comerciantes mais puristas e exigentes. No entanto, ele implementa uma reviravolta para facilitar o comércio: aguarda uma fuga Donchian na direção certa antes de sinalizar o comércio, tornando seus sinais muito confiáveis.
- As projeções de Fibonacci são independentes de vetores
- Implementa alertas de email / som / push
- Traça a projeção ABCD
Importante: Alguns nomes de padrões foram renomeados para alternativas auto-explicativas para atender a uma reclamação de marca registrada do Sr. Scott M. Carney , proprietário das seguintes marcas nos EUA: Harmônicas, Comércio de Harmônicas, Padrão de Morcego, Padrão de Borboleta, Padrão de Tubarão, Padrão de caranguejo e padrão de cinco-O .
Formações de preços harmônicos suportados
| Nome | Min XB | Max XB | CA mínima | CA máxima | DB mínimo | Max BD | Min XD | Max XD |
|---|---|---|---|---|---|---|---|---|
| Raposa voadora | 0,382 | 0,5 | 0,382 | 0,886 | 1.618 | 2.618 | 0,886 | 0,886 |
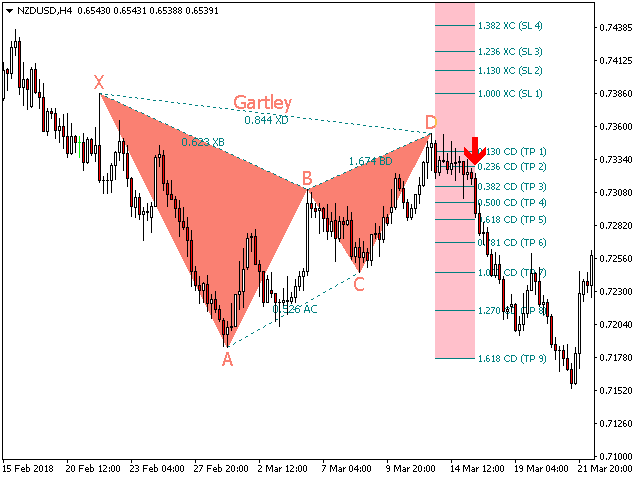
| Gartley | 0,618 | 0,618 | 0,382 | 0,886 | 1,272 | 1.618 | 0,786 | 0,786 |
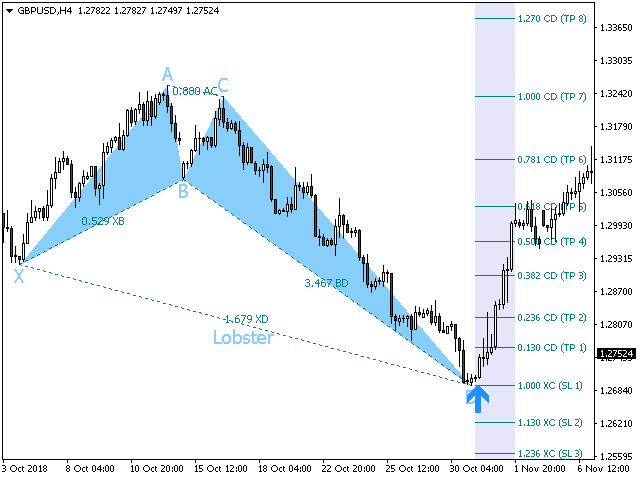
| Lagosta | 0,382 | 0,618 | 0,382 | 0,886 | 2,24 | 3.618 | 1.618 | 1.618 |
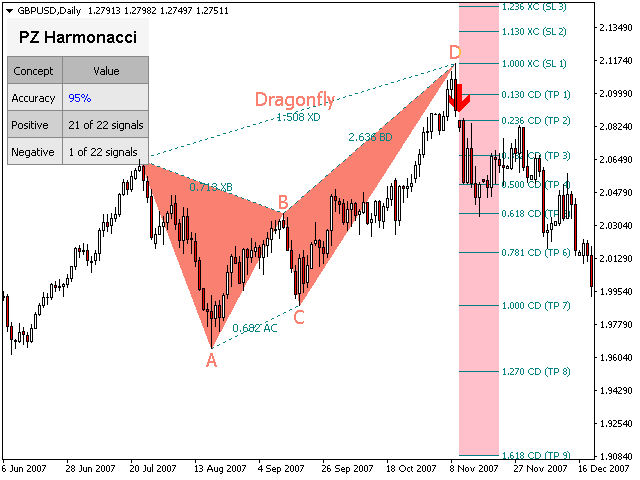
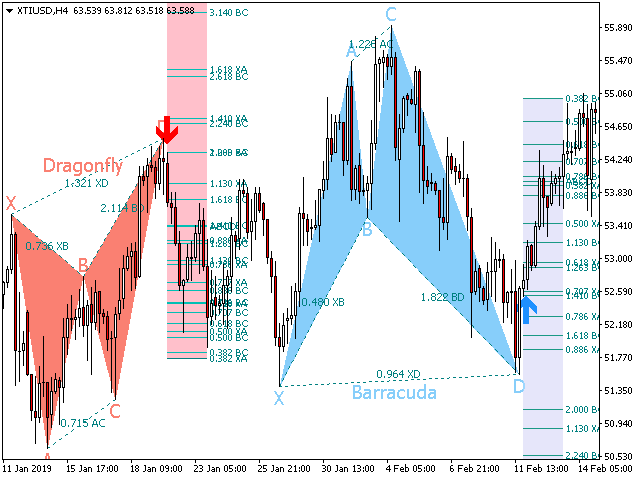
| Libélula | 0,718 | 0,718 | 0,382 | 0,886 | 1.618 | 2.618 | 1,272 | 1.618 |
| Cifra | 0,382 | 0,618 | 1,13 | 1.414 | 1,272 | 2.0 | 0,786 | 0,786 |
| Barracuda | - | - | 1,13 | 1.618 | 1.618 | 2,24 | 0,886 | 1,13 |
| Alt Flying Fox | 0,382 | 0,382 | 0,382 | 0,886 | 2.0 | 3.618 | 1,13 | 1,13 |
| Lagosta profunda | 0,886 | 0,886 | 0,382 | 0,886 | 2.618 | 3.618 | 1.618 | 1.618 |
| Cisne Branco | 1,382 | 2.618 | 0,236 | 0,5 | 1,128 | 2.0 | 1,126 | 2.618 |
| Cisne Negro | 0,382 | 0,724 | 2.0 | 4.237 | 0,5 | 0,886 | 0,382 | 0,886 |
| Max Bat | 0,382 | 0,618 | 0,382 | 0,886 | 1,272 | 2.618 | 0,886 | 0,886 |
| Max Gartley | 0,382 | 0,618 | 0,382 | 0,886 | 1,128 | 2.236 | 0,618 | 0,786 |
| Max Dragonfly | 0,618 | 0,886 | 0,382 | 0,886 | 1,272 | 2.618 | 1,272 | 1.618 |
| Alt Barracuda | 0,446 | 0,618 | 0,618 | 0,886 | 1.618 | 2.618 | 1,128 | 1,128 |
| Uma lagosta | 0,276 | 0,446 | 1,128 | 2.618 | 1.618 | 2.618 | 0,618 | 0,618 |
| Uma libélula | 0,382 | 0,618 | 1,128 | 2.618 | 1,272 | 1,272 | 0,618 | 0,786 |
| Uma raposa voadora | 0,382 | 0,618 | 1,128 | 2.618 | 2 | 2.618 | 1,128 | 1,128 |
| A Gartley | 0,618 | 0,786 | 1,128 | 2.618 | 1.618 | 1.618 | 1,272 | 1,272 |
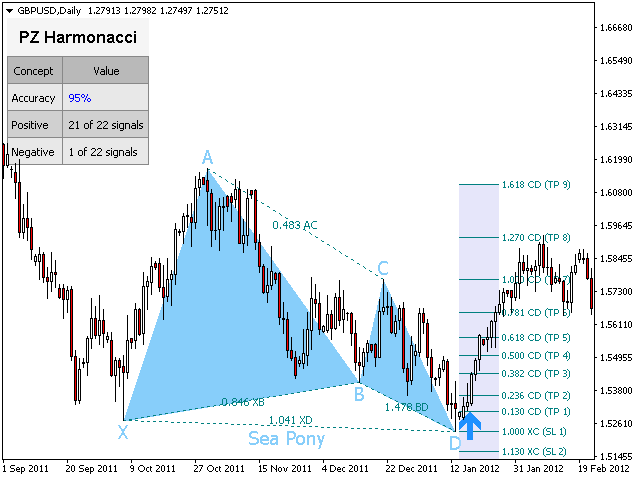
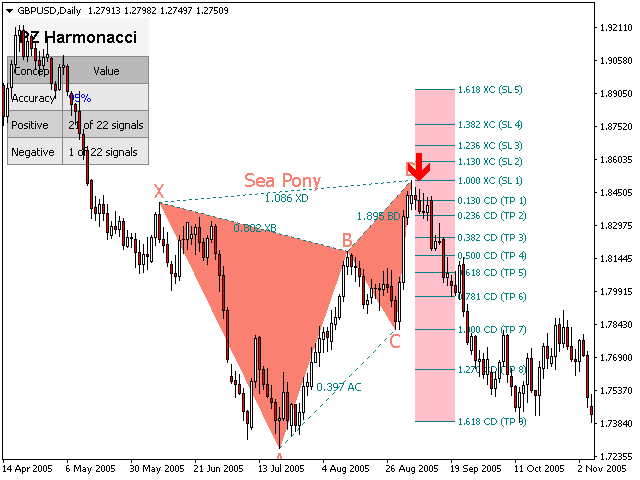
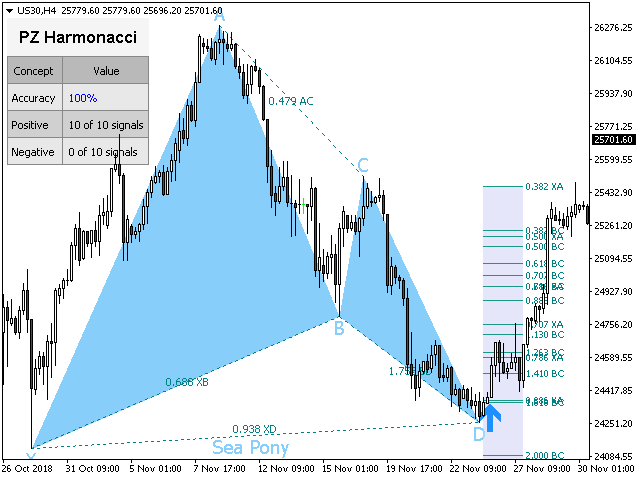
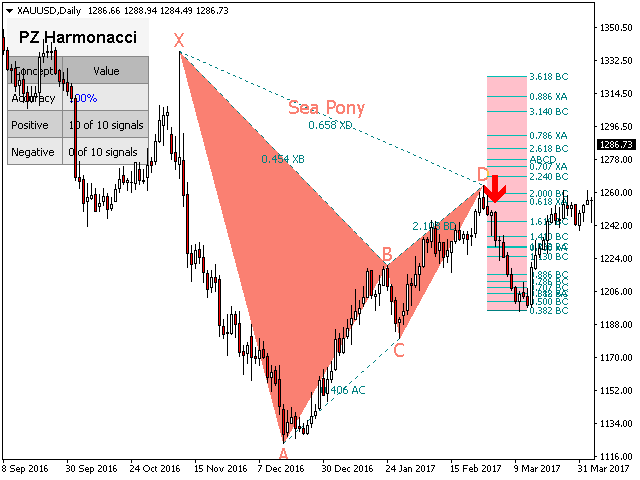
| Pônei do mar | 0,128 | 3.618 | 0,382 | 0,5 | 1.618 | 2.618 | 0,618 | 3.618 |
Parâmetros de entrada
- Amplitude - Este parâmetro controla o tamanho dos padrões encontrados no gráfico.
- Desvio - espaço de manobra algorítmica para reconhecimento de padrões. Aumente para encontrar mais padrões.
- Período de interrupção - período de interrupção donchiano para os sinais de negociação.
- Barras máximas do histórico - quantidade de barras históricas para avaliar quando o indicador é carregado.
- Exibir estatísticas - ative ou desative as estatísticas da tela de desempenho.
- Exibir pontos - Exibir rótulos de preços (rótulos X, A, B, C, D).
- Proporções de exibição - Proporções de padrão de exibição.
- Exibir projeções - Exibir a zona de reversão potencial (PRZ)
- Exibir níveis de SL / TP - exibe níveis adequados de stop loss e take-profit.
- Configurações de padrão - escolha quais padrões procurar: desative todos os que você não usa.
- Configurações de desenho - Configure as cores dos padrões de alta e baixa, bem como o tamanho da fonte.
- Proporções - ative ou desative relações e escolha suas próprias cores de proporção.
- Projeções - Exiba ou oculte as projeções de Fibonacci no gráfico.
- Breakouts - ative ou desative breakouts e defina os tamanhos e cores de setas desejados.
- Alertas - ative alertas de exibição / e-mail / push / som para interrupções, padrões ou ambos.
Autor
Arturo López Pérez, investidor privado e especulador, engenheiro de software e fundador da PZ Trading .


I just bought this indicator last night, harmonics looks very promising. I put two trades in and checked them the morning after, won both by 40 pips. I will be writing a review further on detailing my progress, I know 299 credits is a lot to spend for people but so far so good.