Market Structure w Inducements and Sweeps MT4 NDH
- Indikatoren
-
Cao Minh Quang
 Welcome to my profile. I am a developer MQL4 and MQL5.
Telegram: https://t.me/storevan
Thanks and regards! - Version: 1.0
- Aktivierungen: 5
Der Indikator "Market Structure with Inducements & Sweeps" ist eine einzigartige Interpretation der Smart Money Concepts Marktstruktur-Labels, die darauf abzielt, Händlern eine präzisere Interpretation unter Berücksichtigung verschiedener Faktoren zu ermöglichen.
Im Vergleich zu traditionellen Marktstruktur-Skripten, die Change of Character (CHoCH) und Break of Structures (BOS) beinhalten, umfasst dieses Skript auch die Erkennung von Inducements (IDM) und Sweeps, die wichtige Komponenten bei der Bestimmung anderer Strukturen sind, die auf dem Chart angezeigt werden.
SMC- und Price-Action-Händler haben in der Vergangenheit diese Komponenten als eine genauere Darstellung der Marktstruktur angesehen.
ANWENDUNG
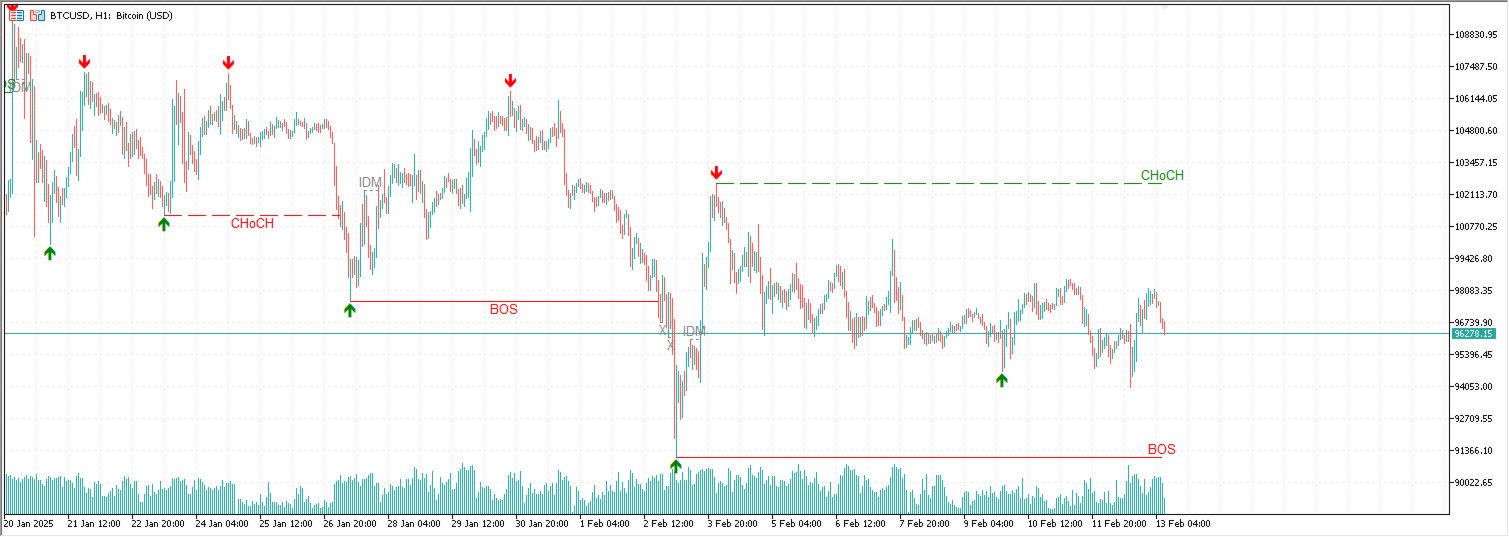
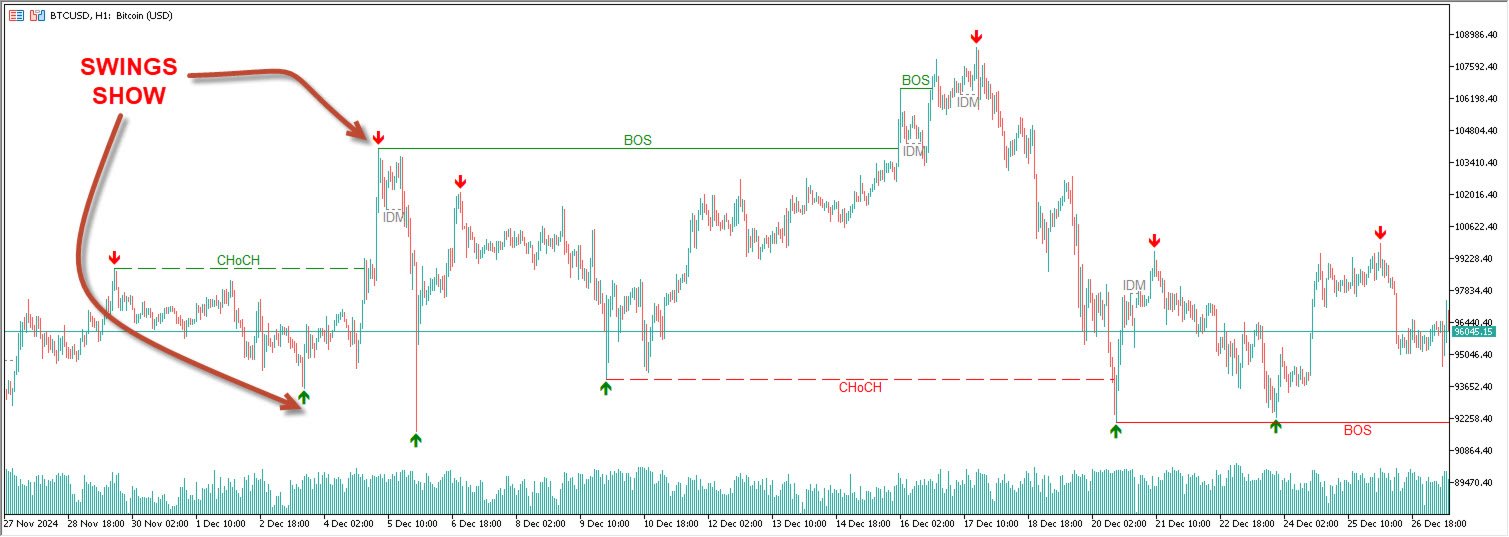
Hier sehen Sie ein Diagramm, das zeigt, wie die Marktstruktur innerhalb des Indikators "Marktstruktur mit Anreizen und Liquidität" angezeigt wird.
Zeichenwechsel (CHoCH) undStrukturbruch
Change of Characters (CHoCH) basieren auf der Erkennung von Swing-Punkten, während Break of Structures (BOS) auf den nachlaufenden Höchst- und Tiefstwerten der erkannten Change of Characters basieren. Wir tun dies für eine dynamischere und zeitgerechtere Anzeige der Marktstruktur.
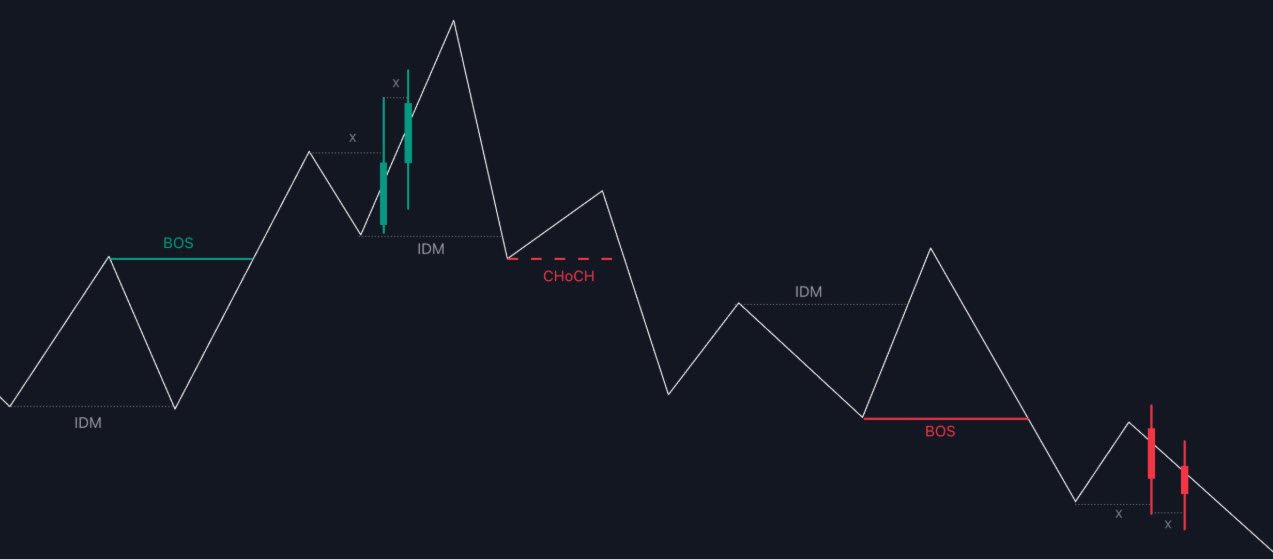
Inducements (IDM)
Händler, die Inducements als Teil ihrer Analyse von Change of Characters & Break of Structures berücksichtigen, können Fakeouts innerhalb von Trends leichter vermeiden, wie unten gezeigt.
In diesem Skript sind IDMs immer zwischen den einzelnen Marktstrukturen erforderlich.
Sweeps of Liquidity (x)
SMC-Händler, die die Marktstruktur richtig analysieren wollen, müssen nach Sweeps of Liquidity Ausschau halten, um sicherzustellen, dass Levels, die durchbrochen werden, als Sweeps vermerkt werden, während Levels, die darüber oder darunter vollständig geschlossen sind, als bestätigte Marktstrukturen gekennzeichnet werden.
Die Liquiditäts-Sweeps basieren auch auf dem nachlaufenden Maximum/Minimum, was eine kontinuierliche Bewertung der Bereiche ermöglicht, in denen Liquiditäts-Sweeps auftreten können.
Dies kann für Händler hilfreich sein, die nach länger- und kurzfristigen Sweeps suchen.
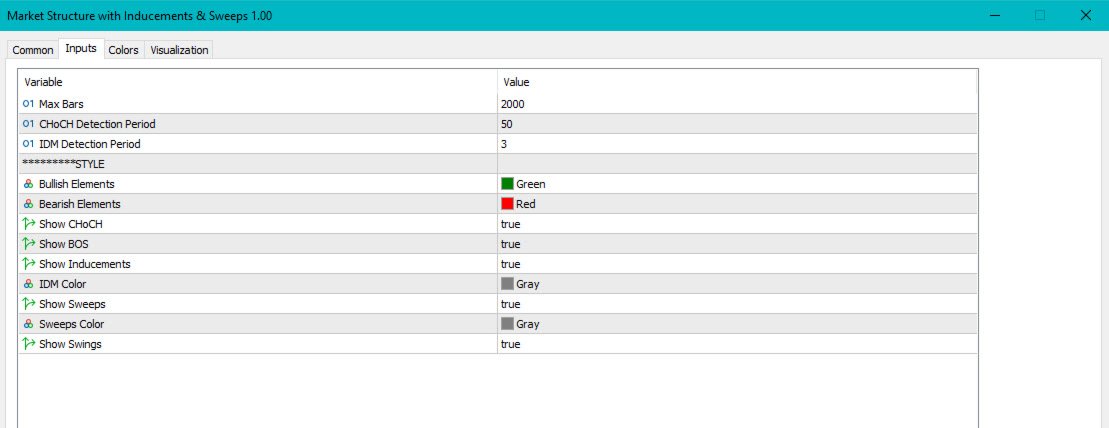
EINSTELLUNGEN
- CHoCH-Erkennungszeitraum: Erkennungszeitraum für CHoCH's, höhere Werte liefern längerfristige CHoCH's.
- IDM-Erkennungszeitraum: Erkennungszeitraum für IDM's, höhere Werte ergeben längerfristige IDM's.