All Time Frames RSI with Alert MT4
- Indikatoren
- Version: 3.8
- Aktualisiert: 25 April 2020
- Aktivierungen: 5

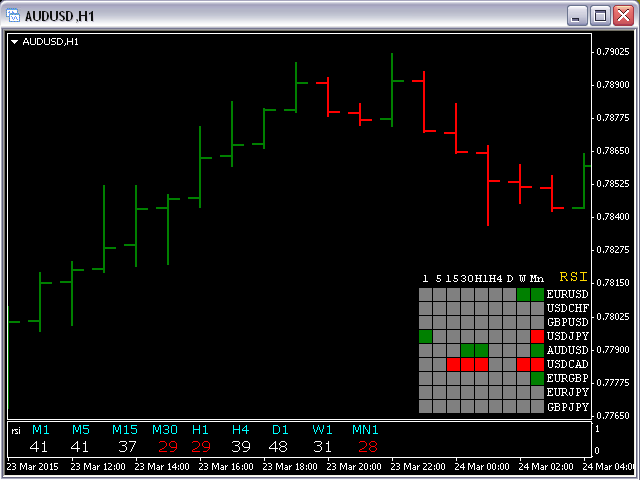
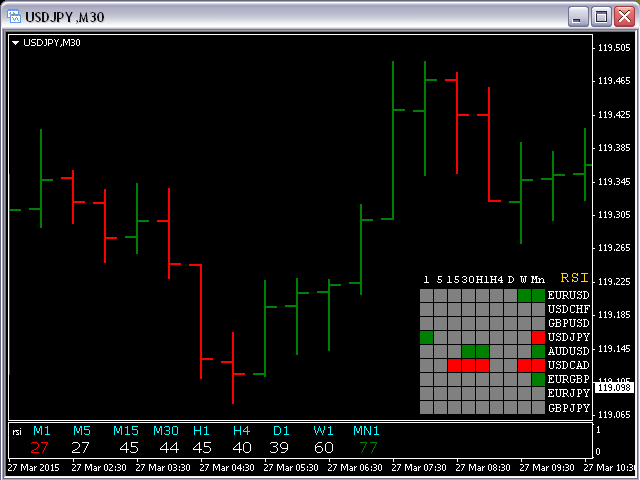
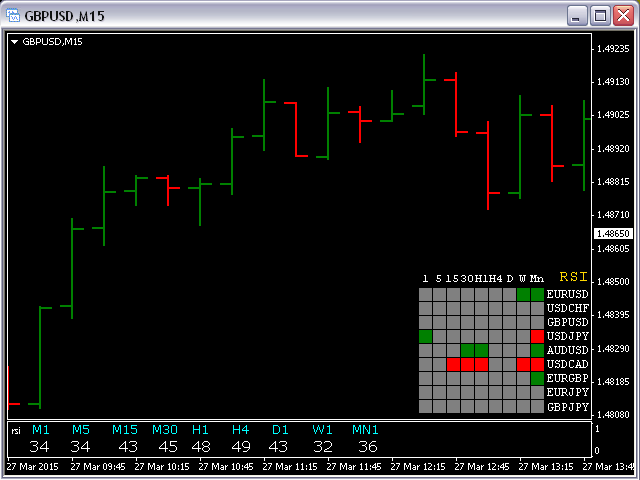
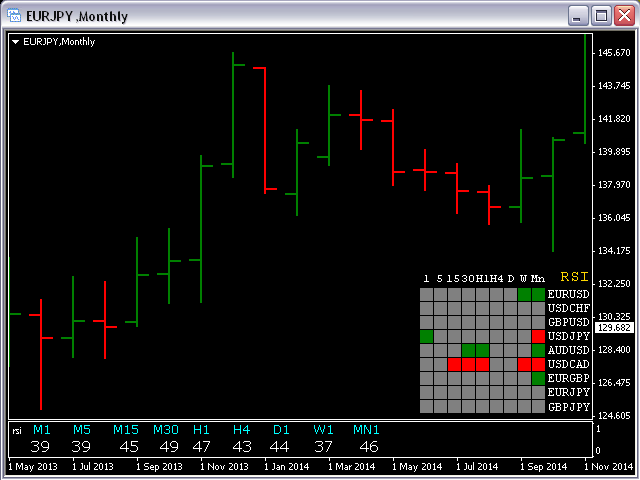
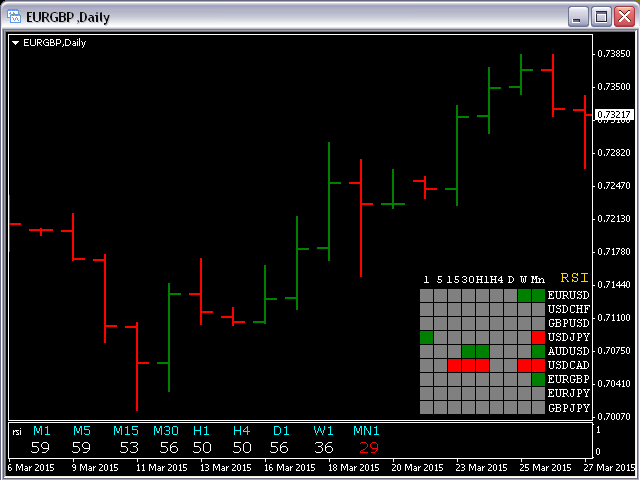
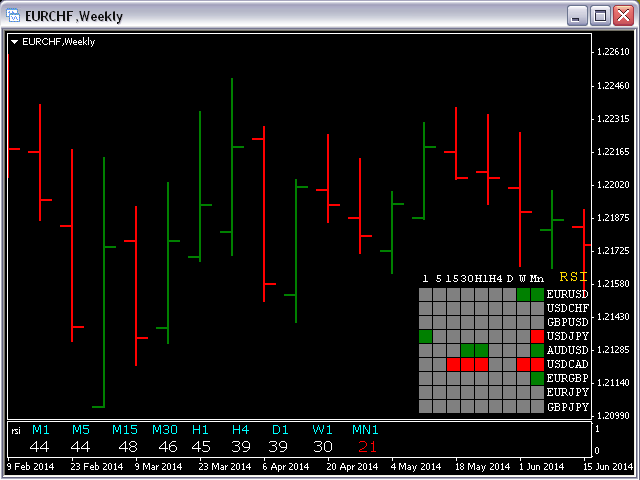
Dieser Indikator zeigt Daten von 9 Währungspaaren Ihrer Wahl aus allen 9 Zeitrahmen an.
Wenn ein digitaler Wert des RSI kleiner oder gleich DnLevel = 30 (oder eine von Ihnen festgelegte Zahl) ist, wird ein grünes Quadrat angezeigt. Dies ist (potenziell) eine überverkaufte Situation und vielleicht ein guter Zeitpunkt, um Long zu gehen.
Wenn ein digitaler Wert des RSI größer oder gleich UpLevel = 70 (oder eine andere von Ihnen festgelegte Zahl) ist, wird ein rotes Quadrat angezeigt. Dies ist (potenziell) ein überkaufter Zustand und vielleicht ein guter Zeitpunkt, um zu verkaufen.
Wenn ein digitaler Wert des RSI zwischen einem UpLevel und einem DnLevel liegt, erscheint ein graues Quadrat.
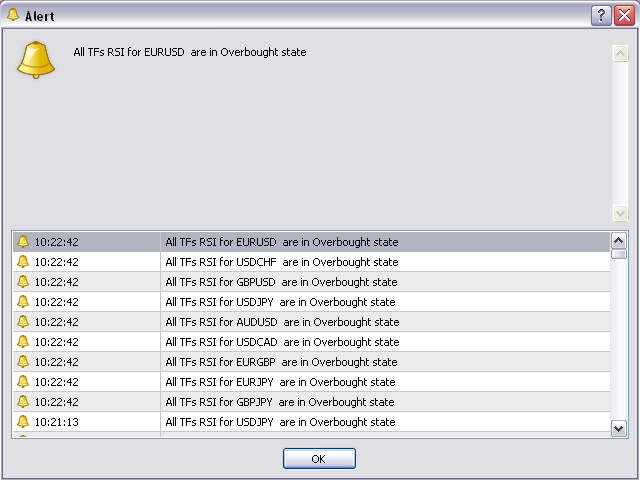
Wenn AlertsEnabled = true ist, wird ein Alarmfeld angezeigt, wenn alle 9 RSI für dasselbe Währungspaar rot oder grün sind.
Eingabeparameter
- AlertsEnabled = true; wenn FALSE, dann werden keine Alerts verwendet;
- UpLevel = 70 - Überkauftes Niveau;
- DnLevel = 30 - Überverkauftes Niveau;
- Von Symb1 bis Symb9 - Sie können jedes dieser Symbole in ein beliebiges legales Währungspaar ändern, das auf Ihrer Plattform vorhanden ist;
- rPeriod = 14 - Mittelungszeitraum für den RSI;
- appPrice = PRICE_CLOSE - Anwendungspreis für den RSI;
- SymbColor = clrWhite - Sie können die Farbe aller Beschriftungen ändern;
Achtung
Bevor Sie diesen Indikator verwenden, müssen Sie alle Charts (alle TF) für alle 9 Währungspaare öffnen.

Without a doubt the worst indicator I’ve purchased on here. The grid, as seen on the listing, does not look like that. There is no grid, just a grey block which covers half of the currency pair names, so you cannot figure out what the little coloured floating in the grey block is signalling. There is no rsi window on the bottom with the RSIs of all the time frames, as seen in the listing. You will also only receive an alert if all the timeframes have the extend RSIs, which would be very rare. Just poor.