All Time Frames RSI with Alert MT4
- Indicadores
- Versión: 3.8
- Actualizado: 25 abril 2020
- Activaciones: 5

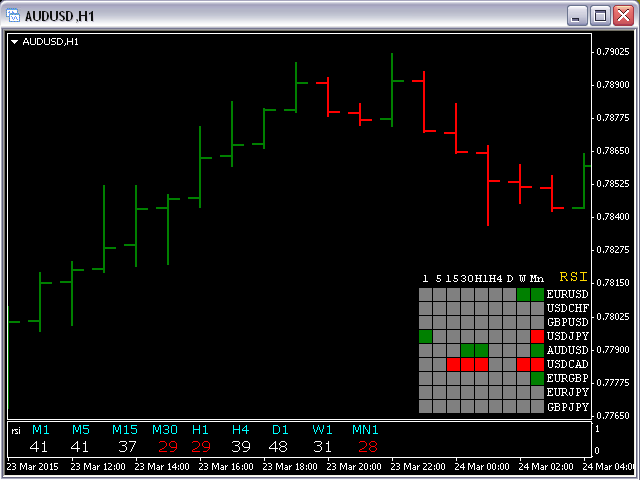
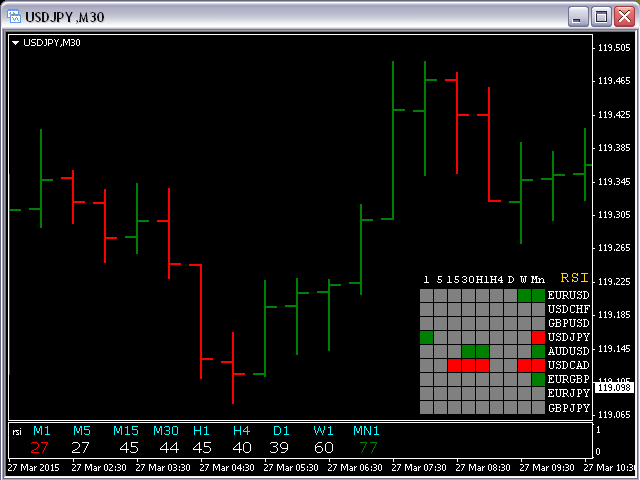
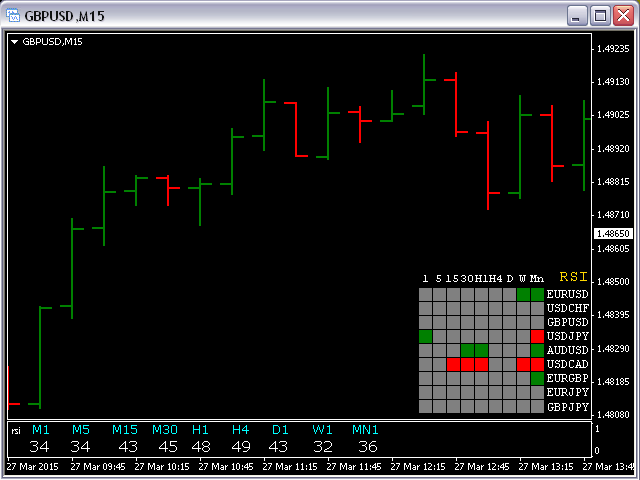
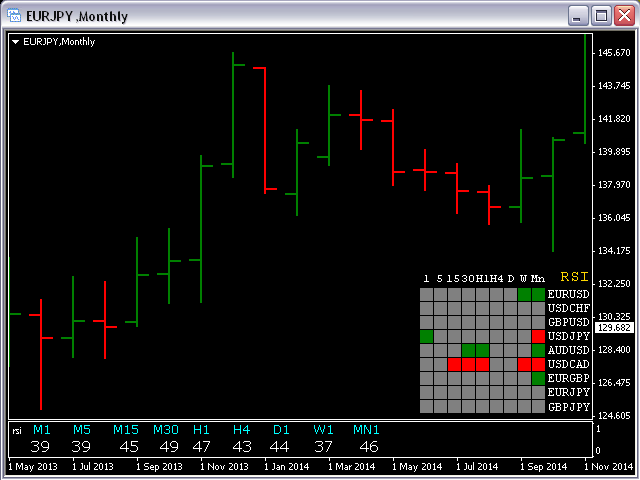
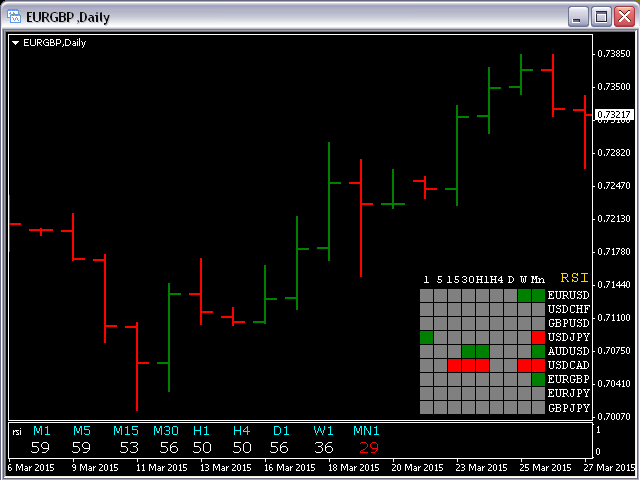
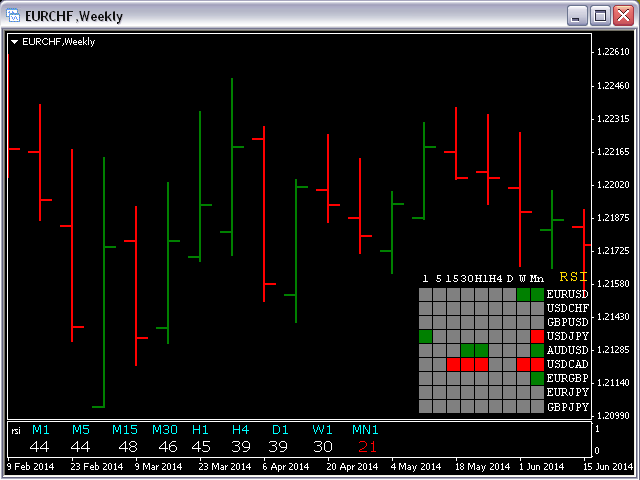
Este indicador muestra datos de 9 pares de divisas a su elección de todos los 9 marcos de tiempo.
Si un valor digital del RSI es menor o igual a DnLevel = 30 (o cualquier número que haya decidido poner), entonces aparecerá un cuadrado verde. Esta es (potencialmente) una condición de sobreventa y tal vez un buen momento para ir en largo.
Si un valor digital del RSI es mayor o igual a UpLevel = 70 (o cualquier número que haya decidido poner), entonces aparecerá un cuadrado Rojo. Esta es (potencialmente) una condición de sobrecompra y tal vez un buen momento para ir en corto.
Si un valor digital del RSI está entre un UpLevel y un DnLevel, entonces aparecerá un cuadrado Gris.
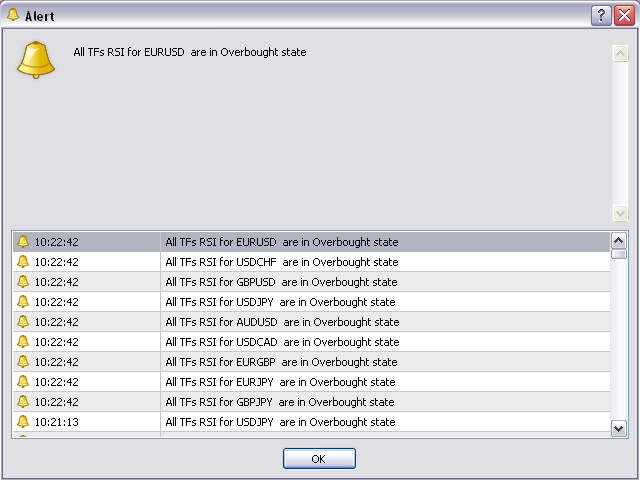
Si AlertsEnabled = true, entonces un cuadro de Alerta aparecerá cuando todos los 9 RSI para el mismo par de divisas sean Rojos o Verdes.
Parámetros de Entrada
- AlertsEnabled = true; si es FALSE, entonces no se utilizan alertas;
- UpLevel = 70 - Nivel de sobrecompra;
- DnLevel = 30 - Nivel de sobreventa;
- De Symb1 a Symb9 - puede cambiar cualquiera de estos Símbolos por cualquier par de divisas legal presente en su plataforma;
- rPeriod = 14 - período de promedio para el RSI;
- appPrice = PRICE_CLOSE - aplicar precio para el RSI;
- SymbColor = clrWhite - puede cambiar el color de todas las etiquetas;
Atención
Antes de utilizar este indicador, tiene que abrir todos los gráficos (todos los TF) para los 9 pares de divisas.

Without a doubt the worst indicator I’ve purchased on here. The grid, as seen on the listing, does not look like that. There is no grid, just a grey block which covers half of the currency pair names, so you cannot figure out what the little coloured floating in the grey block is signalling. There is no rsi window on the bottom with the RSIs of all the time frames, as seen in the listing. You will also only receive an alert if all the timeframes have the extend RSIs, which would be very rare. Just poor.