Harmonic Pattern Plus MT4
- 指标
-
Young Ho Seo
 Harmonic Pattern Indicator - Repainting + Japanese Candlestick Pattern Scanner + Automatic Channel + Many more
https://www.mql5.com/en/market/product/4488 - 版本: 11.3
- 更新: 1 二月 2021
- 激活: 6
Introduction
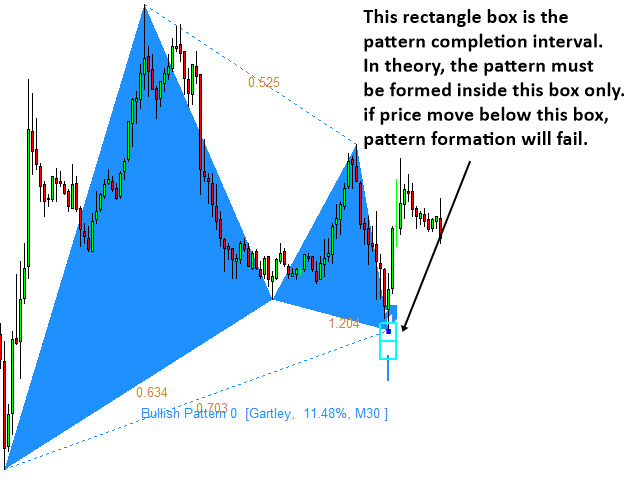
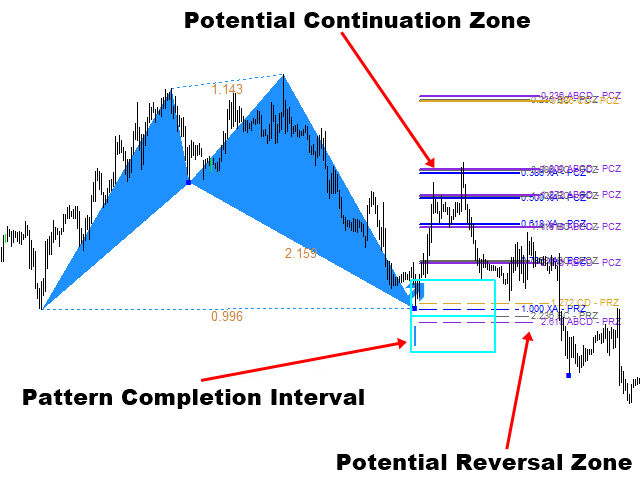
Harmonic Patterns are best used to predict potential turning point. Traditionally, Harmonic Pattern was identified manually connecting peaks and troughs points in the chart. Manual harmonic pattern detection is painfully tedious and not suitable for everyone. You are often exposed under subjective pattern identification with manual pattern detection. To avoid these limitations, Harmonic Pattern Plus was designed to automate your harmonic pattern detection process. The functionality of Harmonic Pattern plus is beyond manual pattern detection and textbook approach. Harmonic Pattern Plus provides many harmonic patterns we have tested in our research. In addition, you can use the three important trading elements including Pattern Completion Interval (PCI), Potential Reversal Zone (PRZ), and Potential Continuation Zone (PCZ) to improve accuracy of your trading. You will experience amazing performance using our Harmonic Pattern Plus for your trading. Especially, pattern completion interval provides the trading zone which you can manage your trading and risk easily.
Main Features
- 11 Harmonic Patterns can be detected automatically
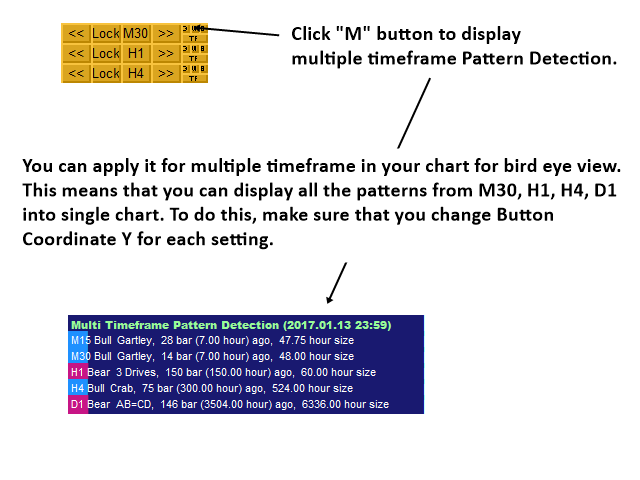
- Support multiple timeframe pattern scanning (This means you need one chart per symbol only.)
- Potential Reversal Zone (PRZ) detection for Point D identification
- Potential Continuation Zone (PCZ) detection for future price movement prediction
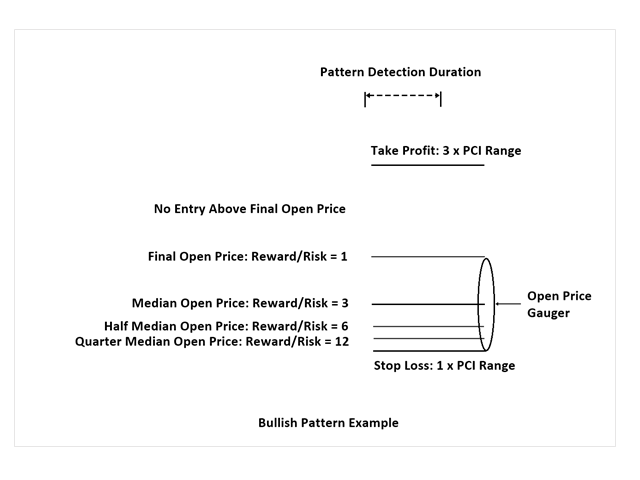
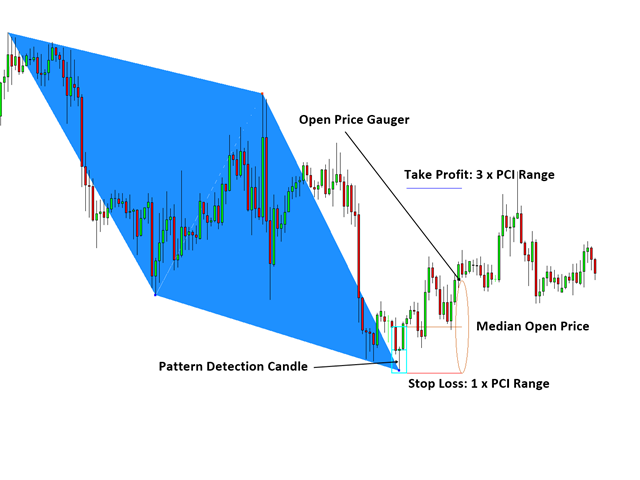
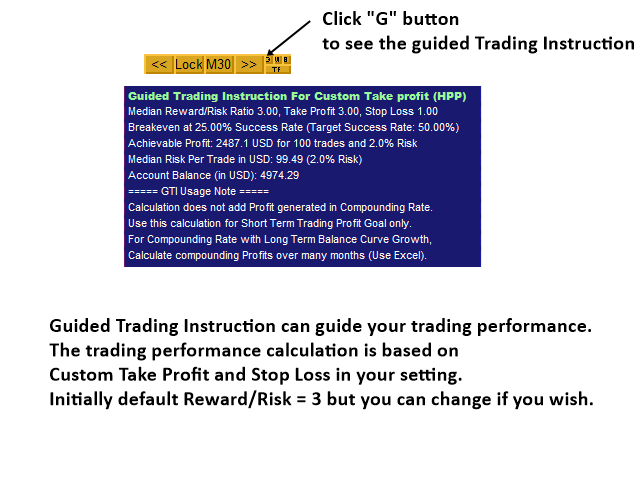
- Pattern Completion Interval (PCI) detection for precision trading
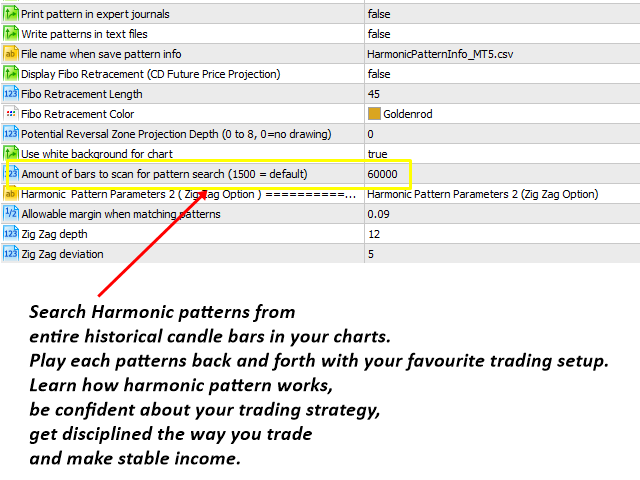
- Historical pattern forward and backward reply function to create new trading strategy
- Pattern locking and unlocking feature to prevent repainting of patterns
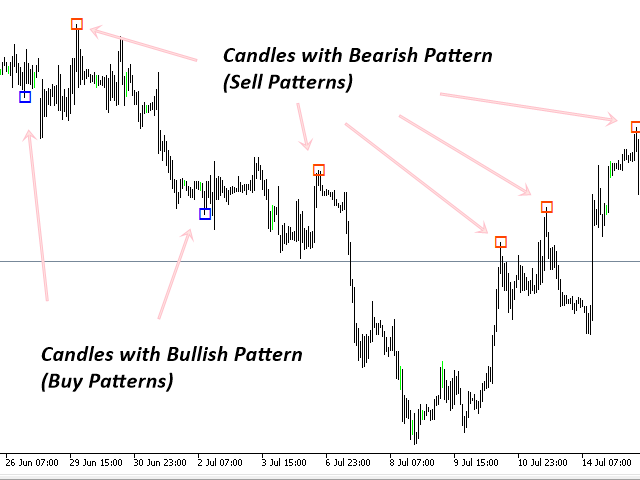
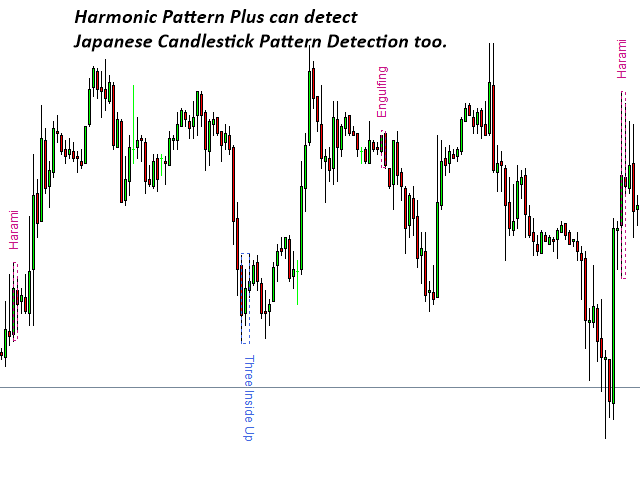
- 52 different bullish and bearish Candlestick pattern recognition feature
- Support Email, Sound alerts or Push Notification
Recognizable and Tradable Patterns
- Butterfly
- Gartley
- Bat
- Alternate Bat
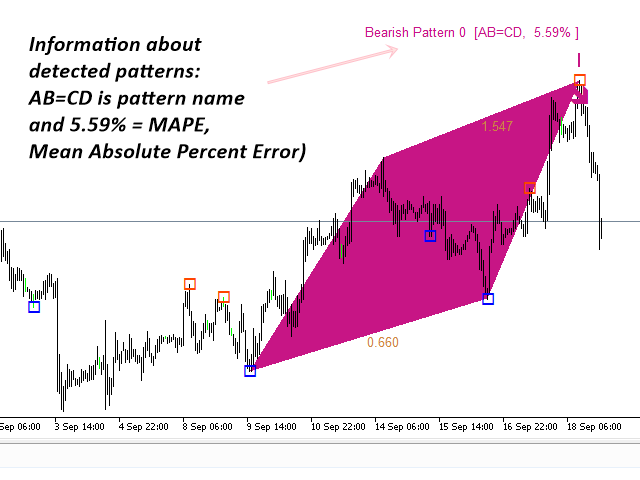
- AB=CD
- Shark
- Crab
- Deep Crab
- Cypher
- 5-0 Patterns
- 3 Drives Pattern
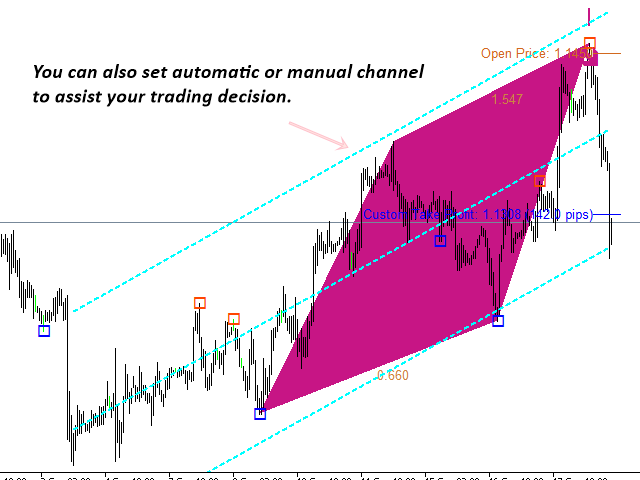
- Automatic drawing of Linear regression channel
- Candlestick patterns: detect 52 different bearish and bullish candlestick patterns. The candlestick patterns include hanging man, shooting star, engulfing, doji, harami, kicking, etc. Our Candlestick Pattern detection algorithm uses purely price action only.
Indicator Setting and Parameters
Default setting will work most of time. If you want to change how the indicator looks in your chart, you can certainly change them from input setting. All the input settings are self-explanatory. The simple description is given on left hand side columns and you need to change value on your right hand side columns.
Trading Strategy Guide
In fact, the detailed trading strategy with harmonic pattern can be found from the link below:
https://www.mql5.com/en/blogs/post/747647
For the most important trading strategy, you can have a look at the Young’s Mutual Pattern Turning Point Strategy in the following books: Guide to Precision Harmonic Pattern Trading and Science Of Support, Resistance, Fibonacci Analysis, Harmonic Pattern, Elliott Wave and X3 Chart Pattern.
Important Note
This is the off the shelf product. Therefore, we do not accept any modification or customization request on this product. In addition, we do not provide any code library or any support for your coding for this product.
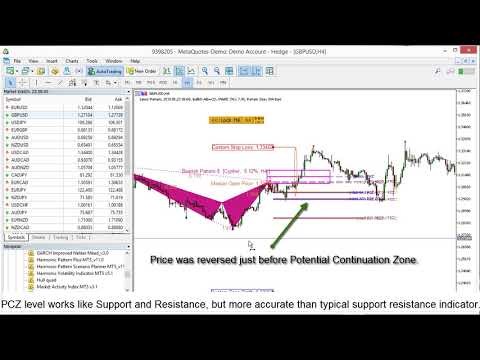


I like everything about this indicator and all of its components.