BoxInside MT4
- 指标
-
Evgeny Shevtsov
 Indicators for volume trading :
Volume profile,
Classic profile,
Clusters chart,
Demand and supply levels,
Demand and supply diagram,
Cumulative delta.
Indicators for probabilistic analysis :
Monte Carlo predictor,
Neural predictor. - 版本: 2.8
- 更新: 10 十一月 2024
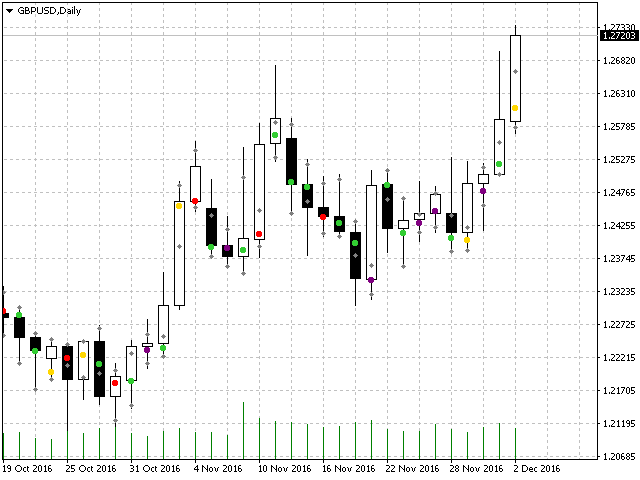
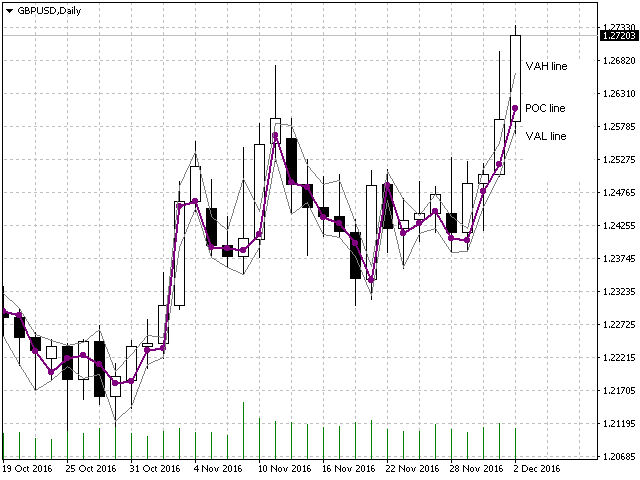
This indicator calculates the volume profile and places labels that correspond to the VAH, VAL and POC levels, for each candle individually.
Indicator operation features
The indicator works on the timeframes from M5 to MN, but it uses the history data of smaller periods:
- M1 - for periods from M5 to H1,
- M5 - for the H4 period,
- M30 - for the D1 period,
- H4 - for the W1 period,
- D1 - for the MN period.
The color and location of the VAL, VAH and POC labels on the current candle are considered to be correct only near the Close time of the candlestick.
Input variables
- ValueArea - box price area in percents.
- ValueAreaType - price area calculation method:
- OfPocND - normal distribution relative to the POC level.
- OfTotalVolume - distribution based on the amount of volume traded in the profile.
- VolumesType - type of volumes used in the calculations:
- Tick - tick volumes.
- Real - real volumes, if broadcasted by the broker.
- Without - ignore volumes, calculation according to the TPO principle.
- DrawingMode - display mode:
- Dots - in the form of labels for the VAL, VAH and POC levels on each candle.
- Curves - in the form of curves connecting the VAL, VAH and POC levels on each candle.
- BarsLimit - limit on the number of candles for plotting the profile.
- VALColor - color for the VAL labels or for the curve connecting the VAL labels.
- VAHColor - color for the VAH labels or for the curve connecting the VAH labels.
- LowestBoxColor, LowBoxColor, MiddleBoxColor, MediumBoxColor, HighBoxColor, HighestBoxColor - group of variables that define the color for the labels of the POC levels, depending on the volume at each of these levels.


Self explanatory rating and description to the indicator. Admirable how each candlestick is to receive the info. Greatly appreciated!