Clever Trend Force MT5
- 指标
- 版本: 1.44
- 更新: 29 十二月 2023
- 激活: 5

KEY LINKS: Indicator Manual – How to Install – Frequent Questions - All Products
Description:
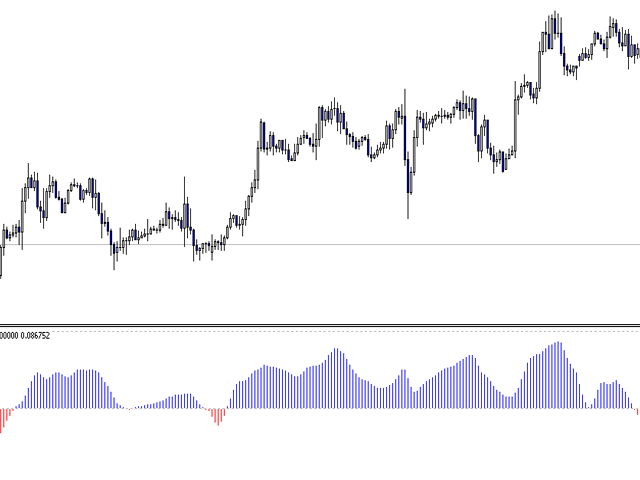
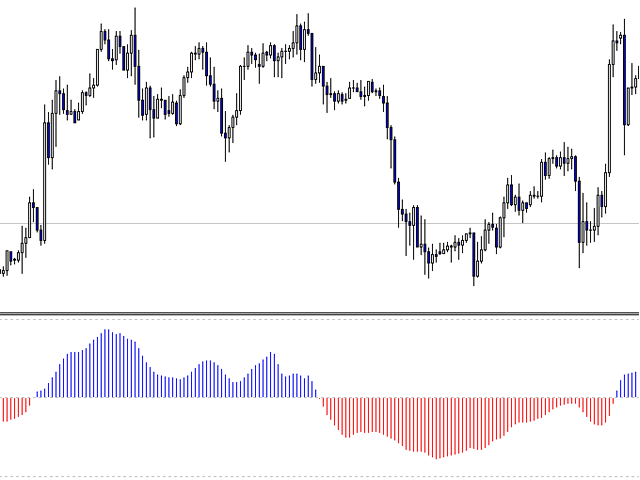
Indicator which uses trend, breakout and reversal innovative indicators to show a complete visual trading strategy, with transparent metrics. It follows simple visual patterns, which will improve your trading significantly.
Support: We create great tools for the entire trading community. Most of them are free.
If you believe in what we do Support Us Here.
Outstanding Features
- Shows current trends and changes amongst them.
- Shows possible levels of exhaustion for a current trend.
- No repaint version and we provide a set adapted to each asset.
- MA Indicator to detect short-term changes of a trend.
Note 1: This indicator should only be considered as a part of any trading strategy. You should complement this with other filters (e.g trend, volatility, time, etc).
Note 2: This indicator is meant to serve as a guide to apply in your intraday trading. Overtime, this will help you understand the baseline for a solid and consistent trading strategy.
About Author:
Carlos Forero, Member of Clever Trading Club, private organization with the purpose of design clever solutions to generate constant profits with adapted risk.