Clever Trend Force MT5
- インディケータ
-
Carlos Forero
 私は、資本市場およびアルゴリズムによるポートフォリオ構築において10年以上の経験を持つ、プロの開発者およびトレーダーです。MetaTrader向けの高度な自動化システムとテクニカル分析ツールの開発を専門としています。
⚙️ 開発哲学
私のアプローチは厳密に定量的かつデータ主導型です。市場のノイズを排除し、真の統計的優位性を提供するようにシステムを設計しています。近道を探すのではなく、数学と論理を取引に応用しています。
🔷 私のツールに期待できること
✅ 機関投資家レベルの品質: 最高水準のプログラミング基準で構築されたインジケーターとエキスパートアドバイザー(EA)。 - バージョン: 1.44
- アップデート済み: 29 12月 2023
- アクティベーション: 5
KEY LINKS: Indicator Manual – How to Install – Frequent Questions - All Products
Description:
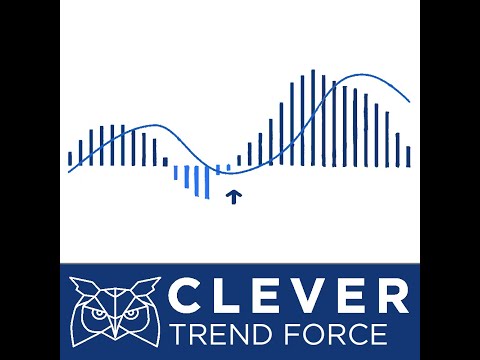
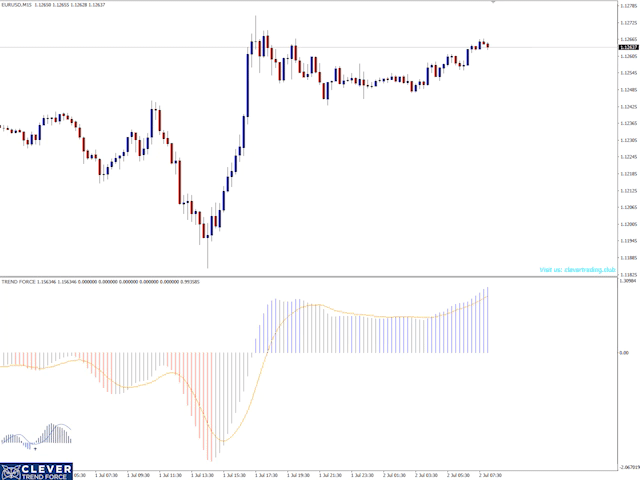
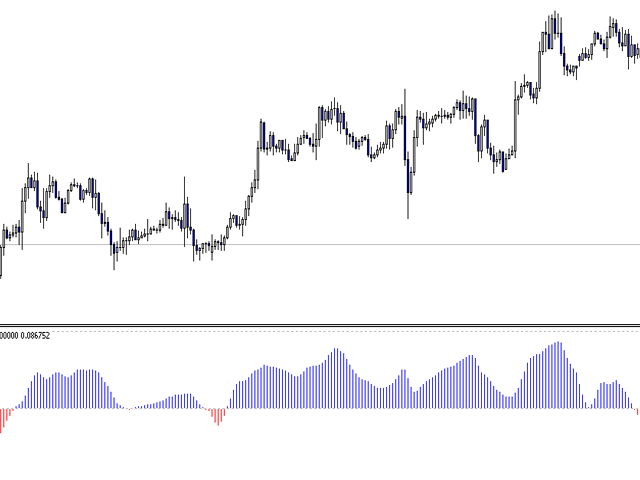
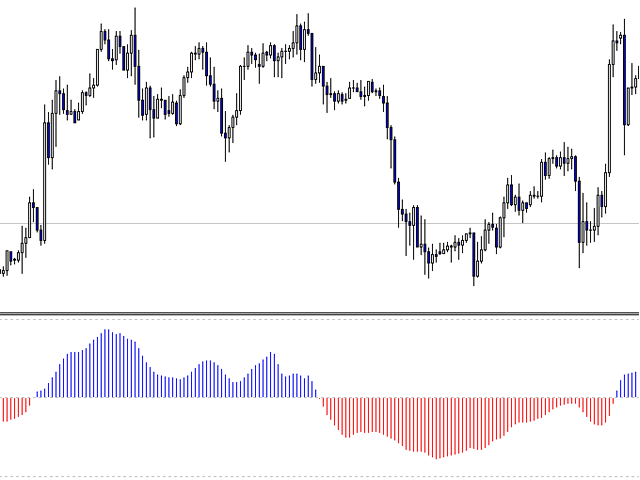
Indicator which uses trend, breakout and reversal innovative indicators to show a complete visual trading strategy, with transparent metrics. It follows simple visual patterns, which will improve your trading significantly.
Support: We create great tools for the entire trading community. Most of them are free.
If you believe in what we do Support Us Here.
Outstanding Features
- Shows current trends and changes amongst them.
- Shows possible levels of exhaustion for a current trend.
- No repaint version and we provide a set adapted to each asset.
- MA Indicator to detect short-term changes of a trend.
Note 1: This indicator should only be considered as a part of any trading strategy. You should complement this with other filters (e.g trend, volatility, time, etc).
Note 2: This indicator is meant to serve as a guide to apply in your intraday trading. Overtime, this will help you understand the baseline for a solid and consistent trading strategy.
About Author:
Carlos Forero, Member of Clever Trading Club, private organization with the purpose of design clever solutions to generate constant profits with adapted risk.