Clever Trend Force MT5
- Indicateurs
-
Carlos Forero
 Je suis un développeur et trader professionnel avec plus d'une décennie d'expérience sur les marchés des capitaux et dans la création de portefeuilles algorithmiques. Je suis spécialisé dans les systèmes automatisés avancés et les outils d'analyse technique pour MetaTrader.
 - Version: 1.44
- Mise à jour: 29 décembre 2023
- Activations: 5
KEY LINKS: Indicator Manual – How to Install – Frequent Questions - All Products
Description:
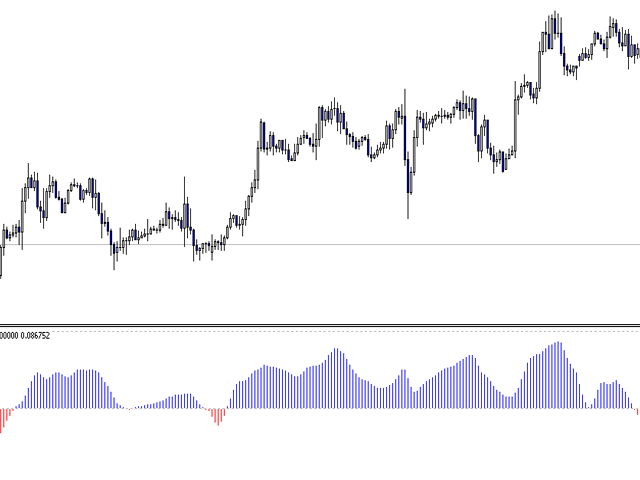
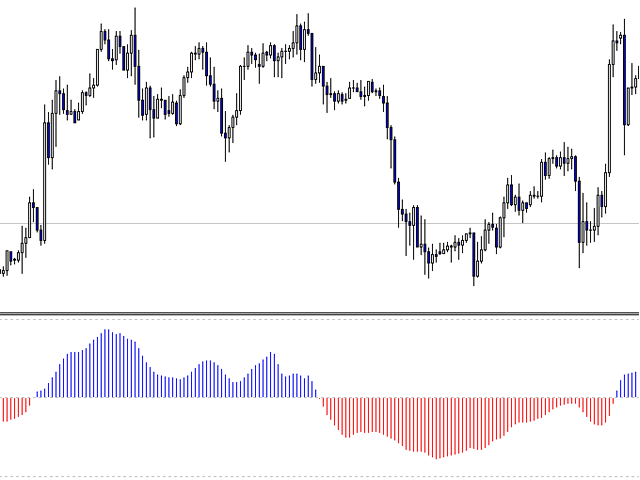
Indicator which uses trend, breakout and reversal innovative indicators to show a complete visual trading strategy, with transparent metrics. It follows simple visual patterns, which will improve your trading significantly.
Support: We create great tools for the entire trading community. Most of them are free.
If you believe in what we do Support Us Here.
Outstanding Features
- Shows current trends and changes amongst them.
- Shows possible levels of exhaustion for a current trend.
- No repaint version and we provide a set adapted to each asset.
- MA Indicator to detect short-term changes of a trend.
Note 1: This indicator should only be considered as a part of any trading strategy. You should complement this with other filters (e.g trend, volatility, time, etc).
Note 2: This indicator is meant to serve as a guide to apply in your intraday trading. Overtime, this will help you understand the baseline for a solid and consistent trading strategy.
About Author:
Carlos Forero, Member of Clever Trading Club, private organization with the purpose of design clever solutions to generate constant profits with adapted risk.