Quant Key Levels

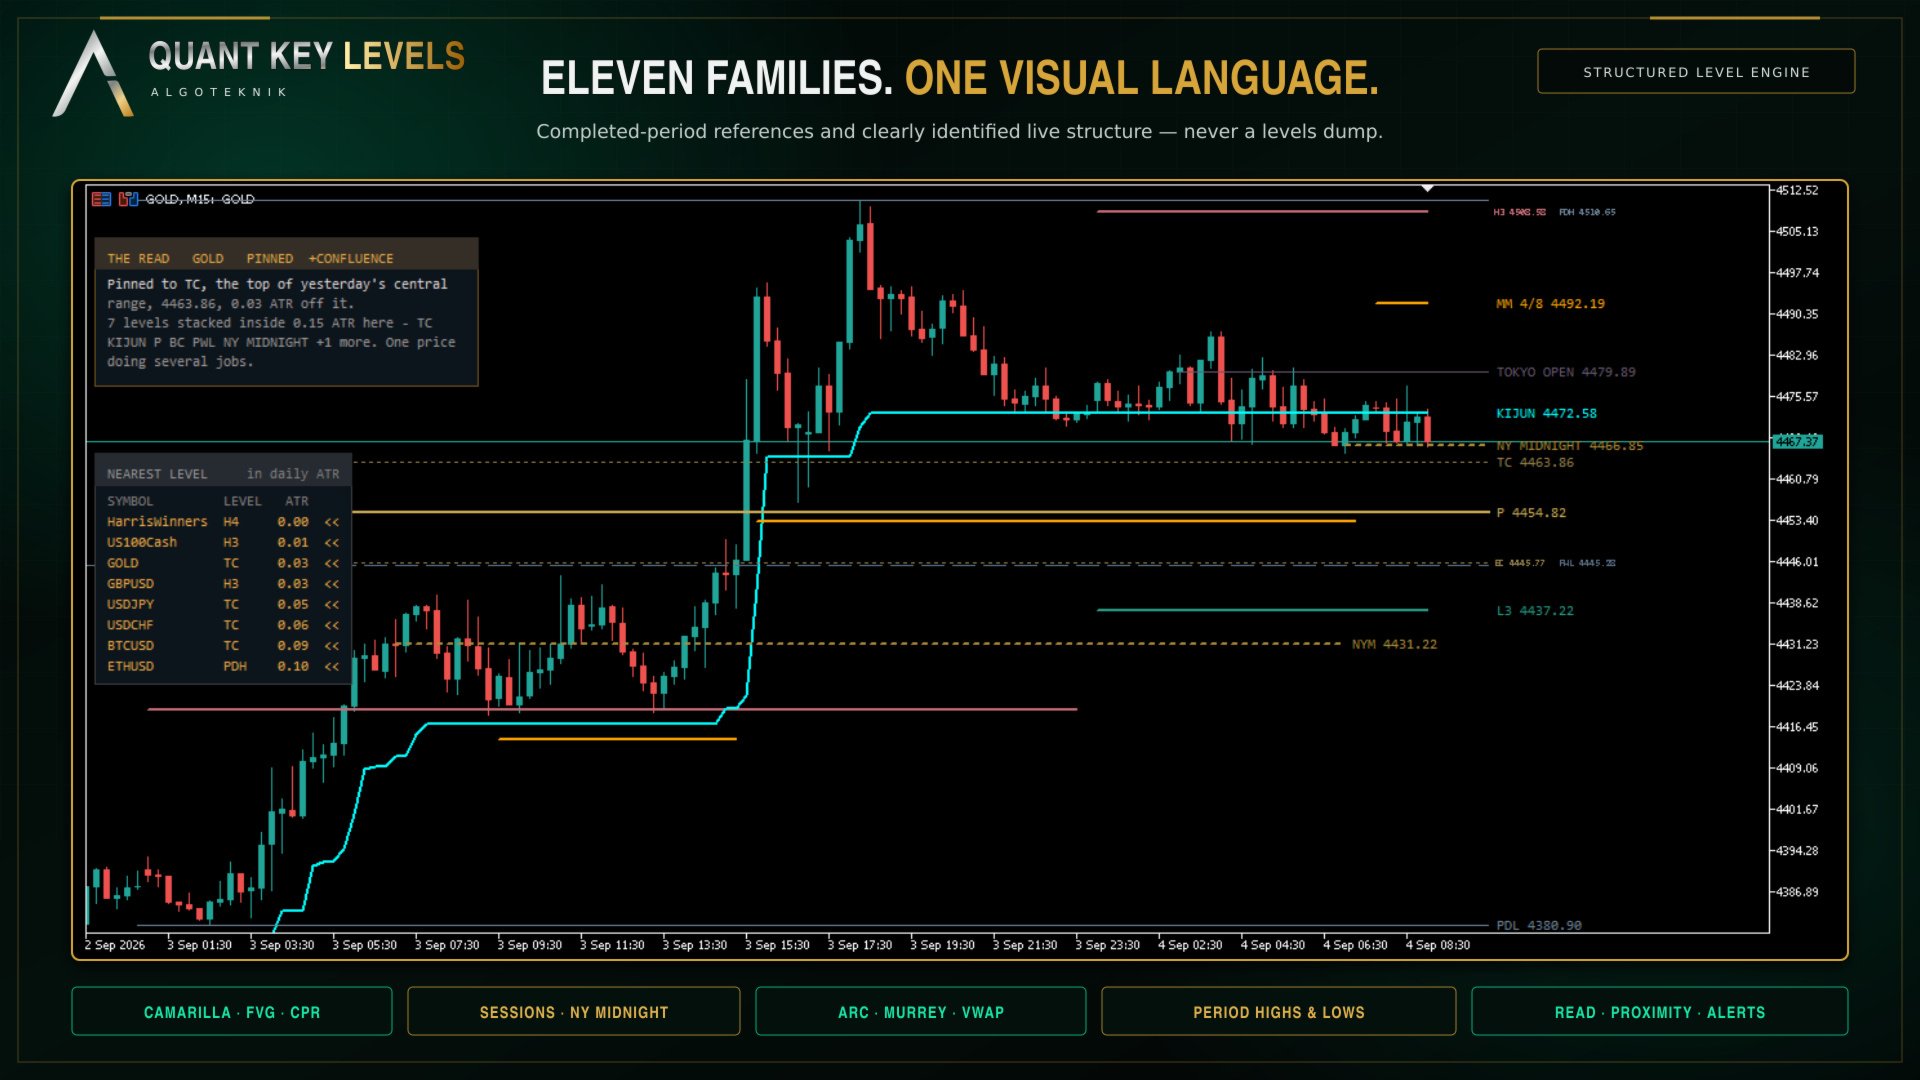
Quant Key Levels, version 1.0. The reference levels a discretionary trader actually works from, on one chart and in one visual language. Eleven families, each on its own switch, and nothing on the chart that a level does not earn.

What separates it from a pivot pack is not the number of families. It is that the things most level tools assume, this one measures. How far your broker's clock sits from UTC, measured out of your own terminal rather than typed into a box. Where an exchange actually opens, to the minute, on that exchange's own daylight saving calendar. How wide a pivot range is, in the symbol's own average day rather than in points that mean nothing across instruments. And what it measures it shows you: the offset goes in the journal and optionally on the chart, the range width is written on its label, the distance to the nearest level is a number you can read.

Every level is defined from a period that has already closed, so once it is drawn it does not move. There is exactly one exception and it is marked as such, today's running high and low, which is a live range by definition. Where the numbers can be checked against something you already own, they are: the Camarilla family matches the Camarilla Channel that ships with MetaTrader 5, value for value, on the same chart.

Release notes, chart examples and new product announcements are posted on the TrendTower channel: https://www.mql5.com/en/channels/trendtower

The broker clock is measured, not typed in

Three families are built on one number. The true New York midnight open, the six session levels and both daylight saving calendars all run off the broker's distance from UTC. Most level indicators ask you for it, or take it from the server offset, and either way it is wrong twice a year and wrong again when you change broker.

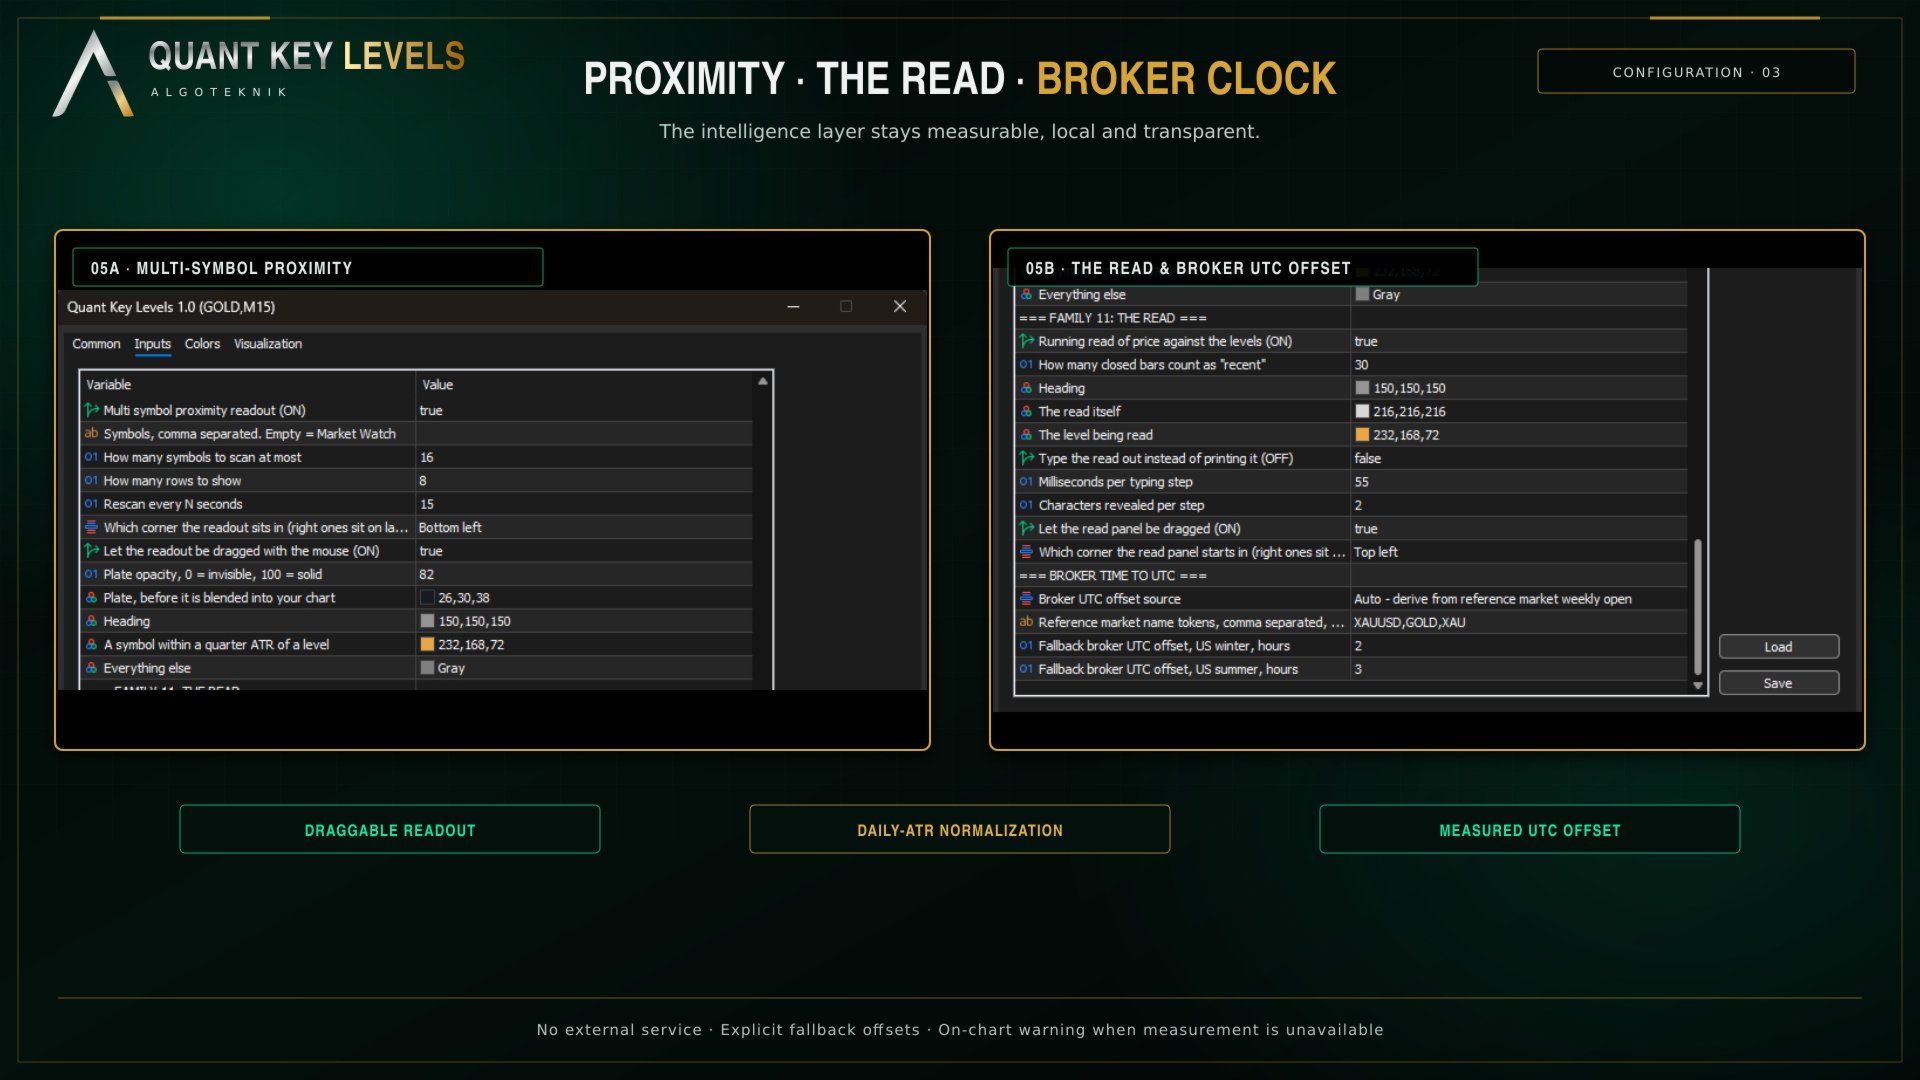
Here it is solved from data. The indicator reads the weekly opening bar of a reference market out of your own terminal and finds the single whole hour offset that puts that opening on Sunday at its known UTC time. There is no internet request, no external service and no library to install. The chart's own symbol is deliberately not used as the anchor: many brokers trim foreign exchange to broker midnight, and that silently produces an offset one hour wrong, so a continuously traded instrument is used and gold is the default. The name tokens searched for are an input.

The answer is reported in the journal at start-up and can be shown on the chart. When it cannot be measured a warning appears that cannot be switched off, because a wrong offset puts those levels on wrong prices while the chart still looks entirely reasonable. In the Strategy Tester, where only the tested symbol is loaded and the reference is usually missing, it says that too, and falls back to manual winter and summer offsets you can set.

Real exchange hours, and two daylight saving calendars

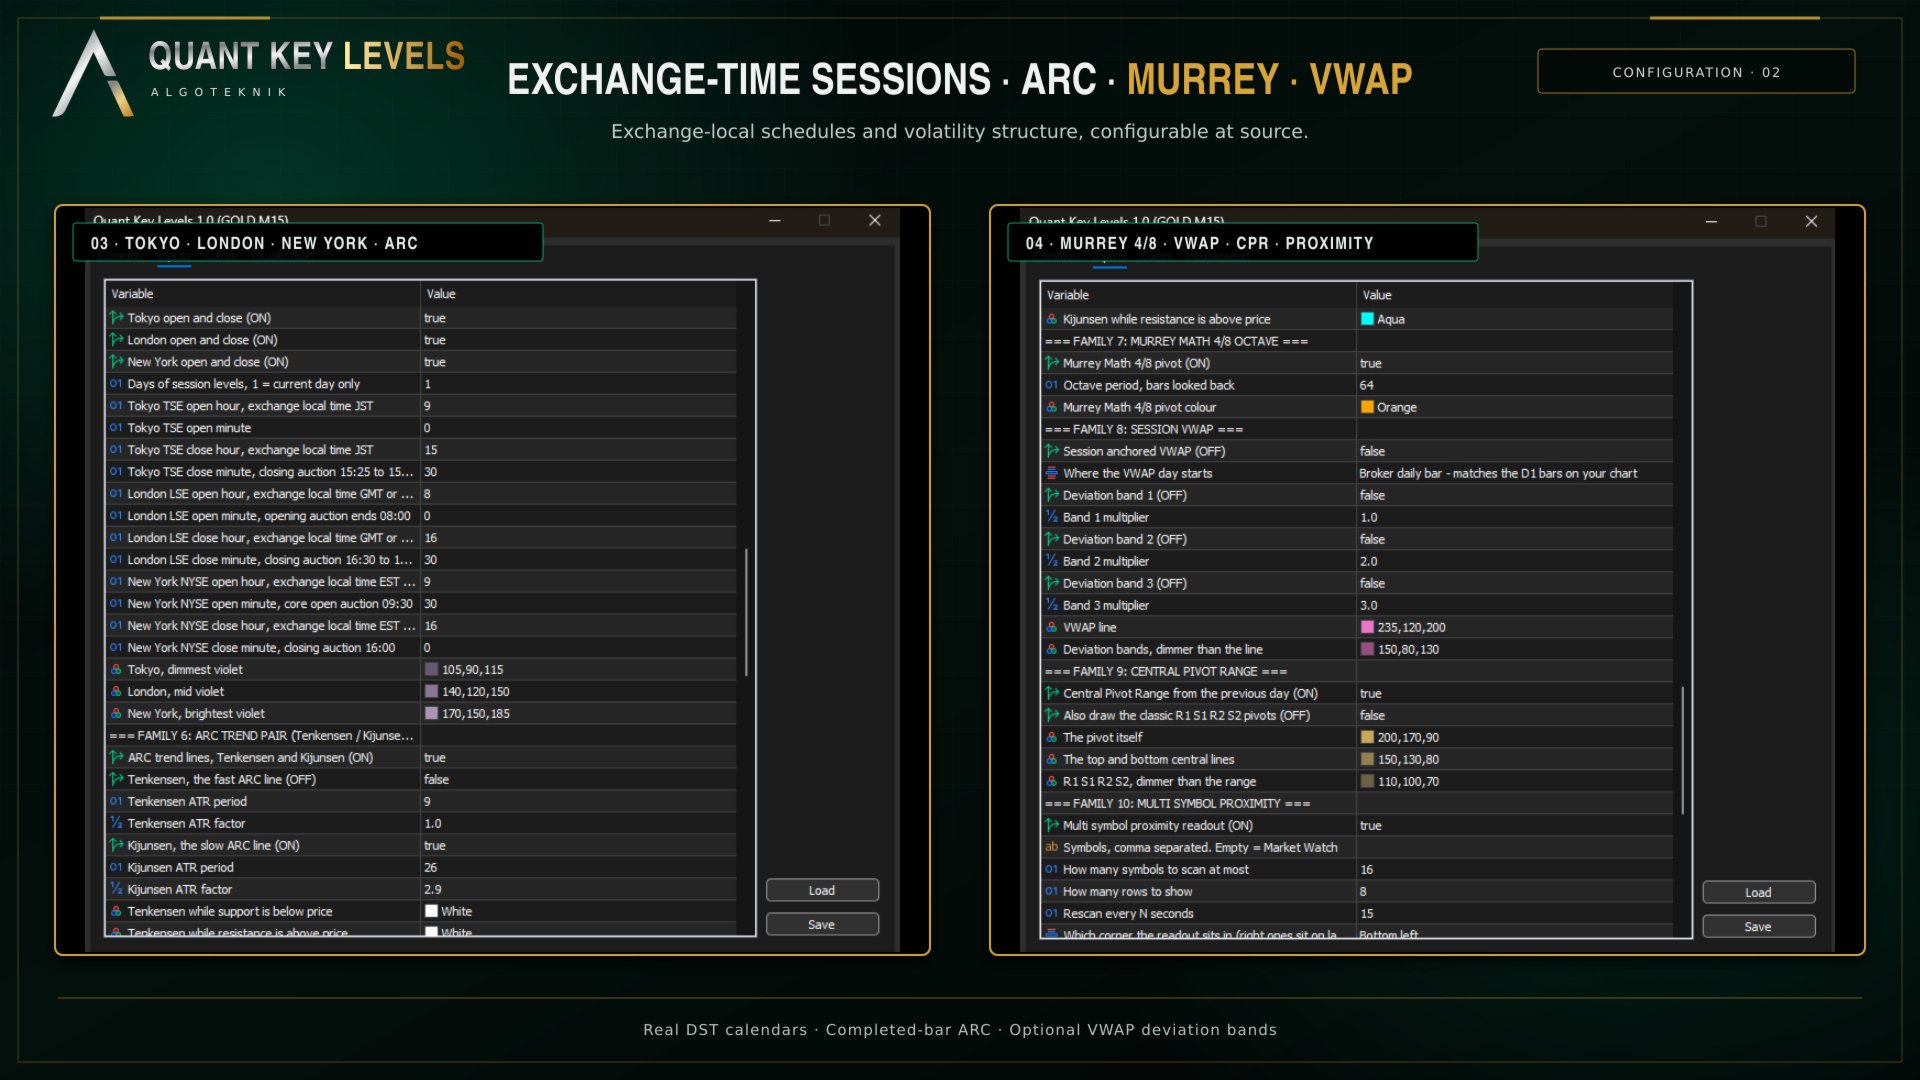
Six price levels, not shaded ranges: the open and the close of Tokyo, London and New York. These are not the rounded 08:00 to 17:00 blocks most session tools draw. They are the published trading hours of the three exchanges, to the minute. Tokyo runs 09:00 to 15:30 JST, with a closing auction from 15:25 that sets the official close, a 15:30 close that has been in force since November 2024, and no daylight saving anywhere in Japan, so it is 00:00 to 06:30 UTC every day of the year. London runs 08:00 to 16:30 London, with an opening auction ending at 08:00 and a closing auction from 16:30, which is 07:00 to 15:30 UTC on British Summer Time and 08:00 to 16:30 UTC on Greenwich Mean Time. New York runs 09:30 to 16:00 Eastern, the core open auction at 09:30 rather than 09:00, which is 13:30 to 20:00 UTC on Eastern Daylight Time and 14:30 to 21:00 UTC on Eastern Standard Time.

Every one of those times is entered as the exchange's own local time, hour and minute, exactly as that exchange publishes it. You never type a UTC number and you never type a summer variant and a winter variant: the conversion and the changeover are done for you, so nothing has to be re-entered twice a year. Change the local times if your working definition of a session differs and the UTC placement and the daylight saving shift stay correct on their own. Each level's tooltip shows both clocks, the UTC instant and the exchange local time with the zone in force that day, so you can check the placement without doing the arithmetic.

The two zones do not switch on the same weekend. In late October the United Kingdom has already fallen back while the United States has not, and for that week London and New York shift on different days. Each zone follows its own calendar here, so that week is handled correctly rather than smoothed over with one shared offset. Open is drawn solid and close dash dot in one violet family, so you can tell an open from a close by pattern alone. A boundary that has not happened yet draws nothing at all, and the close level appears only once the session has actually closed.

One unit: the symbol's own daily ATR

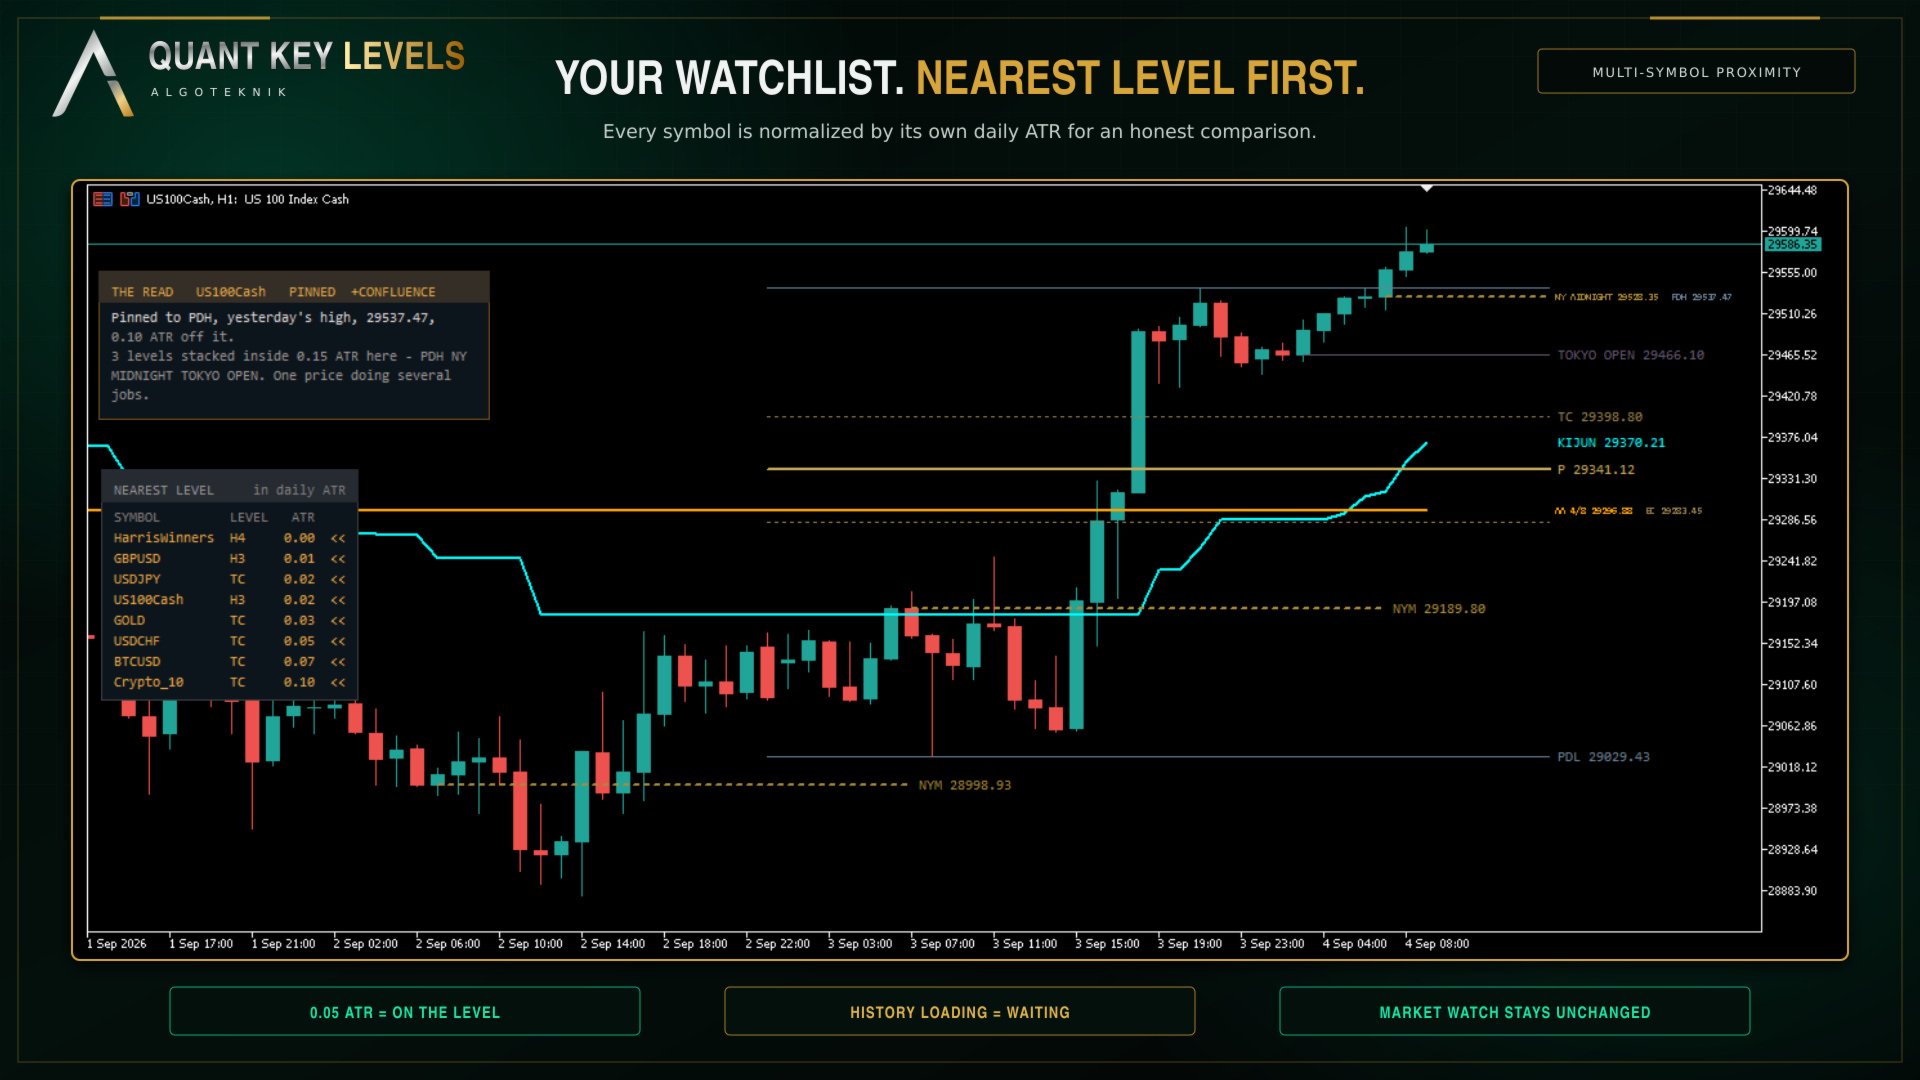
Distance in points does not travel. Forty points is nothing on gold and most of a day on EURUSD, so a number that is supposed to tell you how close price is to a level has to be normalised before it means anything. Everything in this product that reports a distance reports it in that symbol's own daily average true range, and that one decision is what lets a gold row and a EURUSD row sit in the same table and be read against each other.

The same unit measures the Central Pivot Range. P, TC and BC come from yesterday's daily bar, and the reading is the width between TC and BC rather than the lines themselves: narrow says yesterday closed near its own midpoint and the market did not decide, wide says it trended. That width is written on the label as a number, as in “TC 0.42 ATR wide”, so a narrow day is a measurement rather than an impression. TC is not always above BC. When yesterday closed below its own midpoint the pair inverts, and that flip is information, so both are drawn where they fall rather than sorted into a fixed order. The classic R1 S1 R2 S2 ride on the same pivot and ship off, because this family exists for the range.

A running read of the chart, in the language a desk would use

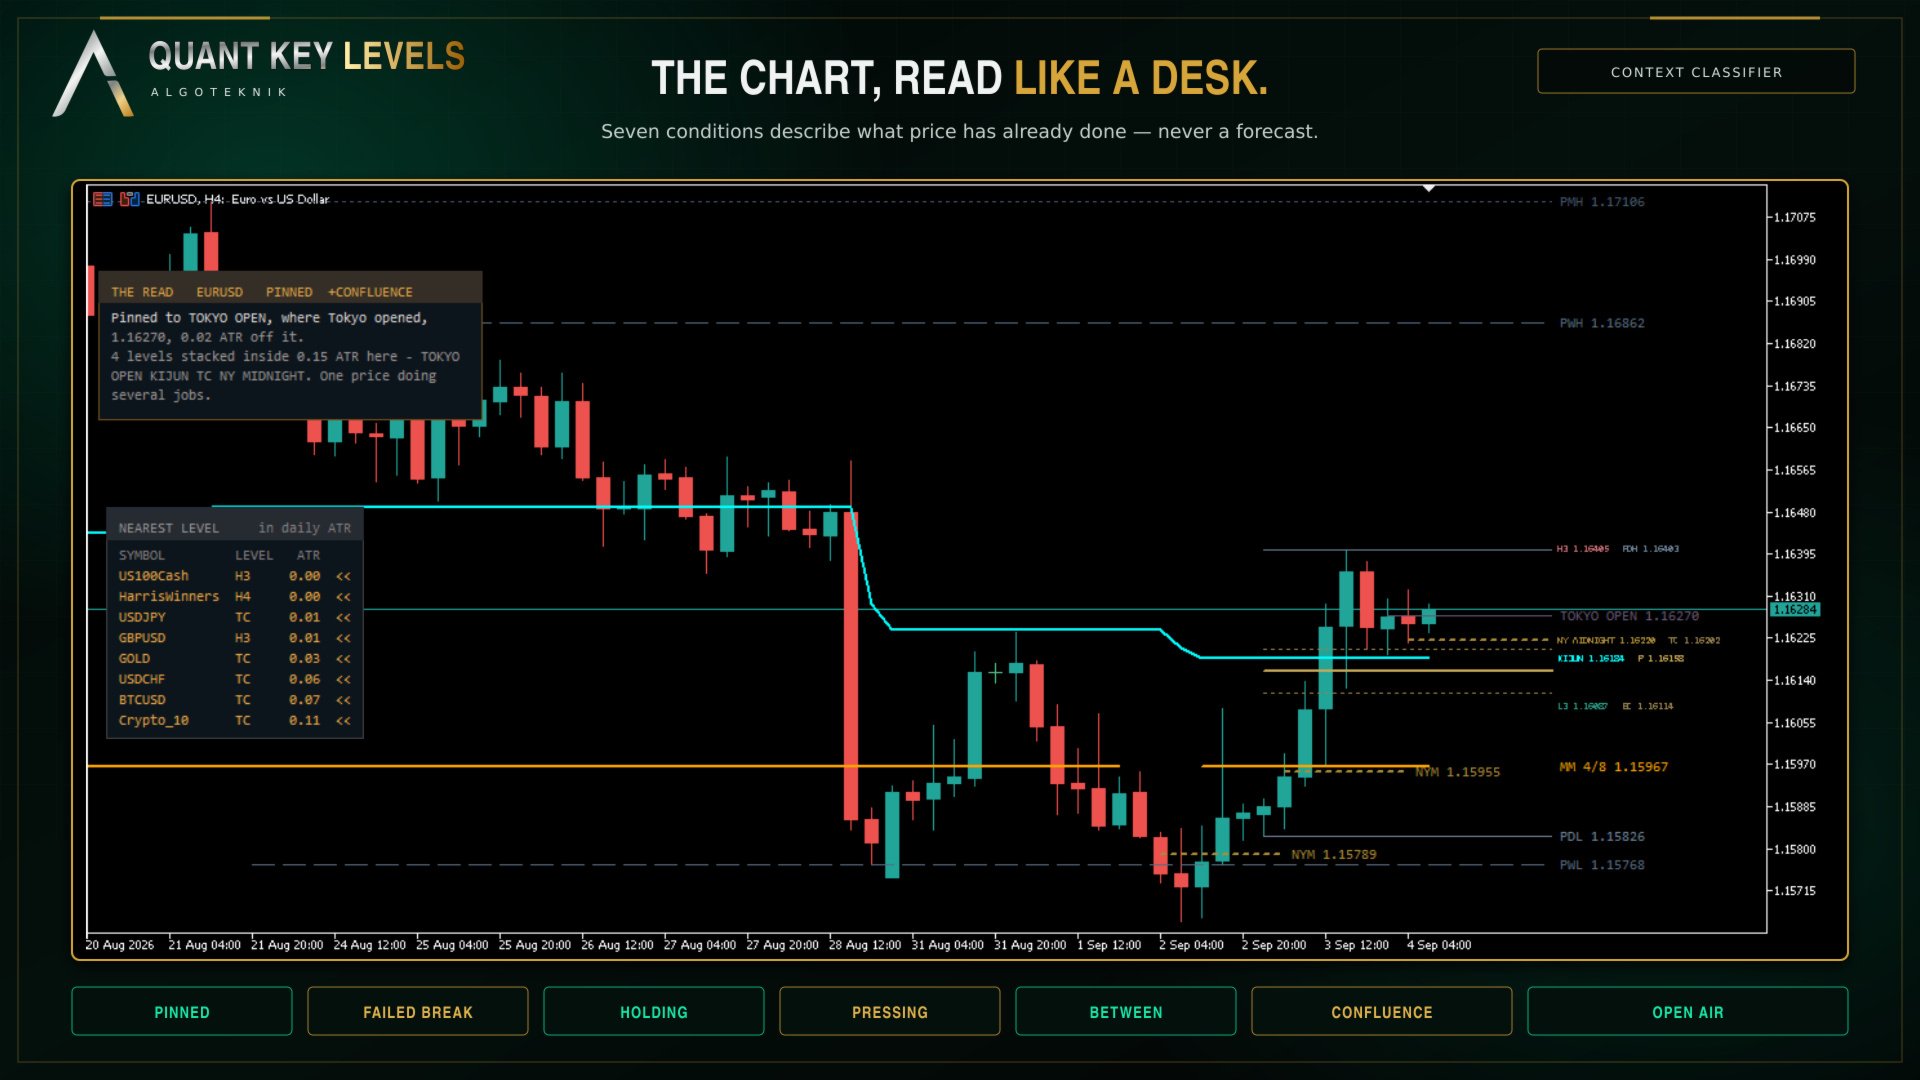
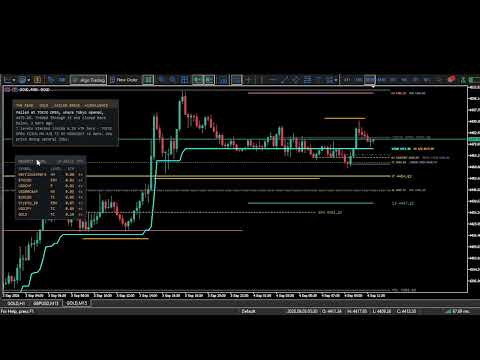
“Pinned to L3 4412.80, 0.04 ATR off it. Four touches in the last thirty bars and no close through.” The read measures the distance from price to every level on the chart in daily ATR, decides which of seven situations that is — pinned, failed break, holding, pressing, between, confluence, open air — and prints the sentence for it with the real numbers in. The panel holds eight lines; on the rare read that fills them the last line ends in three dots, which is the panel saying it ran out of room rather than the read stopping there.

It is a classifier, not a crystal ball, and the distinction is the point: there is no model, no forecast and no network anywhere in this product. Nothing on that panel says where price is going or what to do about it. Every sentence is a statement about what has already happened, which is the only thing a chart can honestly tell you. The same inputs produce the same sentence every time, and it holds its level through the small moves that would otherwise make it flicker between two neighbours.

The question a single chart cannot answer

Which of the things you trade is on a level right now. The multi symbol proximity readout scans your Market Watch, or a list you give it, and reports each symbol's distance to its nearest key level in that symbol's own daily ATR. 0.05 means price is on the level; 1.00 means a full average day away; anything inside a quarter of an ATR is called out. Nine levels per symbol, all from its previous completed daily bar. It never adds anything to Market Watch to fill the list out, and a symbol still downloading its history is shown as waiting rather than reported as a zero. In the Strategy Tester only the tested symbol is loaded, so the readout shows one row there and says so on the plate; that is the tester, not the product. When a symbol has no live quote, because the market is closed or it has not ticked since the terminal opened, its last daily close stands in for the price.

Nothing repaints, and the one thing that moves says so

Every level here is defined from a period that has already closed. The daily average true range that the read, the proximity readout and the pivot range width are measured in is built from closed daily bars only and never touches today's forming bar, so those numbers do not drift through the session. The Murrey octave is computed from the bars before the current one, so it is fixed the moment its bar opens. The ARC pair draws the level as it stood after the previous bar closed. The VWAP value on a closed bar was measured against its own recomputation and never changed afterwards. The single exception is today's running high and low, which is a live range by definition and carries a tilde in its name so it can never be mistaken for a settled level.

Levels that stay readable

A level that is flat for a day and jumps at the boundary is two shelves, not one sloping line. Drawing it as a single continuous line paints a vertical through prices that were never a level, and that is what turns a pivot chart into a staircase. Every family here that steps — the Camarilla set, the Murrey octave, the ARC pair at a side change — is drawn as separate flats with the joining bar left blank.

With everything switched on, eleven families put their levels on the chart and their labels all want the same strip of screen at the right edge. Rather than let them print on top of each other, the labels go into one queue and a single pass lays out the whole column at once. Labels that land within one text height of each other belong to one row, and a shared row is written side by side: they are not merged and nothing is thrown away, so each label keeps its own text, its own price and its own colour. A shared row is set 25 percent smaller than a label that has its row to itself, which is what buys the horizontal space back, and the widths are measured with the real font metrics rather than guessed from a character count. Grouping runs in order of importance and the rows come out correctly spaced on their own, so no label is nudged off its own price and none is hidden. A row holds at most six labels by default; past that the last one carries a “+N” so the count stays honest. Crowding is measured in pixels, so the column is recomputed as you zoom.

The two panels are drawn as framed plates whose colour is blended with your chart background rather than painted over it, so the candles behind them stay readable. Both can be dragged anywhere and both remember where you put them, per symbol.

The eleven families

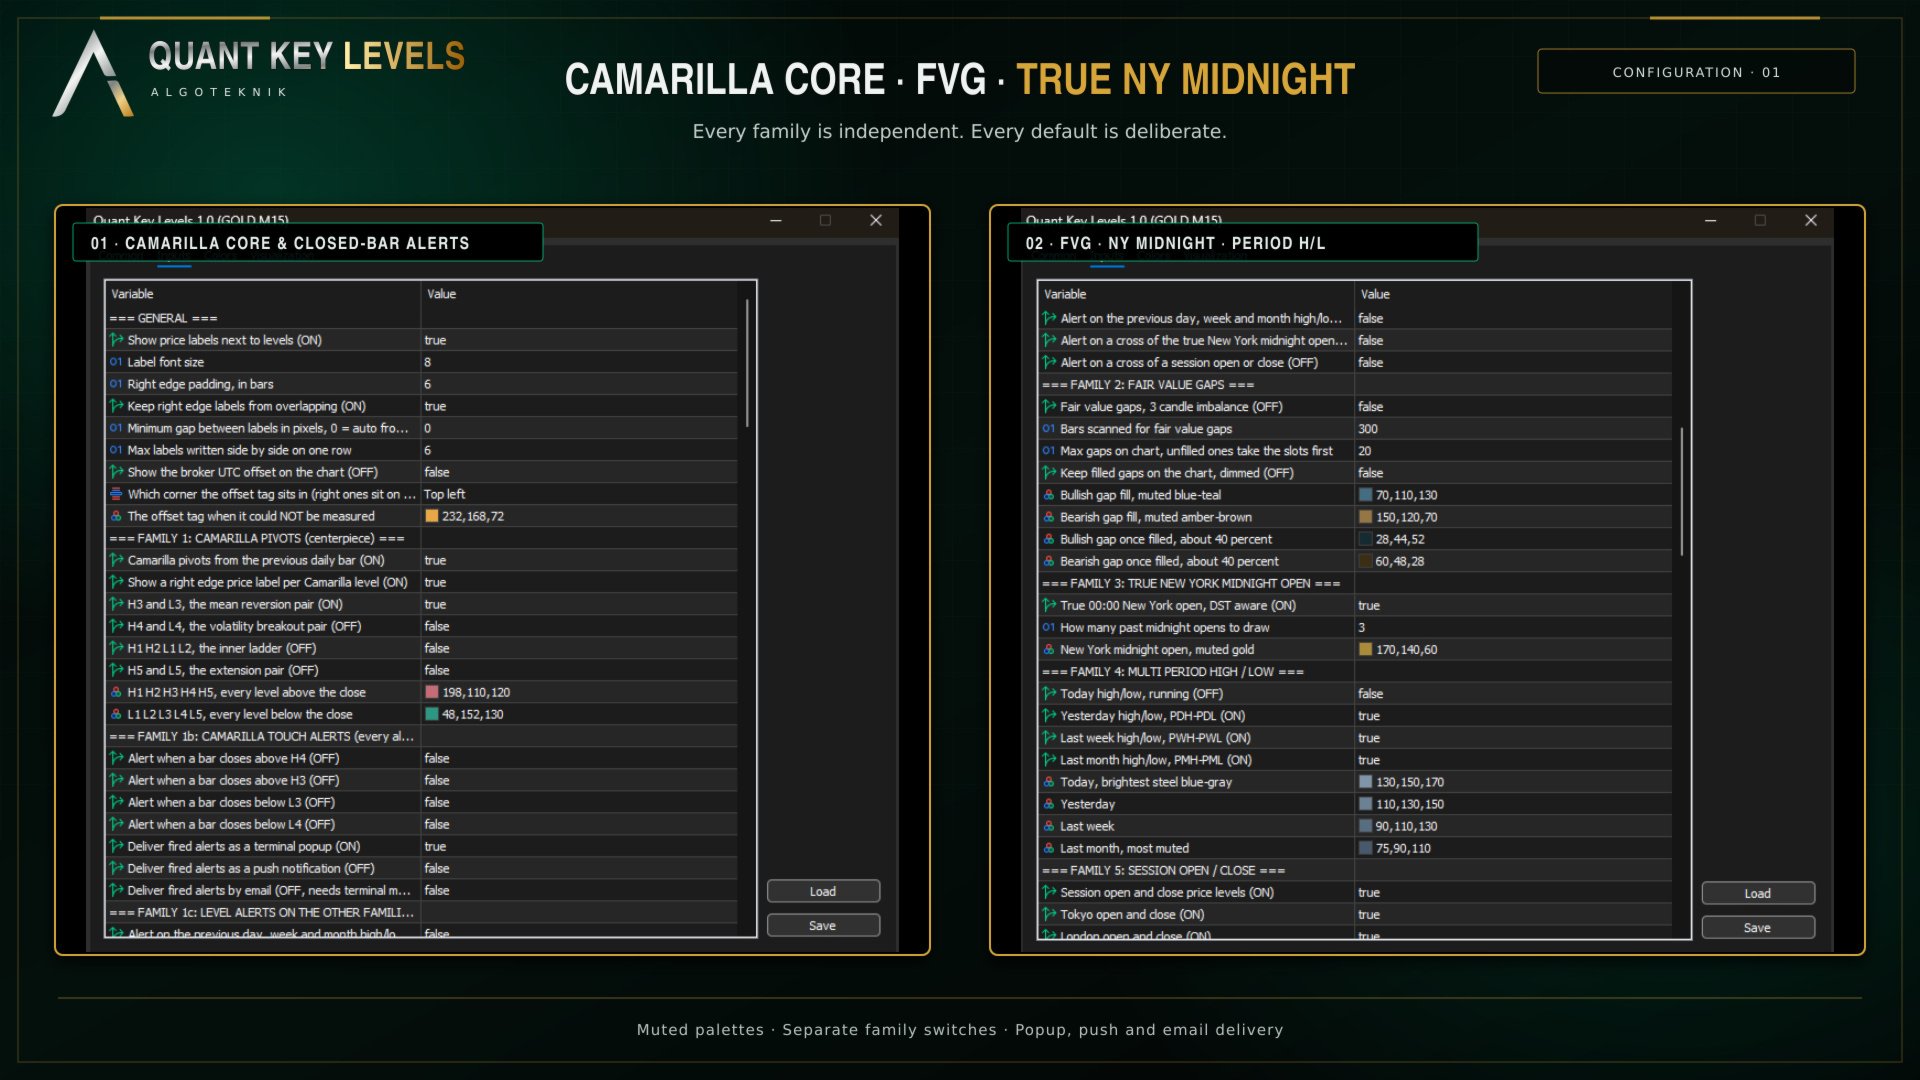
Camarilla pivots. Calculated from the previous completed daily bar, with R as the previous high minus the previous low. H4 and L4 sit at Close plus or minus R times 1.1 divided by 2, H3 and L3 at 1.1 divided by 4, H2 and L2 at 1.1 divided by 6, H1 and L1 at 1.1 divided by 12. H5 is the previous high divided by the previous low, multiplied by Close, and L5 is H5 mirrored around Close. This is the Camarilla Channel that ships with MetaTrader 5, drawn the way it draws it: all ten lines on every bar, solid, with H3 and L3 heavy and the other eight thin. The colours are this product's own, rose above the close and teal below it, measured for contrast rather than picked by eye. Switch all four pairs on, put the stock Camarilla Channel on the same chart, and every value sits exactly on top of its own. That is the only kind of proof worth offering.

What ships on is the mean reversion pair alone, H3 and L3. Ten lines at once is a wall and those are the two a trader actually works from. The other three pairs are one switch each, because a level and its mirror are read together, and turning a pair off removes its line, its right edge label and its touch alert together. The arithmetic is untouched: every level is still computed, so turning a pair back on shows the numbers that were always there.

What this module adds to the stock version is correctness, never a different picture. The stock indicator builds its object prefix from the clock, so it changes on every restart and leftover labels can never be swept away; here the prefix is fixed and a sweep runs before anything is drawn. The stock indicator can stall permanently when the previous daily bar is missing, and not only for that bar but for the whole rest of the chart; here the history is actively requested, the affected bar is left blank and the levels repair themselves when the data arrives. The stock indicator divides by the previous Low without checking it; here H5 and L5 are left out rather than invented when that division is not safe. The stock indicator refuses to start at all above D1; here Camarilla simply stops drawing above D1 while the other families carry on. Several vendors publish different H5 and L5 conventions; the one used here is the MetaQuotes published extension, and it is written on the tooltip of the level itself, so a number that differs from another package is a convention difference rather than an error.

Fair value gaps. The classic three candle imbalance, scanned over the last 300 bars by default and drawn as a shaded block extended to the right for as long as the gap stays open. A gap counts as filled the moment price trades through its far edge, the bottom of a bullish gap or the top of a bearish one, because reaching that edge means the whole imbalance has been traded back through. The box is cut at the candle that fills it and is never drawn past that candle. A filled gap is not deleted: it is dimmed and its right edge is frozen there, so the record of where imbalance was resolved stays on the chart. At most twenty gaps are kept, open ones claim the slots first, and the first thing dropped is always the oldest already resolved gap.

True New York midnight open. The daily open at midnight New York time, which is 05:00 UTC in winter and 04:00 UTC in summer, switching on the real United States daylight saving dates rather than on a broker server offset that someone typed in once. It is placed with the measured clock described above.

Multi period high and low. Four periods, each with its own switch. Yesterday, last week and last month ship on; today running ships off because it is the one level that moves all day. Every value is read from a completed daily, weekly or monthly bar rather than assembled by scanning intraday bars across a boundary, which is what makes weekend and holiday gaps a non issue. On a Monday the previous day is simply the previous daily bar, which is Friday. Style carries recency rather than colour: all four use one steel blue family, and you read the age of a level from how it is drawn.

  • Today, solid and brightest
  • Yesterday, solid and slightly muted
  • Last week, dashed
  • Last month, dotted and most muted

Session open and close. The six exchange levels described above, drawn from the published hours of Tokyo, London and New York on their own daylight saving calendars.

ARC trend pair. ARC stands for Average Range times Constant, from Welles Wilder Jr, 1978. A constant times the Average True Range is measured off price to give a level that trails the market, and the rule is short: if close minus factor times ATR is above the level the level moves up to it, if close plus factor times ATR is below the level it moves down to it, and otherwise the level does not move at all. The level is therefore dragged along only when price gets further than one ARC away from it. Inside that band nothing happens, which is why the line sits on long flat shelves and why price can cross it without moving it a single tick. The ATR used is the plain average of true range, not Wilder smoothing.

Two lines are drawn, used the way an Ichimoku uses its two fast lines but built from Average True Range instead of fixed period highs and lows: the Tenkensen on a nine period ATR with factor one, drawn thin, and the Kijunsen on a twenty six period ATR with factor 2.9, drawn heavy. Both period and factor are inputs. Each line has two colour inputs, one for while it sits below price and one for while it sits above, on separate plots so the handover at a side change is flat rather than a jump. They ship set to the same value per line, white for the Tenkensen and aqua for the Kijunsen, so each line reads as one colour unless you choose to have the side called out. The value drawn on a bar is the level as it stood after the previous bar closed, so nothing on the current bar can change it.

Murrey Math 4/8. Murrey Math takes the range of the last sixty four bars by default, snaps it onto a base eight octave grid and cuts that octave into eight equal eighths. The 4/8 line is the middle one, the main pivot, where price is treated as being in balance. Only the 4/8 is drawn here: the other twelve lines of a full Murrey set would turn the chart into a grid, and the 4/8 is the one that behaves like a key level. The calculation is a line for line port of the Murrey Math indicator that is already in the terminal, quirks included rather than tidied up, so the two agree to the last digit and can be checked against each other on the same chart.

Session VWAP. The volume weighted average price, accumulated from the start of the session: each bar contributes its typical price weighted by that bar's activity, and the line is the running average of the two. By default the session starts at the open of the broker's own daily bar, the same boundary the Camarilla levels use and the same one your daily chart draws, so the two never disagree about where the day began; the alternative anchor is true midnight New York.

Where the feed supplies real traded volume it is used. No retail foreign exchange or CFD feed does, so on those instruments the weight is the tick count, the number of price changes in the bar. That was measured rather than assumed, and so was what it tracks: tick count correlates 0.74 with the bar's range, which means it follows activity and volatility rather than traded size, while its shape through the day does match the real liquidity curve. On foreign exchange this line is honestly a volatility weighted mean price, and knowing that is worth more than a footnote. It is timeframe dependent, and so is every other VWAP: each bar contributes a single typical price, so a coarser chart folds more of the movement inside each bar into one number. Three optional band pairs sit at plus and minus a multiple of the weighted standard deviation of price around the line, using the same weights; all three ship switched off, because six lines that move together crowd out everything else.

Central Pivot Range, described above with its width tag. Multi symbol proximity and the read are the tenth and eleventh, and both are panels rather than lines; both ship on, because a feature nobody finds is a feature nobody bought.

Alerts

Camarilla H3, H4, L3 and L4 raise a close alert; so do the previous day, week and month highs and lows, the true New York midnight open, and the session opens and closes. Every one of them judges the last closed bar and never the forming one, none fires for the history that was already on the chart when the indicator loaded, and each level fires at most once a day. Direction is per family: a previous high is broken upward and a previous low downward, so those fire on a close past the level, while a midnight open or a session open has no side to break and fires on a cross in either direction. Delivery is popup, push notification or email, each on its own switch. Every alert ships off.

The Data Window

Every level that is drawn as a chart object is also published to the Data Window under its own name: previous day, week and month high and low, today's running high and low, the New York midnight open, the pivot range, and the six session levels. Hover a bar and read the exact number instead of taking it off a label that shortens when the right edge is crowded. A level is only reported from the bar that defined it onward, so hovering last month does not report today's previous day high, and a family you switch off leaves the Data Window rather than freezing its last value there.

Colours, settings and the full reference

A small set of muted hue families, each distinguished inside itself by line style and weight rather than by adding more colours. Nothing is neon and nothing is a pure red or green, and the shipped values are chosen to stay readable across a long session on a dark chart. Every colour is an input, so the whole palette can be retuned to your own theme without losing the structure.

Colour, line style and width come from the Inputs tab and are re-applied every time the indicator starts, so edits made in the Colors tab do not stick. That is deliberate. A chart stores the plot settings of every indicator attached to it and pushes them back over what the indicator asks for, so a chart that once held a different version of this tool can force that version's settings onto this one, and when the two disagree about how a line is drawn the line does not appear at all. Rather than let a stale chart setting silently blank out a level, the indicator puts its own definition back.

The complete input reference, including every default, every allowed range and the behaviour that has no switch, is in the Manual.txt file, published on the channel linked at the foot of this page. A Market product carries one file, so the manual is not packed with the EX5.

Questions, bug reports and feature requests are welcome on the TrendTower channel: https://www.mql5.com/en/channels/trendtower

This is an indicator for analysis and decision support. It does not place trades. Always test thoroughly before using any tool in live trading. Trading involves risk.

algoteknik

Support, updates and every other product: mql5.com/en/users/bugraky123
Product channel: mql5.com/en/channels/trendtower

Quant Key Levels version 1.0
推荐产品
Apex Trend Zone — 产品说明 Apex Trend Zone 是一款趋势跟踪信号指标,旨在捕捉市场的主要方向,并帮助您在整个趋势过程中持有仓位。它通过跟踪价格动能,使用简洁的箭头标记和一条自适应跟踪线,在图表上标示潜在的反转点和延续点。 该指标采用动态区域逻辑,能够根据市场波动性自我调整。随着趋势增强,跟踪区域会扩大,旨在减少在强劲行情中过早离场,并使您在趋势结束之前保持方向一致。 优势 它提供清晰、简洁无杂乱的视觉呈现;买入和卖出方向在图表上一目了然。它适用于所有交易品种(外汇、指数、商品、加密货币)以及所有时间周期。得益于这条自适应跟踪线,使您更容易在整个趋势过程中持有仓位,从而减少在震荡行情中不必要的离场。它使用简单,无需叠加大量其他指标,即可独立提供一个方向性框架。当在更高的时间周期(例如 1 小时、4 小时和日线)上使用时,错误信号会显著减少,这使其特别适合波段和持仓型的交易方式。 注意事项 与所有趋势跟踪工具一样,在横盘和无方向(震荡)市场中产生错误信号的可能性会增加。在较低的时间周期上,由于市场噪音,信号频率可能会增加,并可能出现误导性的反转。就其本质而言
Grid MA Robot MT5
Songkiet Manoharn
Grid MA: Institutional Risk Edition by Hello Quant is an advanced, fully-automated mean-reversion grid framework engineered for stringent capital preservation and extreme volatility management. Unlike traditional grid systems that hold stranded losing positions while scraping small individual profits, Grid MA V1.71 utilizes a proprietary Directional Basket Profit Realization engine. It calculates the net equity of your entire directional exposure (including swaps and commissions) and executes a
Supply and Demand Indicator + FREE Currency Strength Meter ADD-ON Looking for a powerful tool that can help you identify the most reactive zones in the forex market? Our supply and demand indicator for MetaTrader 4 and 5 is exactly what you need. With its advanced algorithms and real-time analysis, this indicator helps traders of all experience levels make informed trading decisions. The supply and demand indicator is a cutting-edge tool that helps traders identify areas where buyers and sellers
ASI fractals with DPO filter - is the manual trend-following system. ASI fractals are the base of every trend. System plots an arrow when fractal pattern appears on ASI indcator and DPO direction is same as incomming signal. System has several ways of usage : simply indicator, indicator with suggested arrows, arrows with single targets and arrows with common profit targets. User can simply switch indicator's modes directly from chart. Main Indicator's Features Signals are not repaint,non-late or
This product is designed for the MT5 platform and offers two key features: VWAP (Volume Weighted Average Price) calculation and Volume Profile analysis. Advantages: VWAP Calculation: The product calculates the VWAP, which is a popular indicator used by traders to determine the average price of a security based on its trading volume. It helps identify potential buying or selling opportunities by comparing the current price to the average price weighted by volume. Volume Profile Analysis: The prod
Smart Volatility Squeeze MT5 Smart Volatility Squeeze MT5 is a volatility compression and momentum expansion indicator for MetaTrader 5. It builds on John Carter's Volatility Squeeze framework and extends the usual single-tier squeeze into three compression tiers, so you can see not only whether the market is compressed but how tightly it is compressed before it expands. The indicator opens in a separate window and draws two elements: a linear regression momentum histogram and a row of coloured
SV Symbol health
Minh Truong Pham
Inspired investing.com Technical Indicators, this indicator provides a comprehensive view of the symbol by synthesizing indicators including: RSI, StochRSI : have 3 level oversold - red, midle (aqua when upper, pink when lower), overbuy – blue Stoch: oversold – red, overbuy- blue, aqua when main line < signal line, pink when main line > signal line MACD: aqua when main line < signal line, pink when main line > signal line ADX:   aqua when line plus > line minus, pink when line plus < line minus
Visual Heatmap Book Analyzer
Alexandre Moraes De Souza Lima
Visual Heatmap Book Analyser This indicator monitors the market liquidity and generates colors based on order patterns, quantities, and renewal activities in the book. This allows you to visualize the order flow and identify areas of high and low liquidity and activity. The indicator uses machine learning techniques to analyze the order behavior in the book, enabling it to detect patterns and trends in orders, allowing you to make informed decisions about your trading operations. The color pale
“KS Master Tool 12 in 1 Trade with Me”是一款单文件 MetaTrader 5 (MT5) 自定义指标,它将多种交易工具整合为单一的图表窗口叠加层。 该工具的设计允许通过主开关完全启用或禁用各个模块。当某个模块处于关闭状态时,系统会彻底跳过该模块的计算、绘图、计时器运行及图表事件处理(即禁用的模块不会产生额外的 CPU 占用)。 模块功能 SMC / 斐波那契 / 结构突破 (Structure Break) / FVG / CPR / IB (结合 SMC 的图表形态) 公平价值缺口 (FVG):支持可选标签、缓解 (mitigation) 缩减显示及历史记录限制 结构突破 (BOS / CHoCH):包含历史记录、当前结构高亮显示、实体或影线突破选项 斐波那契水平:5 个可配置水平(支持显示/隐藏) 中心枢轴区间 (CPR):包含 Pivot、BC、TC 及区间填充 (cloud fill) 前一日高点/低点 (PDH/PDL) 初始平衡区间 (IB):高点/低点/中点 + 区间填充(可配置时段窗口) 可选图表形态识别 (Ell
No Chase Entry Filter
Mohamed Amr Mohamed Osama Abdelwahab
No Chase Entry Filter - 不会迟到的入场 许多亏损交易并不是方向判断错误,而是入场太晚。想法本身没有问题,但入场发生在行情已经走完之后,止损被一次普通回撤打掉,而更好的价格本可以扛过这次回撤。 No Chase Entry Filter 依据市场结构标记买入和卖出入场,并剔除价格已经过差的那些。绿点表示从这里买入。红点表示从这里卖出。彩色水平线标记平仓位置。每个圆点背后都有五项独立检测,将入场质量评为 0 到 100 分;当价格已经过度延伸时出现的信号会被抑制,而不是显示出来。 信号如何产生 方向来自市场结构。当某根 K 线收盘价高于最近一个已确认的结构高点时出现买入信号,收盘价低于最近一个已确认的结构低点时出现卖出信号。只有当一个转折点两侧都已收出所需数量的 K 线后,它才会被采用,因此信号所依据的结构在信号出现之前就已固定。 不重绘 这一点比任何其他特性都重要,因此明确说明。 结构转折点需要两侧的 K 线才能成立,所以在那些 K 线收盘之前无法确定。每个信号都只根据当时已经最终确定的转折点判断。正在形成的 K 线永远不会产生圆点:信号出现在产生
Volume Trio Multi is a three-layer market-structure tool for MetaTrader 5: session Volume Profile (POC, VAH/VAL, Value Area), a CVD volume-pressure histogram with a strict Regular divergence engine, and anchored VWAP with standard-deviation bands — extended with a watchlist scanner that runs all three across the symbols in your Market Watch. This is the Pro edition of my free indicator, Volume Trio. The base engine is identical, so this page describes only what Pro adds. For the three layers the
Alexander The Great EA
Syed Jawad Hussain Naqvi
Alexander The Great EA is a premium Expert Advisor developed exclusively for MetaTrader 5. It is designed to automate disciplined trend-following strategies using intelligent market analysis, advanced risk management, and professional trade execution. Unlike traditional Expert Advisors that rely on basic indicator crossovers, Alexander The Great EA combines trend confirmation, execution filters, and structured money management into a reliable automated trading solution. Every component has been
Delta Profile Volume
Teresinha Moraes Correia
指标技术说明 – Delta Profile for MetaTrader 5 Delta Profile 是为 MetaTrader 5 开发的一款指标,用于在指定的 K 线区间内对成交量流进行详细分析。它能够在不同的价格水平上对正向成交量(与上涨相关)和负向成交量(与下跌相关)的不平衡进行结构化和可视化展示。最终,用户可以清晰地识别图表中成交最为集中的区域,以及真实的市场不平衡形成的位置。 以下是该指标的主要技术特征与参数说明。 核心概念 指标会识别 价格水平 ,并将其分类为正向成交量、负向成交量,以及净 Delta(正负成交量的差值)。 每个价格水平会在图表中以 水平条形 显示,帮助用户直观观察市场活跃区和不平衡区域。 用户可自由控制 分析的 K 线数量 、 价格精度(小数位数) 、 显示的最大水平数量 以及 可视化样式 。 主要功能 价格水平映射 :根据设定的精度对价格进行四舍五入,并累计对应 K 线的成交量。 净 Delta 计算 :显示正负成交量的差值,提供每个价格区间的客观数值。 最强 Delta 水平突出显示 :自动识别 Delta 绝对值最大的价格水平,并用特殊颜色标
Volume flow Profile
Israr Hussain Shah
大师版是一款专业级的分析工具,旨在通过成交量和资金流向的视角来可视化市场结构。与标准的成交量指标不同,该工具直接在图表上显示每日成交量分布,让您准确看到价格发现发生的位置以及“聪明钱”的定位。 此大师版专为清晰度和速度而设计,具有独特的自动主题同步系统,加载后即刻美化您的图表布局。 主要特点: 真实资金流向计算: 超越标准的跳动量。启用“Use Money Flow”时,成交量按价格加权,揭示了特定价格水平的实际资金投入。 价值区域 (VA) 可视化: 自动计算价值区域(默认为成交量的70%)。 VA填充: 为价值区域背景着色,以便即时识别控制区域。 关键水平: 清晰标记控制点 (POC)、价值区域高点 (VAH) 和价值区域低点 (VAL)。 专业标记系统: 扫描概况结构以识别关键交易区域: HVN (高成交量节点): 接受和盘整区域(支撑/阻力)。 LVN (低成交量节点): 拒绝区域或“快速通过”区域。 所有标记均向右绘制延长线,便于监控。 Delta 背离(左侧直方图): 左侧直方图可视化每个级别的买卖压力对比。这有助于识别隐藏的背离——即价格可能上涨,但卖家在这些水平上激进打
Reverse Strike
Antonio Gutemberg Frota
Reverse Strike – Professional Gold Reversal Indicator for MetaTrader 5 EXPERT:  Reverse Strike expert Reverse Strike is a professional MetaTrader 5 indicator designed to identify high-probability reversal opportunities on XAUUSD and other trading symbols. Built with ATR trailing stop logic, linear regression analysis, and multi-timeframe confirmation, it helps traders detect potential market turning points with clarity and precision. Instead of simply following the existing trend, Reverse Stri
VPDemandSupply
Xavier Gregory Yvon Remy Boussougant
Cet indicateur combine plusieurs outils d'analyse technique avancée sur un seul graphique. Il est conçu pour identifier les zones clés de prix, les niveaux de liquidité et les retracements potentiels. Double ZigZag Deux ZigZag superposés avec des sensibilités différentes. Le ZZ1 (argent, rapide) détecte la structure de marché à court terme, tandis que le ZZ2 (or, lent) identifie la tendance principale . Ensemble ils permettent de lire le marché sur deux niveaux simultanément. Zones Supply & Dem
Nspikes Sniper R2 Premium Edition for MT5 Nspikes Sniper R2 Premium Edition is a technical indicator designed for Boom 1000/500/900/600 and Crash 1000/500/900/600 indices. It integrates liquidity zone detection, session filters, and a 3-step recovery entry visual layout directly on MetaTrader 5 charts. Key Features: - Automatic Instrument Detection: Identifies whether the current chart is Boom or Crash and applies the corresponding logic. - Timeframe Optimization: Formatted for M1 and M5 time
HTF FVG Scanner – MT5 公允价值缺口指标 将更高时间框架的 Fair Value Gap(H1、H4、D1、周线)直接绘制在您的 M5 或 M15 图表上。无需切换窗口,无需手动标记。 大多数 FVG 指标只扫描当前时间框架。本指标的工作方式不同——它从您选择的更高时间框架读取缺口,并实时绘制到当前图表上。H4 缺口显示在 M15 图表上,D1 缺口显示在 H1 图表上,周线缺口显示在 H4 图表上。 区域随图表滚动、缩放和切换品种而保持对齐,仅在更高时间框架 K 线收盘时更新。 每个区域显示内容: 看涨 FVG (BISI) 和看跌 FVG (SIBI) — 颜色区分 CE 线 — 50% 侵蚀水平线(可切换) 信息标签 — 时间框架、缺口大小(点数)、CE 价格 缺口状态 — 活动区域填充显示,已修复区域淡出或隐藏 汇聚标记 (*) — 与其他活动缺口重叠的区域 反转 FVG (IFVG) — 价格回收已修复缺口时自动检测 最近区域高亮 — 自动强调最近的看涨和看跌区域 交互式控制面板:   直接在图表上的画布面板,包含 FVG 时间框架选择、图表切换、设置与
IntensywnyScalperPro
Bartlomiej Mateusz Konecki
INTENSYWNY SCALPER PRO — 单个指标中的完整超短线系统 1. Adaptive ATR-Based Targets — Works on Any Market & Timeframe 1. 基于 ATR 的自适应目标 — 适用于任何市场和时间周期 Take-profit spacing and stop-loss distance are calculated from real market volatility (ATR). Switch between M1, M15 or M30+, or jump from Gold to Bitcoin to indices — the indicator instantly recalculates all levels. No manual configuration, ever. 止盈间距和止损距离根据实际市场波动率 (ATR) 计算。无论是从 M1、M15 还是 M30+ 之间切换,或者从黄金、比特币跳转到股指 — 指标都会立即重新计算所有级别。无需任何手动配置。 2. Six-Level Profit Str
Floating DD Tracker — Free Risk Monitoring Indicator for MT5 Floating DD Tracker is a lightweight and professional MetaTrader 5 indicator designed to help traders monitor real-time floating drawdown directly on the chart. The indicator continuously tracks your current floating drawdown, records the highest drawdown reached, and displays the historical maximum DD with the exact date and time it occurred. Its compact neon-style dashboard is optimized for all chart sizes and provides instant visual
FREE
Optimized Trend Tracker OTT is an indicator that provides traders to find an existing trend or in another words to ser which side of the current trend we are on. We are under the effect of the uptrend in cases where the prices are above OTT , under the influence of a downward trend, when prices are below OTT it is possible to say that we are. The first parameter in the OTT indicator set by the two parameters is the period/length. OTT will be much sensitive to trend movements if it is sma
Liquidity HeatMap Profile
Israr Hussain Shah
5 (1)
Here   our more valuable tools SMC Trend Trading   ,  Easy SMC Trading  ,  Institutional SMC Architect Volume Analysis Tools  ,  Volume flow Profile  ,  Market volume profile  , FVG with Volume  , Liquidity Heatmap Profile  ,  Volume Spread Analysis 2. Key Features Dynamic Filtering : The core feature. As soon as the current price crosses a historical liquidity level, that level disappears. This reduces chart clutter and prevents you from trading off "dead" support/resistance. Liquidity Heatma
Apex Heikin Ashi Pro V1.0 ,由 Brijesh Jaiswal 先生开发,是一款专为 MT5 设计的高级 Heikin Ashi 趋势指标。它集成了无重绘(Non-repaint)买卖箭头、SuperTrend 确认、皇家蜡烛配色、深色图表风格、警报通知以及简洁的专业仪表盘,旨在为交易者提供快速的趋势解读。 Apex Heikin Ashi Pro 专为追求简洁图表的交易者设计,能够直接在 MetaTrader 5 图表上更清晰地识别趋势方向、趋势转变以及强力的买卖机会。该指标不再让混乱的信号填满屏幕,而是专注于通过 Heikin Ashi 趋势结构和基于 SuperTrend 的趋势确认,提供经过过滤的高质量视觉确认。 该指标采用同趋势蜡烛着色技术,使图表在视觉上保持平静且易于阅读。当趋势发生变化时,特定的反转蜡烛会以特殊的粉红色突出显示,帮助交易者即刻识别市场方向的转变。强力买入和强力卖出机会由清晰的箭头标记,其逻辑设计旨在通过仅在蜡烛关闭后确认信号来避免重绘。 专业仪表盘位于左上角,以精美的视觉风格显示品种、时间框架、信号状态、强度、价格以及成交量/点
Eng Gold
Ely Alkrar Xshkaky
ENG-GOLD Scalper It is an auxiliary indicator that identifies potential targets and determines the place of entry with a stop loss that works on Heiken Ashi candles  The green lines are usually the targets, the red lines are the stop loss, and the yellow lines are the entry location.  This file is recognized on small and medium frames, usually less than the watch frame I highly recommend using XAUUSD Nasdaq100 Dow30 USOIL 
Sinal IFR
Aurenice Barros De Abreu Carvalho
Sinal com base no indicador RSI, que indica compra marcando com uma seta verde quando o preco sai da região de sobrevendido, e sinaliza venda quando o preco sai da regiao de sobrecomprado. A sinalizacão é  feita com uma seta verde para compra e seta rosa para venda. Permite configurar o nível de sobrecompra e de sobrevenda, além do período do RSI. Funciona em qualquer período gráfico.
Adjustable Consecutive Fractals  looks for 2 or more fractals in one direction and sends out a on screen alert, sound alert and push notification, for strong reversal points . Adjustable Consecutive Fractals, shows the fractals on chart along with a color changing text for buy and sell signals when one or more fractals appear on one side of price. Adjustable Consecutive Fractals is based Bill Williams Fractals . The standard Bill Williams fractals are set at a non adjustable 5 bars, BUT withe th
Tom FX
Bazeermohamad Khanmohamed
TOMMY SCALPER EA — Powered by TOMFX Short Description (MQL5 Market) TOMMY SCALPER EA is a professional XAUUSD (Gold) scalping Expert Advisor for MetaTrader 5, developed to capture fast market movements with disciplined risk management and automated trade execution. Built for traders who prefer simple operation with powerful internal logic, the EA focuses on consistency, precision, and efficient profit management. Simply set your preferred Lot Size and Daily Profit Target, then let the EA manage
Farman Trend Multi Timeframe
Aiireza Arjmandi Nezhad
大多数交易者只追随价格…… 而 FARMAN MULTI-TF 追踪的是价格背后的结构。 这不仅仅是一个趋势指标。 它是一个基于分形理论的多时间框架市场结构引擎。 真正的事实是: 分形从不说谎。 因为市场本身就是分形结构。 价格会变化。 噪音会变化。 但结构始终重复。 FARMAN TREND V12.9 正是在追踪这种结构。 多时间框架分形趋势线 动态 / 静态模式 自适应 Alpha 算法 成交量响应分析 超高速反应 BUY ZONE → 聪明资金正在进入 SELL ZONE → 流动性正在离场 FARMAN 不预测市场…… 它揭示市场的真实结构。 一旦你理解分形结构,你将永远不会再追着市场跑 而 FARMAN MULTI-TF 追踪的是价格背后的结构。 而 FARMAN MULTI-TF 追踪的是价格背后的结构。
Gold GridScalper by fxstarpro Advanced Automated Gold Trading EA for MetaTrader 5 Gold GridScalper SD is an advanced automated trading system developed specifically for Gold (XAUUSD) . It combines Supply & Demand analysis, market structure, trend confirmation, volatility filters, and intelligent basket/grid management into one fully automated Expert Advisor. The EA is designed for traders who want a systematic approach to Gold trading without manually monitoring every market movement. Note :
Manyal trading system, CovEchoTrend Robot, focuses on reliability and flexibility. By employing statistical analysis methods to study the relationships between the base indicator and market patterns, the system enables a deeper understanding of market processes. Intelligent pattern analysis: The application of statistical data processing helps identify key trend reversal points more accurately, signaling significant market shifts. Informed decision-making is based on the intersection of indicato
该产品的买家也购买
Trend Sniper X
Sarvarbek Abduvoxobov
4.85 (26)
Trend Sniper X 是一款适用于 MetaTrader 5 的多周期趋势跟踪指标,可帮助交易者清晰精准地识别趋势方向和潜在的反转点。 适用于 MT4: https://www.mql5.com/en/market/product/193245 价格信息: 当前价格为促销价,随着后续更新和新功能的推出,价格可能会有所变动。 赠品优惠: 购买后联系作者,即可免费获取该指标的 Auto-Trade Assistant EA(自动交易助手 EA)。 Code2Profit 频道 通过多时间框架分析掌控市场! 如何使用 Trend Sniper X 最大化您的胜率:核心规则与交易时段技巧 技术规格 平台 MetaTrader 5 指标类型 多时间周期趋势指标 运行时间周期 任何图表时间周期,可独立选择更高的时间周期 (M1–MN1) 主要交易品种 外汇、黄金 (XAUUSD) 及其他差价合约 (CFD) 推荐账户 任何账户类型 可视化 彩色趋势蜡烛 (买入/卖出/微弱/变化) + 买入/卖出箭头 附加模块 交易时段方框 (悉尼、东京、伦敦、纽约) 主要功能 多时间周期趋势分析: 直接在
Neuro Poseidon MT5
Daria Rezueva
4.8 (54)
Neuro Poseidon is a new indicator by Daria Rezueva. It combines precise trading signals with adaptive TP/SL levels - creating best possible trades as a result! Message me and get  Neuro Poseidon Assistant  as a gift to automize your trading process! What makes it stand out? 1. Proven profitability on all assets and timeframes 2. Only confirmed BUY and SELL signals present on the chart 3. Adaptive TP & SL levels generated by the software for each trade 4. Easy to understand - suitable for al
Unix Scalper
Issam Kassas
UNIX Scalper — Gold Scalping Indicator for MetaTrader 5 UNIX Scalper is a focused Gold scalping indicator designed primarily for XAUUSD on M1, M2, M3, M5, M10 and M15. It gives the trader a clear BUY, SELL or WAIT decision together with the complete trade plan: Entry, Stop Loss, TP1 and TP2 . PRICE UPDATE NOTICE: Currently available for $199. The price will   increase to $399   after the next   30 purchases . The concept is simple: wait for the signal, follow the levels, move the Stop Loss to
M1 Sniper MT5
Oleg Rodin
5 (7)
M1 SNIPER   是一款易于使用的交易指标系统。它是一个专为 M1 时间框架设计的箭头指标。该指标可以作为独立的系统在 M1 时间框架下进行剥头皮交易,也可以作为您现有交易系统的一部分使用。虽然该交易系统专为 M1 时间框架交易而设计,但它也可以用于其他时间框架。我最初设计此方法是为了交易 XAUUSD 和 BTCUSD。但我发现这种方法在其他市场交易中也同样有用。 指标信号既可以顺势交易,也可以逆势交易。我教授一种特殊的交易技巧,帮助您利用指标信号进行双向交易。该方法基于使用特殊的动态支撑位和阻力位区域。 购买后,您可以立即下载 M1 SNIPER 箭头指标。此外,我还为所有 M1 SNIPER 工具用户免费提供下方屏幕截图所示的 Apollo Dynamic SR 指标!这两个指标的组合可以帮助您更轻松、更准确地利用 M1 时间框架进行交易。 购买后请联系我,免费获取交易提示和奖励指标! 祝您交易成功!
Superhero
Ihor Otkydach
5 (3)
SUPERHERO 指標是一款基於「全方位」原則設計的多貨幣交易系統。該指標能獨立分析市場,並提供開倉與平倉的交易訊號。它採用止損與獲利了結訂單,風險報酬比(R:R)為 1:1。 我偶爾會根據這個系統的訊號親自進行交易,以下是我獲得的結果—— 即時訊號 此系統可向您的智慧型手機發送推播通知,讓您無需綁定電腦,即可「隨時隨地」進行交易。這對於自營交易公司而言再適合不過了。 每位顧客皆可享額外好禮: 每位購買此指標的買家,都將收到我贈送的一項特別實用工具,該工具: 自動下達止損與獲利了結訂單 當價格達到目標水準時,系統會自動平倉 支援待執行訂單交易 支援均值交易模式 如果您希望將這款優秀且極為便利的工具作為禮物獲贈,請在購買 SUPERHERO 指標後,立即透過 MQL5 平台的私訊與我聯繫。此外,您還將獲得培訓課程「如何安裝與設定 SUPERHERO 並開始穩定獲利」的存取權限。 關於「超級英雄」策略 SUPERHERO 策略是利用價格回調時,順應趨勢方向進行盤中交易。 「超級英雄」程式碼內含數個強大的技術指標,用以分析價格通道的趨勢方向與波動範圍,並能識別在修正性回調後形成的盤中波段反
Divergence Bomber
Ihor Otkydach
4.89 (94)
我偶爾會親自使用這個系統進行交易。 請評估我在真實帳戶上進行的手動 BOMBER 交易—— LIVE SIGNAL 购买该指标的每位用户将额外免费获得以下内容: 原创工具“Bomber Utility”,该工具会自动跟踪每一笔交易,设置止损和止盈点,并根据策略规则自动平仓; 适用于不同交易品种的指标设置文件(Set 文件); 三种不同风险模式下的 Bomber Utility 设置文件:“最低风险”、“平衡风险” 和 “观望策略”; 一套详细的 视频操作手册,帮助您快速完成安装、配置并开始使用本交易系统。 注意: 要获取以上所有赠品,请通过 MQL5 的私人消息系统联系卖家。 我为您介绍原创的自定义指标 “Divergence Bomber”(背离轰炸机),它是一套基于 MACD 背离交易策略 的“全功能”交易系统。 该技术指标的主要任务是识别 价格与 MACD 指标之间的背离,并发出交易信号(包括推送通知),指示未来价格可能的运动方向。平均而言,这些信号的准确率超过 98%。有关该指标如何工作的详细说明,请观看本页面上的视频演示。 该系统使用 止损订单 和 动态回撤平仓机制 来管理
Entry Points Pro for MT5
Yury Orlov
4.51 (150)
传奇回归:Entry Points Pro 10。 这款传奇指标曾 3 年稳居 MQL5 Market 前三,如今全面重启。 数百条热情好评(两个版本合计 589 条),每天有数千名交易者用它交易,演示版下载 31,000+   MT4+MT5  次。 五年来我读过你们的每一条评价——在第 10 版里,我没有给出许诺,而是把答案直接做进了产品。指标作者自 1999 年入市, 珍视诚信、自己的声誉和自己的客户 。 Entry Points Pro 给出的入场信号严格不重绘。 而且这一次不再只是作者的一面之词,而是可验证的事实:确认信号只在 K 线收盘后标出,自动化测试记录到 零重绘 (在 EURUSD、XAUUSD 和 BTCUSD 上共 2,486,568 次不变量检查——0 次违规)。测试方法完全公开——您可以在策略测试器中自行复现。 购买后请务必第一时间给我发私信。 我会发给您 扩展版说明书《交易者圣经》 ——使用本指标交易的完整指南——并告诉您如何免费获得 赠品:市场扫描器 ,它能同时分析多个品种和多个时间周期,并在一个界面上显示 Entry Points Pro 此刻在哪里表现
UZFX {SSS} 超短线智能信号 v5.0 MT5 是一款无重绘的高性能交易指标,专为在快速波动的市场中需要精准、实时信号的超短线交易者、日内交易者和波段交易者设计。该指标由 (UZFX-LABS) 开发,融合了价格行为分析、趋势确认和智能过滤技术,可在所有货币对和时间周期内生成高概率的买卖信号、预警信号以及趋势延续机会。 别再对交易犹豫不决了,开始遵循这一专为追求清晰、精准和纪律性市场执行的交易者设计的结构化信号系统吧。 相信我,这是 MQL5 上最优秀的指标之一,所以千万不要错过!!“为睿智交易者打造的智能信号” 最新 5.0 版本现已发布,价格可能会在未事先通知的情况下上涨至 499.99 美元,所以请尽快入手,以免错失良机!! 最终购买前!如果您想获取免费试用版,请通过 WhatsApp 号码 +923030751987 联系我!! 如果您遇到任何问题“或”有任何不明白的地方,请在私聊中向我咨询!!! 主要功能更新 • 自动买入和卖出信号检测 • 先进的反转识别逻辑 • 潜在市场反转前的预警信号 • 趋势延续确认信号 • 内置风险管理功能,包含入场点、止损点、TP1、
Azimuth Pro
Ottaviano De Cicco
5 (7)
Azimuth Pro V2:MT5合成分形结构分析与确认入场 概述 Azimuth Pro 是 Merkava Labs 推出的多层级波段结构指标。四层嵌套波段层级、锚定波段的VWAP、ABC形态识别、三时间框架结构过滤以及收盘确认入场——一个图表,一个从微观波段到宏观周期的完整工作流程。 这不是盲目的信号产品。它是一个以结构为先的工作流程,专为重视位置、背景和时机的交易者打造。 ️ 夏季促销 — 庆祝夏至与 The Oracle Pro 上市:Azimuth Pro 七折优惠,现价 279 美元(原价 399 美元)。限时夏季优惠。 1. V2的变化 合成多时间框架引擎 高时间框架分析从零开始重建,采用与Meridian Pro相同的专有合成架构。更清晰的HTF背景、稳定的实时行为、无经典MTF同步问题。合成引擎还解锁了 固定比率时间框架级联 (x2、x3、x4、x6)——不再在经纪商的固定时间框架之间任意跳转,您可以按图表时间框架的固定倍数分析结构,在每个尺度上保持相同的分形关系。 确认入场箭头 作为稳定且可恢复的执行层而设计的收盘确认箭头。当ABC设置形成且自适应确认逻辑
货币强度向导是一个非常强大的指标,为您提供成功交易的一体化解决方案。该指标使用多个时间范围内所有货币的数据来计算这个或那个外汇对的力量。此数据以易于使用的货币指数和货币电力线的形式表示,您可以使用它们来查看这种或那种货币的力量。 您所需要的只是将指标附加到您要交易的图表上,该指标将向您显示您交易的货币的真实强度。该指标还向您显示买卖量压力的极值,您可以在顺势交易时利用这些压力。该指标还显示了基于斐波那契的可能目标。该指标可用于各种交易时间范围。该指标支持各种货币对的交易。   该指标为您提供所有类型的警报,包括推送通知。 购买后请联系我。我将与您分享我的交易技巧,并免费为您提供丰厚的红利指标! 祝您交易愉快,获利丰厚!
TrendMaestro5
Stefano Frisetti
note: this indicator is for METATRADER4, if you want the version for METATRADER5 this is the link:  https://www.mql5.com/it/market/product/108106 TRENDMAESTRO ver 2.5 TRENDMAESTRO recognizes a new TREND from the start, he never makes mistakes. The certainty of identifying a new TREND is priceless. DESCRIPTION TRENDMAESTRO identifies a new TREND in the bud, this indicator examines the volatility, volumes and momentum to identify the moment in which there is an explosion of one or more of these da
SR Liquidity MT5
Oleg Rodin
5 (2)
SR Liquidity   是一款旨在揭示市场流动性高度集中且价格反应最剧烈的隐蔽区域的交易指标。这些特殊的流动性区域充当着强有力的支撑位与阻力位,为您清晰呈现市场最可能发生反转的位置。 SR Liquidity 指标并非简单地绘制常规的支撑/阻力线,而是通过分析实际的价格行为,识别买卖压力积聚的区域。这些区域实际上是推动市场真实波动的流动性池。通过在图表上直观呈现这些区域,该指标能助您在价格反应发生前预判走势——这意味着它实际上能够预测价格方向可能发生的变化。它将原始的价格行为转化为清晰且具实操价值的市场蓝图,标示出那些可能成为市场转折点的关键价位。 该指标适用于任何交易品种和时间周期——包括外汇、指数、金属、加密货币等。支持任意时间周期。 购买后请联系我,以获取交易指南及免费赠送的优质附加指标!
Smart Market Structure Toolkit
Garry James Goodchild
5 (1)
Smart Market Structure Pro by G-Labs — ICT and Smart Money Concepts toolkit with built-in multi-symbol scanner for MetaTrader 5. Break of structure, change of character, order blocks, fair value gaps, liquidity sweeps, premium and discount zones, ICT sessions, confluence scoring, AI trade ideas, and a traffic-light scanner across up to 30 pairs and four timeframes from one chart. Map SMC and ICT on the active chart while the built-in scanner monitors your full watchlist. Each cell shows BUY, S
Advanced Supply Demand MT5
Bernhard Schweigert
4.53 (15)
任何新手或专业交易者的最佳解决方案! 该指标是一款独特、高质量、且价格合理的交易工具,因为我们已经整合了许多专有功能和新公式。 依据此更新,您将能够显示双重时间帧区域。 您不仅可以显示一个较高的时间帧,还可以同时显示图表时间帧,加上更高的时间帧:显示嵌套时区。 供需双方所有交易者都会喜欢它。 :) 重要信息披露 高级供需的最大潜力,请访问 https://www.mql5.com/zh/blogs/post/720245   想象您的交易如何得以改善,是因为您能够精准定位入场或目标位吗? 构建于新的底层算法,它可以更轻松地识别出买卖双方之间的潜在失衡。 这是因为它以图形方式展示供需最强劲区域,及其过去的表现(显示旧区域)。 这些功能旨在帮助您更轻松地发现最佳入场区域和价位。 现在您可以针对您的交易品种和时间帧来优化和编辑区域强度! 高级供需指标适用于所有产品和时间帧。 它是一个新的公式,非常新的功能是两个区域强度函数可由用户输入进行调整! 这在交易中是一大优势。 当您学习如何使用专有功能,例如带有价格游离最小 X 因子的区域强度时,您能够判断该区域强劲与否。 供需区域用作警报触发器。
M1 Quantum MT5
Hamed Dehgani
4.27 (11)
使用 M1 Quantum 的实盘交易信号 : 信号 (交易由 Quantum Trade Assistant 自动 执行,并作为本产品 免费 提供。) 最新消息: 版本 1.64 已发布。现在所有交易的止损都会设置在相应的支撑位/阻力位之后。Smart Close 功能也进行了改进,以提升此版本 EA 的性能。 自 8 月 9 日起,实盘信号一直运行在版本 1.64 上。 价格计划: 当前价格: $169 (早期用户优惠) 下一阶段计划价格: $189 计划零售价: $299 开发者提示: 购买后请联系我,以获取 最新推荐的参数设置文件(Set File) 、交易建议,以及加入 VIP 支持群组 ,与其他 M1 Quantum 用户交流经验。 常见问题 - 设置文件 - 安装指南 M1 Quantum 是一款专业的 M1 交易系统,提供快速且精准的交易信号,并内置止损(Stop Loss)、止盈(Take Profit)以及智能资金管理功能。 M1 Quantum 包含专业的资金管理系统,通过专注于 连续盈利交易 ,帮助交易者更快地增长账户资金。 M1 Quantum 指标 的主
Grabber System MT5
Ihor Otkydach
4.83 (24)
向您介绍一款优秀的技术指标——Grabber,它是一套即开即用的“全包式”交易策略。 在一个代码中集成了强大的市场技术分析工具、交易信号(箭头)、提醒功能和推送通知。 每位购买该指标的用户还可免费获得以下内容: Grabber辅助工具:用于自动管理已开仓位 视频操作指南:逐步教学如何安装、设置和使用该指标进行交易 原创Set文件:可快速自动配置,帮助实现最佳交易效果 忘掉其他策略吧!只有Grabber能够真正激励你在交易中攀登新高峰! Grabber策略的主要特点: 交易周期:从M5到H4 适用资产:任意,但我推荐我亲自测试过的品种(GBPUSD、GBPCAD、GBPCHF、AUDCAD、AUDUSD、AUDSGD、AUDCHF、NZDUSD、NZDCAD、EURCAD、EURUSD、EURAUD、EURGBP、EURCHF、USDCAD、USDSGD) 交易时间:全天候 24/7 交易效果:我分享自己的真实交易结果,并在此教学如何操作: https://www.mql5.com/ru/market/product/134563?source=Site+Market+MT5+Indic
TPA True Price Action indicator reveals the true price action of the market makers through 100% non-repainting signals strictly at the close of a candle! TPA shows entries and re-entries, every time the bulls are definitely stronger than the bears and vice versa. Not to confuse with red/green candles. The shift of power gets confirmed at the earliest stage and is ONE exit strategy of several. There are available now two free parts of the TPA User Guide for our customers. The first "The Basics"
Boom & Crash & PainX & GainX Ultimate Spike Detector Trade Spikes With Confidence — Not Guesswork Catching spikes should be one of the most profitable strategies in synthetic markets. But for most traders, it becomes one of the most frustrating. You enter too early… price goes against you. You wait for a spike… it never comes. You finally catch one… but don’t know whether to hold or close. You make profit… then give it all back because there’s no exit plan. This is exactly the problem the Ultim
该指标具有独有的支撑阻力计算方案  , 是独一无二的交易系统    。 指标特性 想象一下,如果您能提前精确的判断出重要的交易支撑阻力区域以及点位,您的交易将如何改善   ?  基于独特的计算方式,指标通过对趋势进行分析,通过对当前的支撑阻力进行分析后,得出现在重要的支撑阻力以及做单方向,计算得到的止盈和止损建议,以及关键的进场点位建议. 在交易策略中,进场点位和趋势方向同样非常关键,前者点位不同所面临的风险是不同的,止损的点数也是成倍放大. 本指标分析了当趋势进行后,暂时进入调整时间,分析了此时的重要进场支撑阻力并计算风险控制一定的止损,和止盈,合理的盈亏比. 本指标支持周期设置,可以设置其他周期.  大周期重要支撑阻力,以及小周期辅助判断可以在同一图表中完成. 基本显示 显示历史支撑阻力的价格标签。 显示历史进场位置大概建议范围,以及止盈和止损建议,目标预测. 显示当前方向的判断,以及进场点位,以及止盈止损建议 . 基本设置 设置计算的周期。 警报设置 接近报警 碰触报警 报警弹窗 报警邮件发送 发送推送警报 颜色设定 可以设置不用的实时支撑阻力颜色 可以设置不用的历史支撑阻
Weltrade Spike Sentinel
Batsirayi L Marango
5 (1)
Introducing Indicator for PainX and GainX Indices Traders on Weltrade Get ready to experience the power of trading with our indicator, specifically designed for Weltrade   broker's PainX and GainX Indices.  Advanced Strategies for Unbeatable Insights Our indicator employs sophisticated strategies to analyze market trends, pinpointing optimal entry and exit points.  Optimized for Maximum Performance To ensure optimal results, our indicator is carefully calibrated for 5-minute timeframe charts on
SyntheticaFX Scalper Pro Indicator
Hendrik Lodewyk Coetsee
5 (1)
SyntheticaFX Scalper Pro 指标 SyntheticaFX Scalper Pro 指标是一款多功能且用户友好的工具,旨在帮助交易者在多种时间框架和所有货币对中识别高精度的入场点。该指标在图表上提供清晰的视觉信号,并附带推荐的止损(SL)和止盈(TP)水平,使交易者能够更自信地规划交易。其内置仪表板提供实时交易统计数据,帮助交易者监控表现并做出明智决策。 主要功能 多时间框架兼容性 :无缝适用于多种时间框架,包括 M5 and M15,为不同交易风格提供灵活性。 通用应用 :适用于所有货币对,确保交易者可在广泛市场中使用。 高精度信号 :提供可靠的入场信号,注重精度,帮助交易者捕捉潜在市场机会。 推荐的止损和止盈水平 :每个信号都附带根据市场波动性计算的止损和止盈水平,简化交易管理。 视觉提示 :在图表上直接显示清晰的买入和卖出信号,以及止损和止盈线,便于解读。 性能仪表板 :内置仪表板跟踪交易统计数据,如最近指定交易的胜率、亏损次数和胜率百分比。 可定制设置 :提供多种可调整输入选项,允许交易者根据个人偏好定制指标。 用户友好设计 :以简洁为设计理念,适合初
Gartley Hunter Multi
Siarhei Vashchylka
5 (12)
Gartley Hunter Multi - An indicator for searching for harmonic patterns simultaneously on dozens of trading instruments and on all possible timeframes. Manual (Be sure to read before purchasing) | Version for MT4 Advantages 1. Patterns: Gartley, Butterfly, Shark, Crab. Bat, Alternate Bat, Deep Crab, Cypher 2. Simultaneous search for patterns on dozens of trading instruments and on all possible timeframes 3. Search for patterns of all possible sizes. From the smallest to the largest 4. All fou
SkyHammer Signal Pro
Shengzu Zhong
5 (4)
SkyHammer Signal Pro Professional No-Repaint Trend Signal Indicator with Locked Entry, SL and TP Levels SkyHammer Signal Pro is a structured trend and momentum signal indicator designed for traders who want clear, fixed, and verifiable trading signals. It works best on lower timeframes such as M1 and M5 . The indicator does not try to predict tops or bottoms. Instead, it waits for confirmed market structure, trend direction, momentum strength, volatility quality, and target space before generati
The Oracle Pro
Ottaviano De Cicco
5 (1)
The Oracle Pro:用于 MT5 的合成多周期偏向引擎 ️ 夏季上市优惠 — 早期买家可以 199 USD 获得 The Oracle Pro。价格将随关注度上升;最终价格 399 USD。 The Oracle Pro 是一款面向高要求与专业交易者的 MetaTrader 5 高级多周期 偏向引擎 。它以纪律回答一个问题:当前每个周期的方向偏向是什么、强度如何、各周期之间的一致程度如何?一切仅在已收盘的 K 线上计算——绝不重绘。 The Oracle Pro 是一套多因子共识系统。它将专有指标与优化算法整合为单一而精密的共识向量,并在单个指标实例内,跨当前周期与更高周期的堆栈进行读取——而不是在多个图表上堆叠互不相关的工具。 它是 Oracle 共识方法的专业进化版:完整重建为高级操作控制台,面向希望在一个纪律化工作流中获得深度、多周期背景与背离洞察的交易者。 是偏向引擎,而非信号生成器 The Oracle Pro 明确自身定位。它是一款提供纪律化方向背景的 多周期多因子偏向指标 。它 不是 信号生成器:不承诺入场、出场或盈利。偏向是背景——你在其方向上交易自己的设置
Gem SIGNAL
Shengzu Zhong
5 (1)
GEM Signal Pro GEM Signal Pro 是一款適用於 MetaTrader 5 的趨勢跟隨指標,專為希望在圖表上獲得更清晰訊號、更有結構的交易設定,以及更實用風險管理的交易者而設計。 它不僅僅顯示一個簡單的箭頭,GEM Signal Pro 還能以更清晰、更易讀的方式呈現完整的交易思路。當條件確認完成後,指標可在圖表上顯示進場價、止損價與止盈目標,幫助交易者更有效率地評估交易設定。 運作方式 該指標首先根據其內部邏輯識別有效的初始訊號。 當確認條件滿足後,GEM Signal Pro 會在圖表上顯示完整的交易設定。這讓交易者可以更清楚地看到交易結構,並減少手動分析與計算的工作量。 圖表上的交易價位 對於已確認的訊號,GEM Signal Pro 可顯示: 進場價 止損價 止盈 1 止盈 2 止盈 3 風險報酬比 這讓交易設定更容易理解,也有助於讓圖表分析更有條理。 內建風險管理 風險管理是此指標設計的重要部分。 止損位基於近期市場結構,結合附近的擺動高低點與可選的 ATR 緩衝距離。這能讓交易價位更貼近當前市場條件,而不只是依賴固定距離。 圖表資訊面板 GEM Si
KURAMA GOLD SIGNAL PRO(MT5)— 7层过滤 · 自动止盈止损 · 质量评分 · 信号历史保存 | 完整的XAUUSD交易系统 实时不重绘。信号出现的瞬间,箭头、入场、止盈、止损当场锁定,之后绝不移动。你交易的就是这个实时信号。而且在v7.20中,每一个真正发出的信号都会自动保存,并在重启后精确还原。 购买者专属赠品 购买永久授权,即可免费获得 AI Zone Radar(价值$59)+ 完整PDF手册。在产品价格之外,额外附赠价值$59的赠品。购买后在MQL5上给我留言即可。 AI Zone Radar: https://www.mql5.com/en/market/product/175834 在黄金交易者社区中被实际使用,因精度与易用性而广受好评。 你的难题 —— 以及解决方案 黄金一天波动$30–$50。你知道机会就在那里。但这些情况是否似曾相识: - 入场太早,价格逆行$10后才朝你的方向
The Ultimate Ichimoku MTF Dashboard: Your All-In-One Trading Edge Transform Your Trading with One Powerful Indicator Imagine having a professional trading assistant that monitors multiple timeframes simultaneously, identifies high-probability entries, warns you of potential reversals, and provides clear risk management guidance-all in one clean, intuitive display. That's exactly what the Ichimoku MTF Dashboard delivers.     Why This Isn't Just Another In
Stargogs Spike Catcher
Lorenzo Edward Beukes
4.56 (9)
Stargogs Spike Catcher V4.0 This Indicator is Developed To milk the BOOM and CRASH indices . Now Also work on weltrade for PAIN and GAIN indices. Send me Message if you need any help with the indicator.  CHECK OUT THE STARGOGS SPIKE CATCHER EA/ROBOT V3: CLICK HERE ALSO CHECK OUT SECOND TO NONEFX SPIKE CATCHER:   CLICK HERE STARGOGS SPIKE CATCHER V4.0 WHATS NEW! Brand New Strategy. This is the Indicator you need for 2025. New Trend Filter to minimize losses and maximize profits. New Trendline th
PrimeScalping
Temirlan Kdyrkhan
PrimeScalping is a powerful trading companion designed to generate high-probability entry signals with dynamic TP/SL/DP levels based on volatility. Built-in performance tracking shows win/loss stats, PP1/PP2 hits, and success rates — all updated live. Key Features: Buy/Sell signals with adaptive volatility bands Real-time TP/SL/DP levels based on ATR Built-in MA Filter with optional ATR/StdDev volatility Performance stats panel (Success, Profit/Loss, PP1/PP2) Alerts via popup, sound, push, or e
作者的更多信息
Smart Chandelier Exit
Bugra Kaan Yildirim
5 (3)
Smart Chandelier Exit Smart Chandelier Exit is an adaptive trailing-stop and trend-direction indicator. It plots a multi-layer ratchet stop line that follows price: green below price in an uptrend, red above price in a downtrend. The line only ever ratchets in the trend's favor, never against it, so it doubles as a mechanical trailing stop and a clear trend-state signal. What makes it smart is the built-in Pearson R trend-quality filter. A raw stop line tells you where the stop is; the Pearson R
FREE
Smart Exit EA
Bugra Kaan Yildirim
Smart Exit EA — Ride the Trend, Skip the Chop Smart Exit EA follows a trend with an adaptive ATR trailing line and stays in the move until the trend really turns. It is built for two problems every trend trader knows: getting shaken out of a good trade too early, and getting chopped up in a sideways market. Release notes, chart examples and new product announcements are posted on the TrendTower channel:   https://www.mql5.com/en/channels/trendtower What It Does Rides trends longer.   The trailin
FREE
Refine OBV
Bugra Kaan Yildirim
Refine OBV  Refine OBV measures cumulative volume flow read against its own adaptive signal line with a color-coded spread and non-repainting divergence detection. Raw On Balance Volume answers one question: is volume being credited to the buyers or the sellers? While useful, raw OBV is a single wandering line with no reference point. Refine OBV adds an adaptive EMA of the flow itself as a reference line. The distance between the flow and its signal line (the spread) is rendered as a color-coded
FREE
Trix Trend
Bugra Kaan Yildirim
Trix Trend algoteknik · MetaTrader 5 Indicator Manual Overview Trix Trend is a momentum oscillator based on TRIX — the rate of change of a triple-smoothed exponential moving average of price. Triple smoothing removes most of the short-term noise, so the oscillator reacts to the underlying momentum of the move rather than to every small wiggle, while staying more responsive than a simple long moving average. The indicator draws a slope-colored TRIX line, a weighted signal line, a zero line, and t
FREE
SVS Assistant
Bugra Kaan Yildirim
SVS Assistant SVS Assistant is the execution half of Smart Volatility Squeeze MT5. It carries out the orders you request from that indicator's 1-Click Trading Desk, applies your risk rules to them, and manages the resulting positions. It is published free of charge. Please read this before downloading: it does not analyse the market and it produces no signals of its own. Without the Smart Volatility Squeeze indicator running on the same chart there is nothing for it to listen to, and it will do
FREE
Smart Volatility Squeeze MT5 Smart Volatility Squeeze MT5 is a volatility compression and momentum expansion indicator for MetaTrader 5. It builds on John Carter's Volatility Squeeze framework and extends the usual single-tier squeeze into three compression tiers, so you can see not only whether the market is compressed but how tightly it is compressed before it expands. The indicator opens in a separate window and draws two elements: a linear regression momentum histogram and a row of coloured
Quant Desk Pro
Bugra Kaan Yildirim
Quant Desk Pro An R-native trade manager for MetaTrader 5.   It manages the trades you have already opened: it measures what each one is really risking, protects it, scales out of it on a plan you set, trails what is left, and stops the whole book when the day has gone far enough wrong. Read this first.   Quant Desk Pro does not open trades and has no signal. And it ships in   VIEW ONLY : it will not send a single order until you set   I understand the risks   to true in the inputs. Until you do
筛选:
无评论
回复评论