ASI fractals with DPO filter
- 指标
- 版本: 1.10
- 更新: 22 九月 2022
- 激活: 5

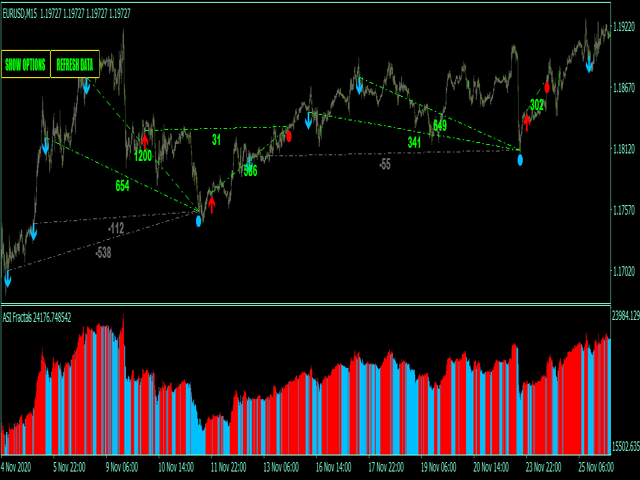
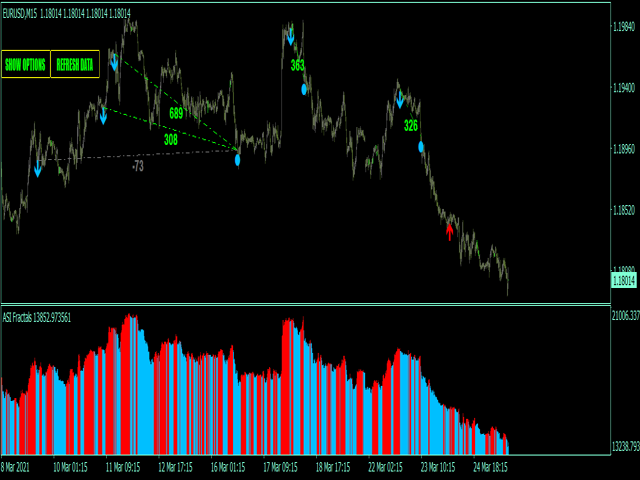
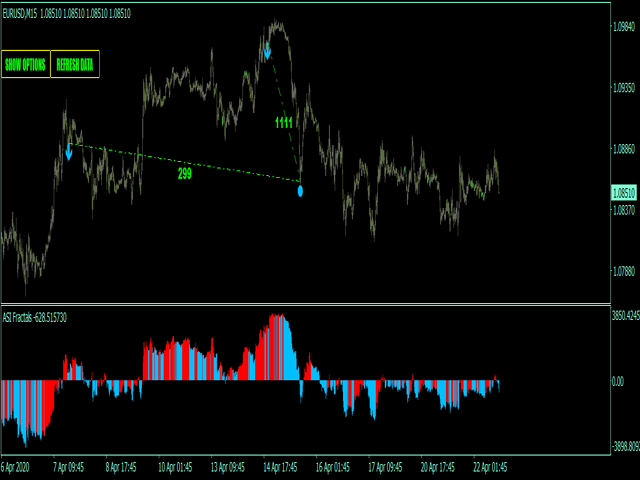
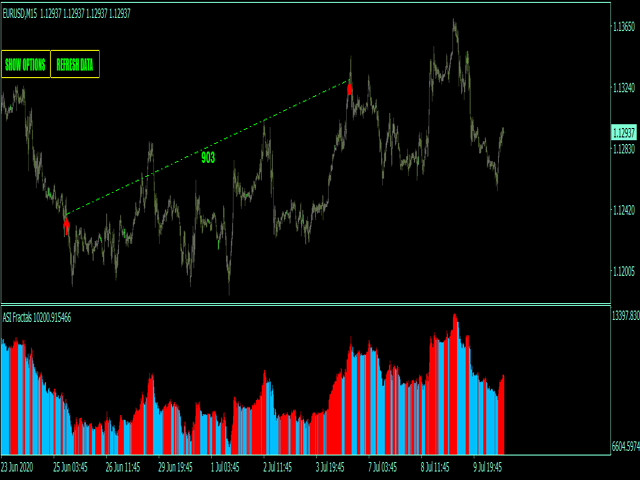
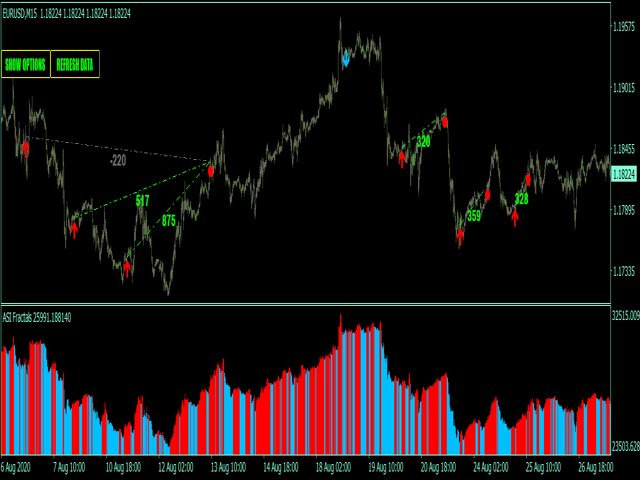
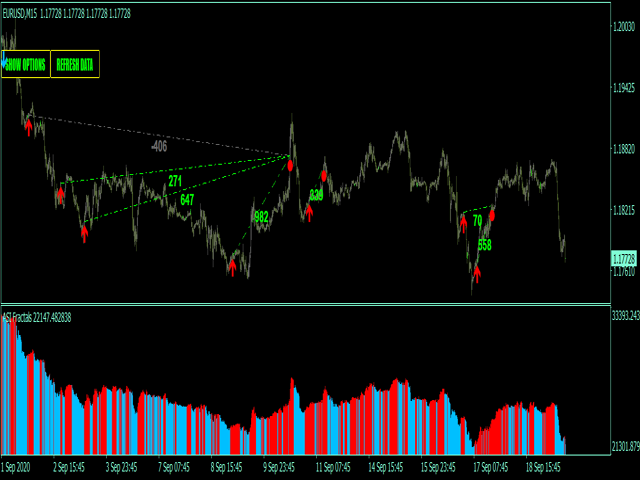
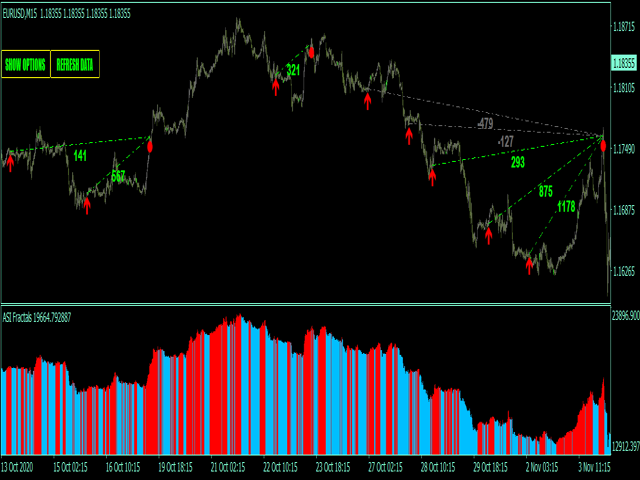
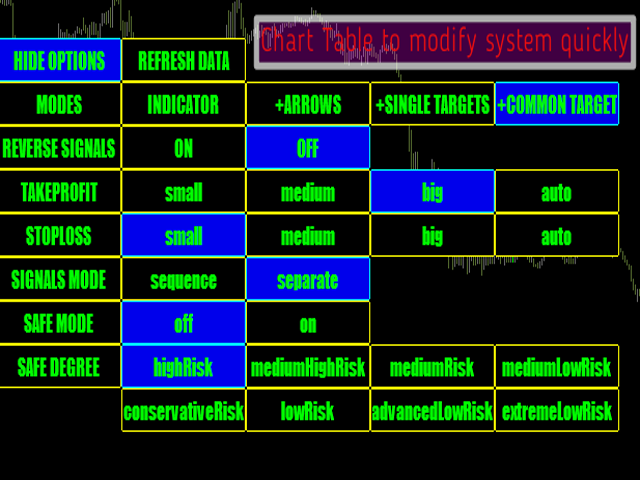
ASI fractals with DPO filter - is the manual trend-following system. ASI fractals are the base of every trend. System plots an arrow when fractal pattern appears on ASI indcator and DPO direction is same as incomming signal. System has several ways of usage : simply indicator, indicator with suggested arrows, arrows with single targets and arrows with common profit targets. User can simply switch indicator's modes directly from chart.
Main Indicator's Features
- Signals are not repaint,non-late or disappear;
- Every signal comes at the open of new bar(system uses only confirmed signals);
- Indicator has Alerts, Mail and Push notifications(allow to trade out of PC, from smartphone/mobile app);
- System is 100% autoadaptive no need manual adjusting. Just set up and start trading.
Recommendations for trading
- 5-60 min timeframes is the best choice;
- Volatility / Trend pairs(EURUSD,GBPUSD,USDCHF,GBPJPY etc..) with small swaps, Gold and Crypto markets;