Quant Key Levels

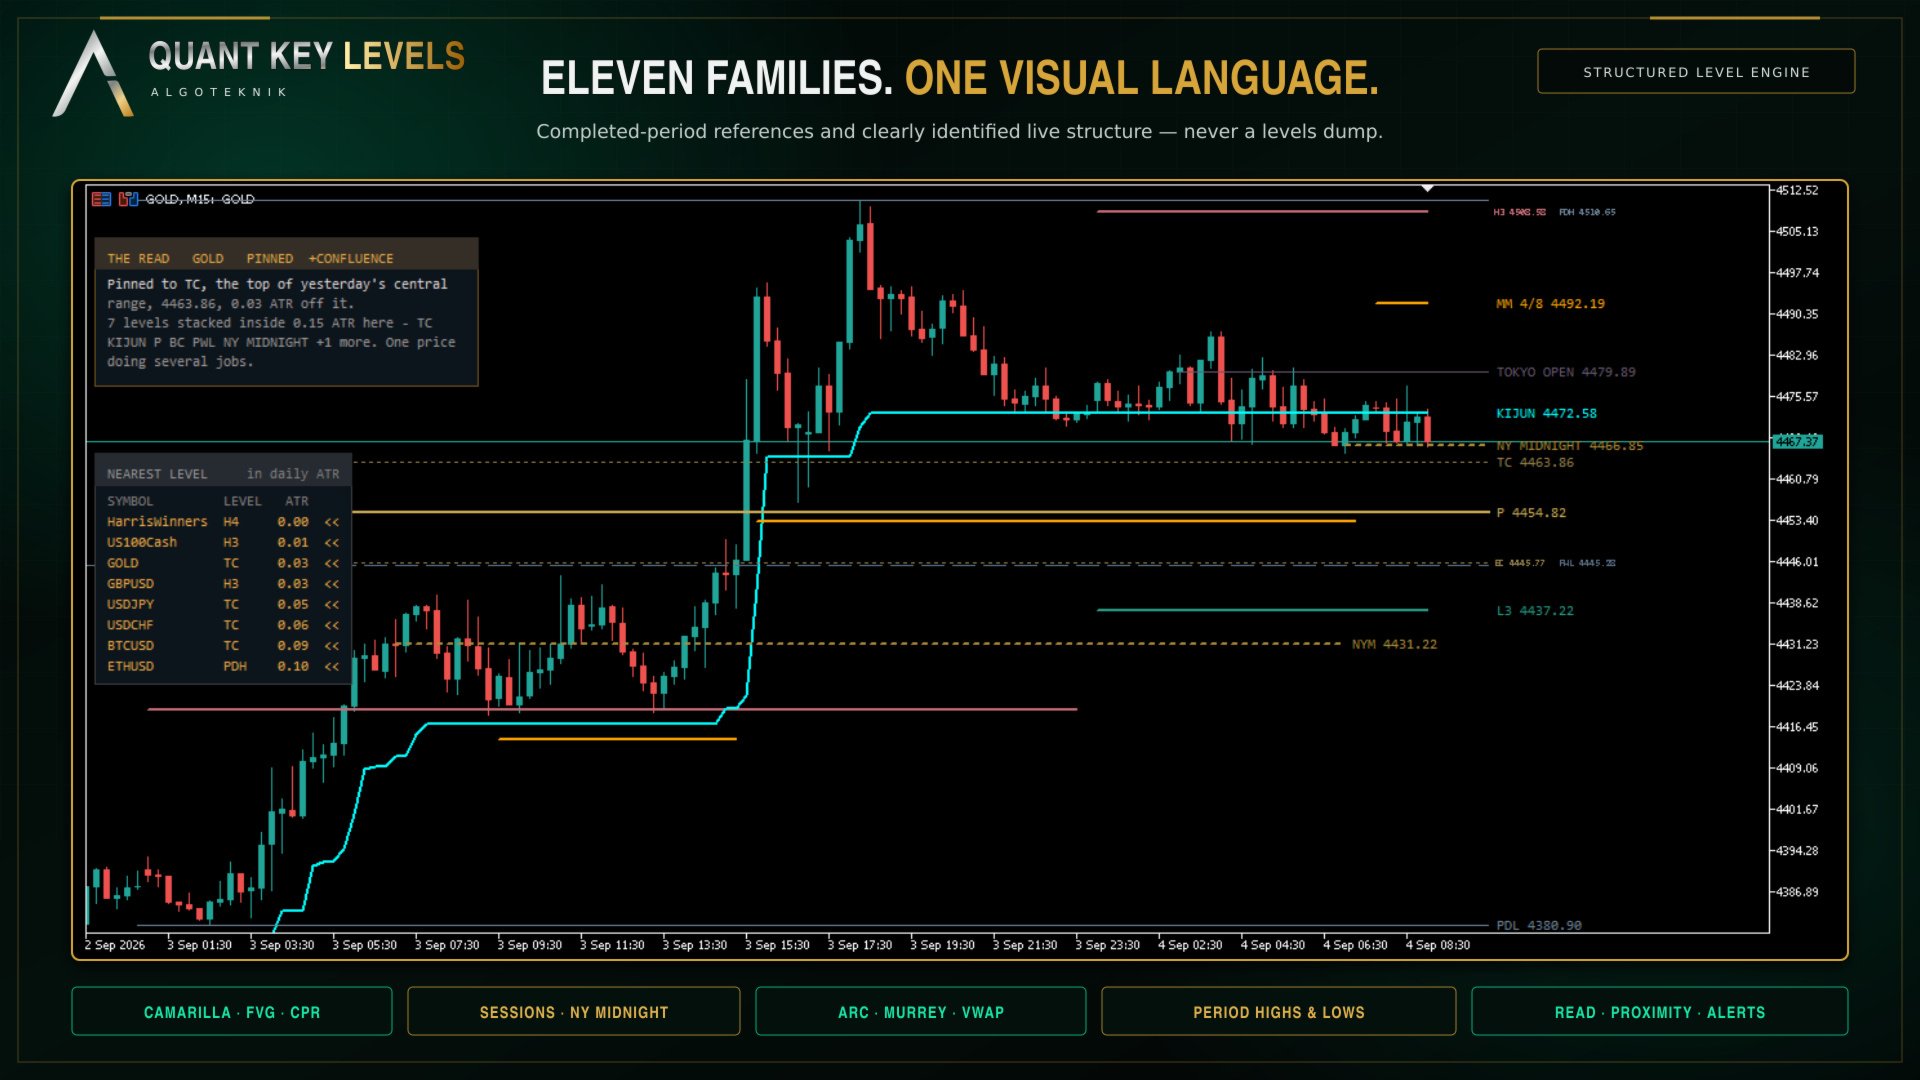
Quant Key Levels, version 1.0. The reference levels a discretionary trader actually works from, on one chart and in one visual language. Eleven families, each on its own switch, and nothing on the chart that a level does not earn.

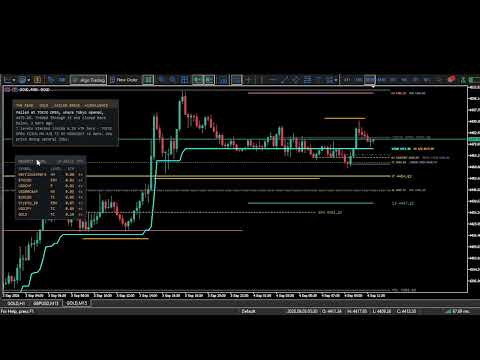
What separates it from a pivot pack is not the number of families. It is that the things most level tools assume, this one measures. How far your broker's clock sits from UTC, measured out of your own terminal rather than typed into a box. Where an exchange actually opens, to the minute, on that exchange's own daylight saving calendar. How wide a pivot range is, in the symbol's own average day rather than in points that mean nothing across instruments. And what it measures it shows you: the offset goes in the journal and optionally on the chart, the range width is written on its label, the distance to the nearest level is a number you can read.

Every level is defined from a period that has already closed, so once it is drawn it does not move. There is exactly one exception and it is marked as such, today's running high and low, which is a live range by definition. Where the numbers can be checked against something you already own, they are: the Camarilla family matches the Camarilla Channel that ships with MetaTrader 5, value for value, on the same chart.

Release notes, chart examples and new product announcements are posted on the TrendTower channel: https://www.mql5.com/en/channels/trendtower

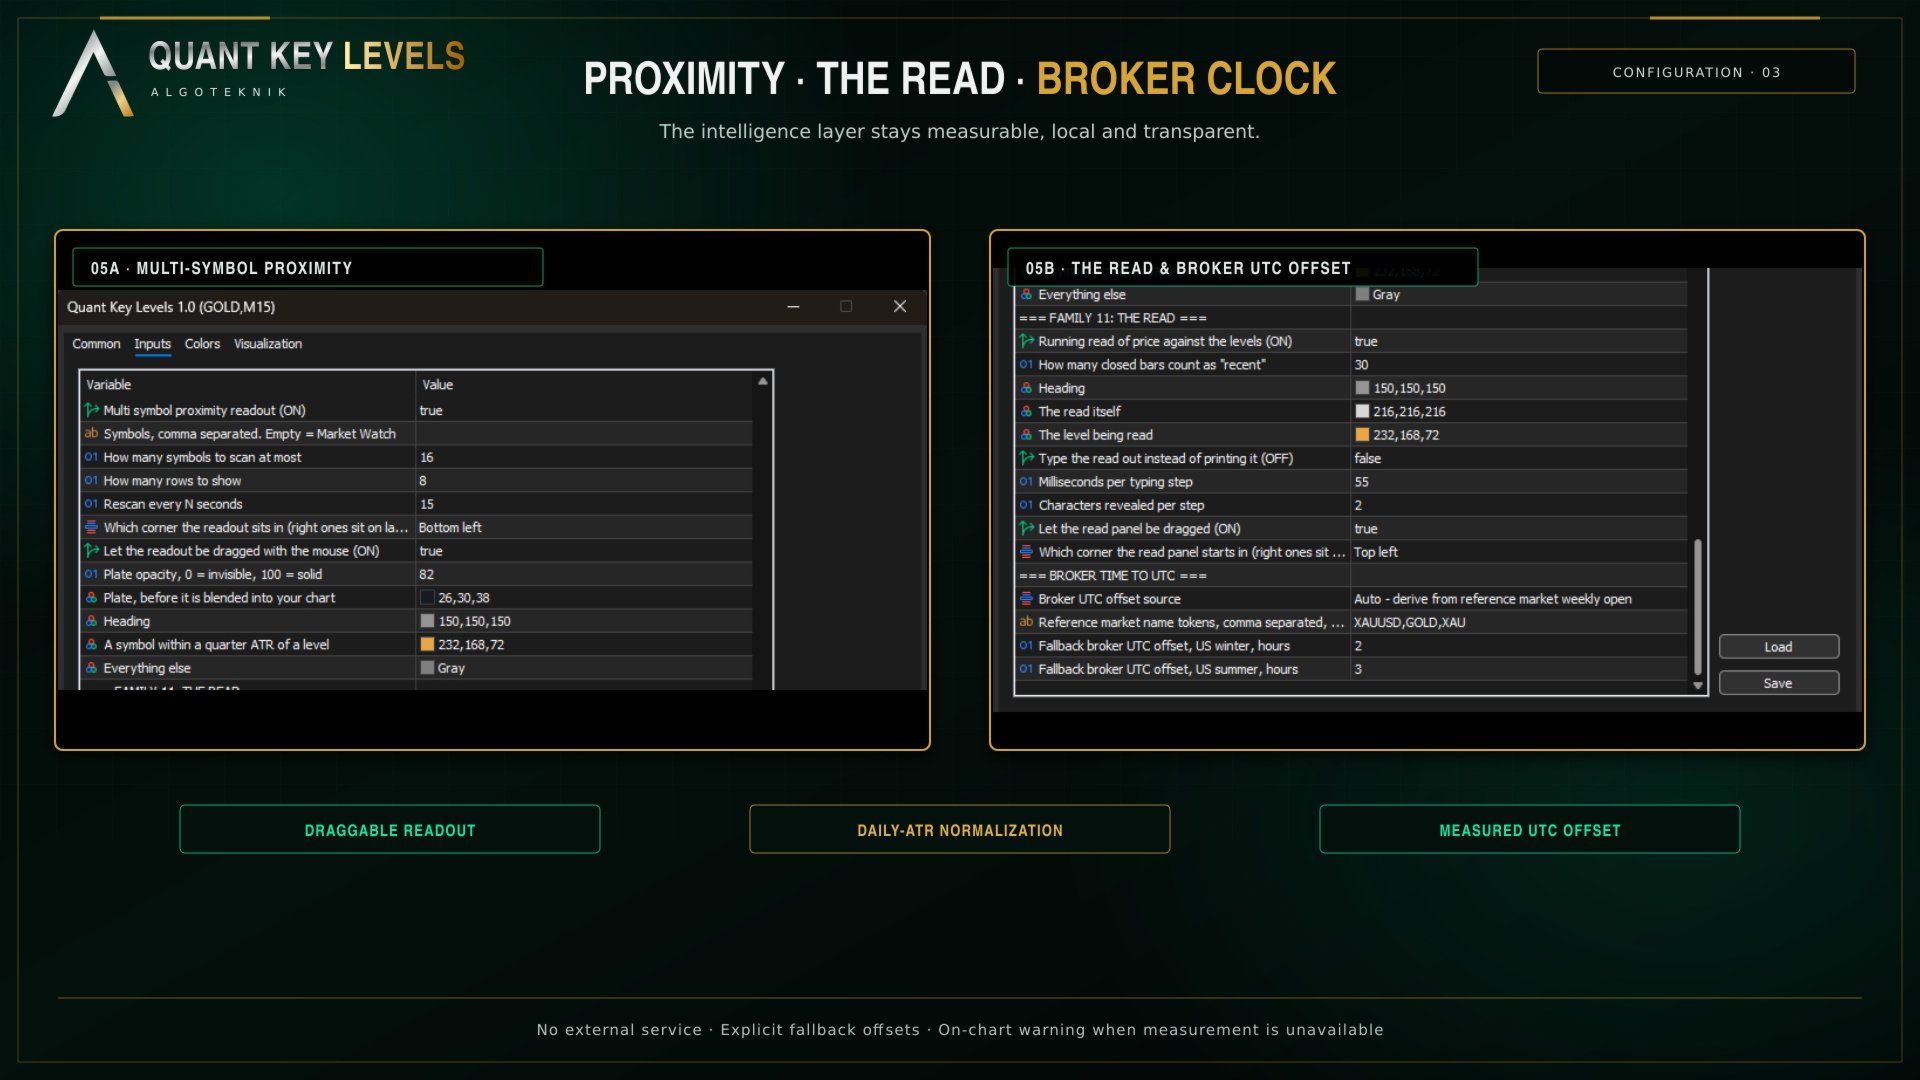
The broker clock is measured, not typed in

Three families are built on one number. The true New York midnight open, the six session levels and both daylight saving calendars all run off the broker's distance from UTC. Most level indicators ask you for it, or take it from the server offset, and either way it is wrong twice a year and wrong again when you change broker.

Here it is solved from data. The indicator reads the weekly opening bar of a reference market out of your own terminal and finds the single whole hour offset that puts that opening on Sunday at its known UTC time. There is no internet request, no external service and no library to install. The chart's own symbol is deliberately not used as the anchor: many brokers trim foreign exchange to broker midnight, and that silently produces an offset one hour wrong, so a continuously traded instrument is used and gold is the default. The name tokens searched for are an input.

The answer is reported in the journal at start-up and can be shown on the chart. When it cannot be measured a warning appears that cannot be switched off, because a wrong offset puts those levels on wrong prices while the chart still looks entirely reasonable. In the Strategy Tester, where only the tested symbol is loaded and the reference is usually missing, it says that too, and falls back to manual winter and summer offsets you can set.

Real exchange hours, and two daylight saving calendars

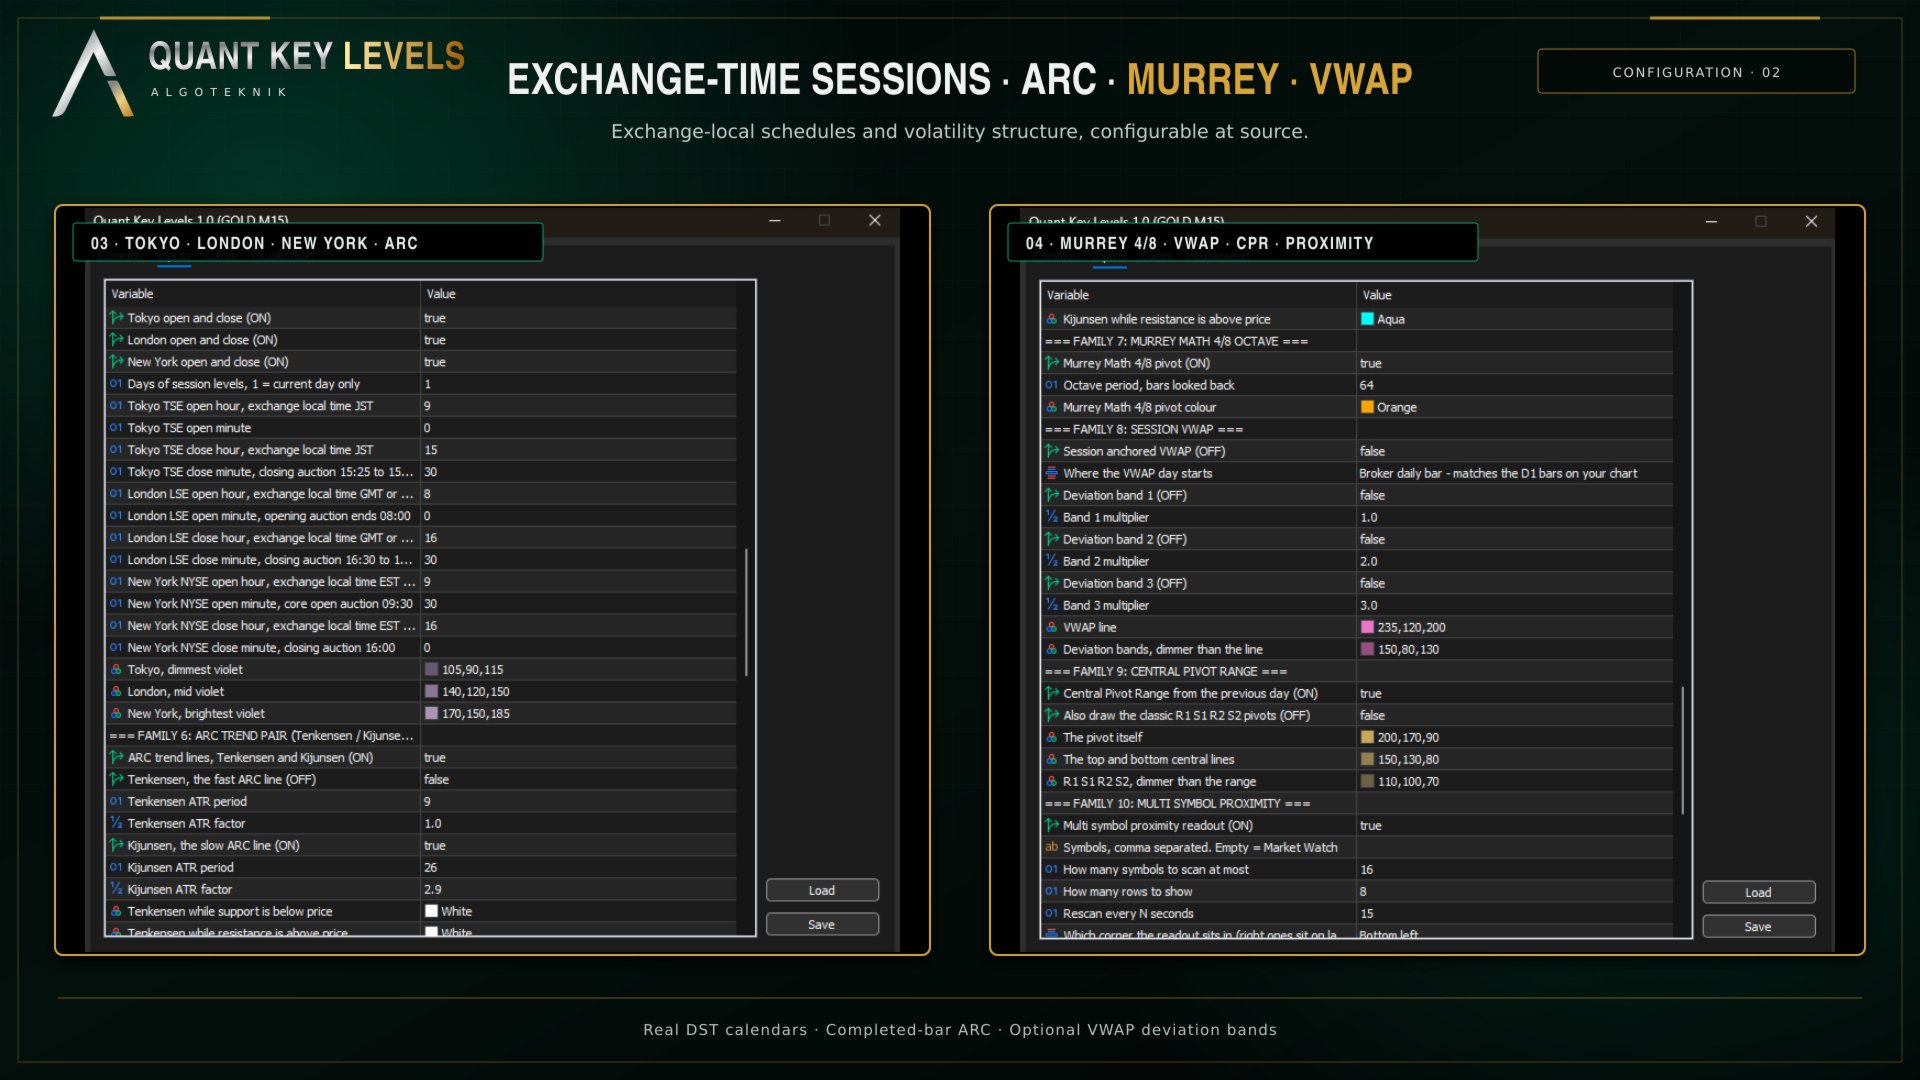
Six price levels, not shaded ranges: the open and the close of Tokyo, London and New York. These are not the rounded 08:00 to 17:00 blocks most session tools draw. They are the published trading hours of the three exchanges, to the minute. Tokyo runs 09:00 to 15:30 JST, with a closing auction from 15:25 that sets the official close, a 15:30 close that has been in force since November 2024, and no daylight saving anywhere in Japan, so it is 00:00 to 06:30 UTC every day of the year. London runs 08:00 to 16:30 London, with an opening auction ending at 08:00 and a closing auction from 16:30, which is 07:00 to 15:30 UTC on British Summer Time and 08:00 to 16:30 UTC on Greenwich Mean Time. New York runs 09:30 to 16:00 Eastern, the core open auction at 09:30 rather than 09:00, which is 13:30 to 20:00 UTC on Eastern Daylight Time and 14:30 to 21:00 UTC on Eastern Standard Time.

Every one of those times is entered as the exchange's own local time, hour and minute, exactly as that exchange publishes it. You never type a UTC number and you never type a summer variant and a winter variant: the conversion and the changeover are done for you, so nothing has to be re-entered twice a year. Change the local times if your working definition of a session differs and the UTC placement and the daylight saving shift stay correct on their own. Each level's tooltip shows both clocks, the UTC instant and the exchange local time with the zone in force that day, so you can check the placement without doing the arithmetic.

The two zones do not switch on the same weekend. In late October the United Kingdom has already fallen back while the United States has not, and for that week London and New York shift on different days. Each zone follows its own calendar here, so that week is handled correctly rather than smoothed over with one shared offset. Open is drawn solid and close dash dot in one violet family, so you can tell an open from a close by pattern alone. A boundary that has not happened yet draws nothing at all, and the close level appears only once the session has actually closed.

One unit: the symbol's own daily ATR

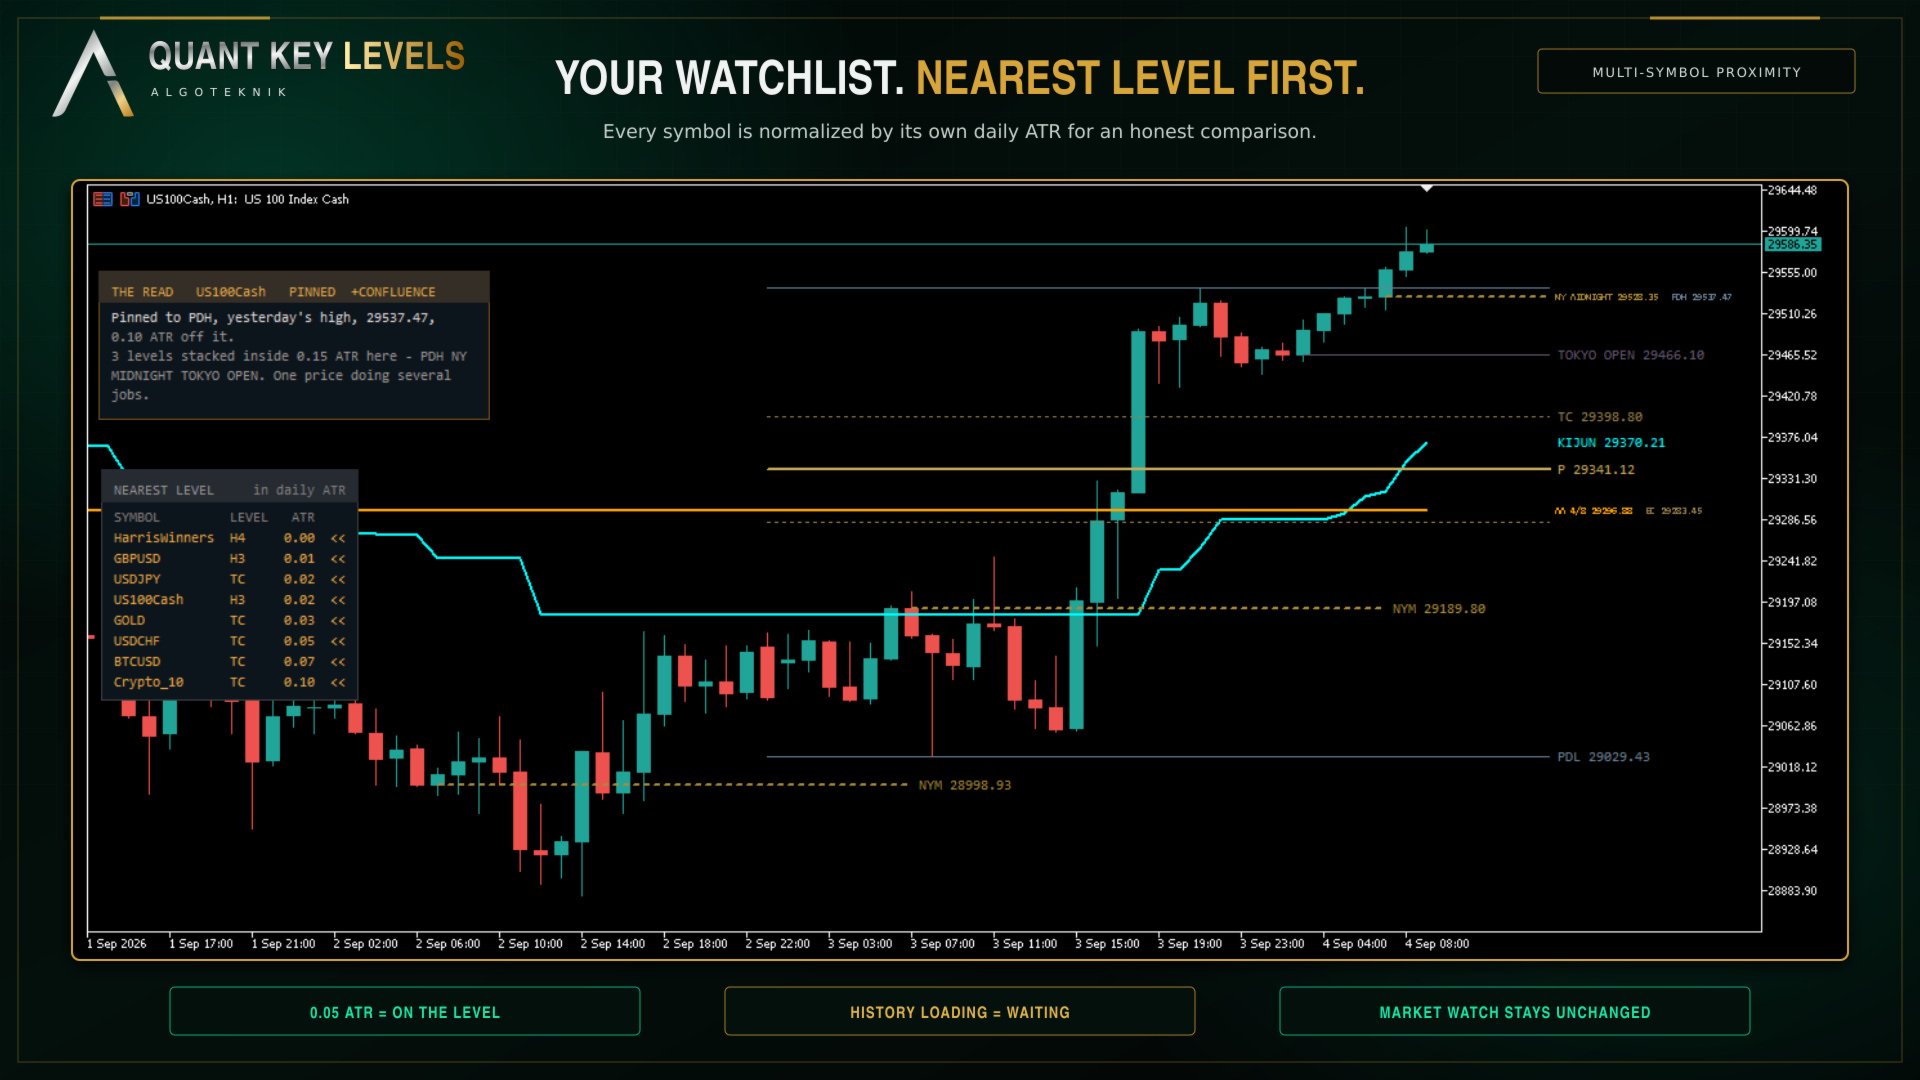
Distance in points does not travel. Forty points is nothing on gold and most of a day on EURUSD, so a number that is supposed to tell you how close price is to a level has to be normalised before it means anything. Everything in this product that reports a distance reports it in that symbol's own daily average true range, and that one decision is what lets a gold row and a EURUSD row sit in the same table and be read against each other.

The same unit measures the Central Pivot Range. P, TC and BC come from yesterday's daily bar, and the reading is the width between TC and BC rather than the lines themselves: narrow says yesterday closed near its own midpoint and the market did not decide, wide says it trended. That width is written on the label as a number, as in “TC 0.42 ATR wide”, so a narrow day is a measurement rather than an impression. TC is not always above BC. When yesterday closed below its own midpoint the pair inverts, and that flip is information, so both are drawn where they fall rather than sorted into a fixed order. The classic R1 S1 R2 S2 ride on the same pivot and ship off, because this family exists for the range.

A running read of the chart, in the language a desk would use

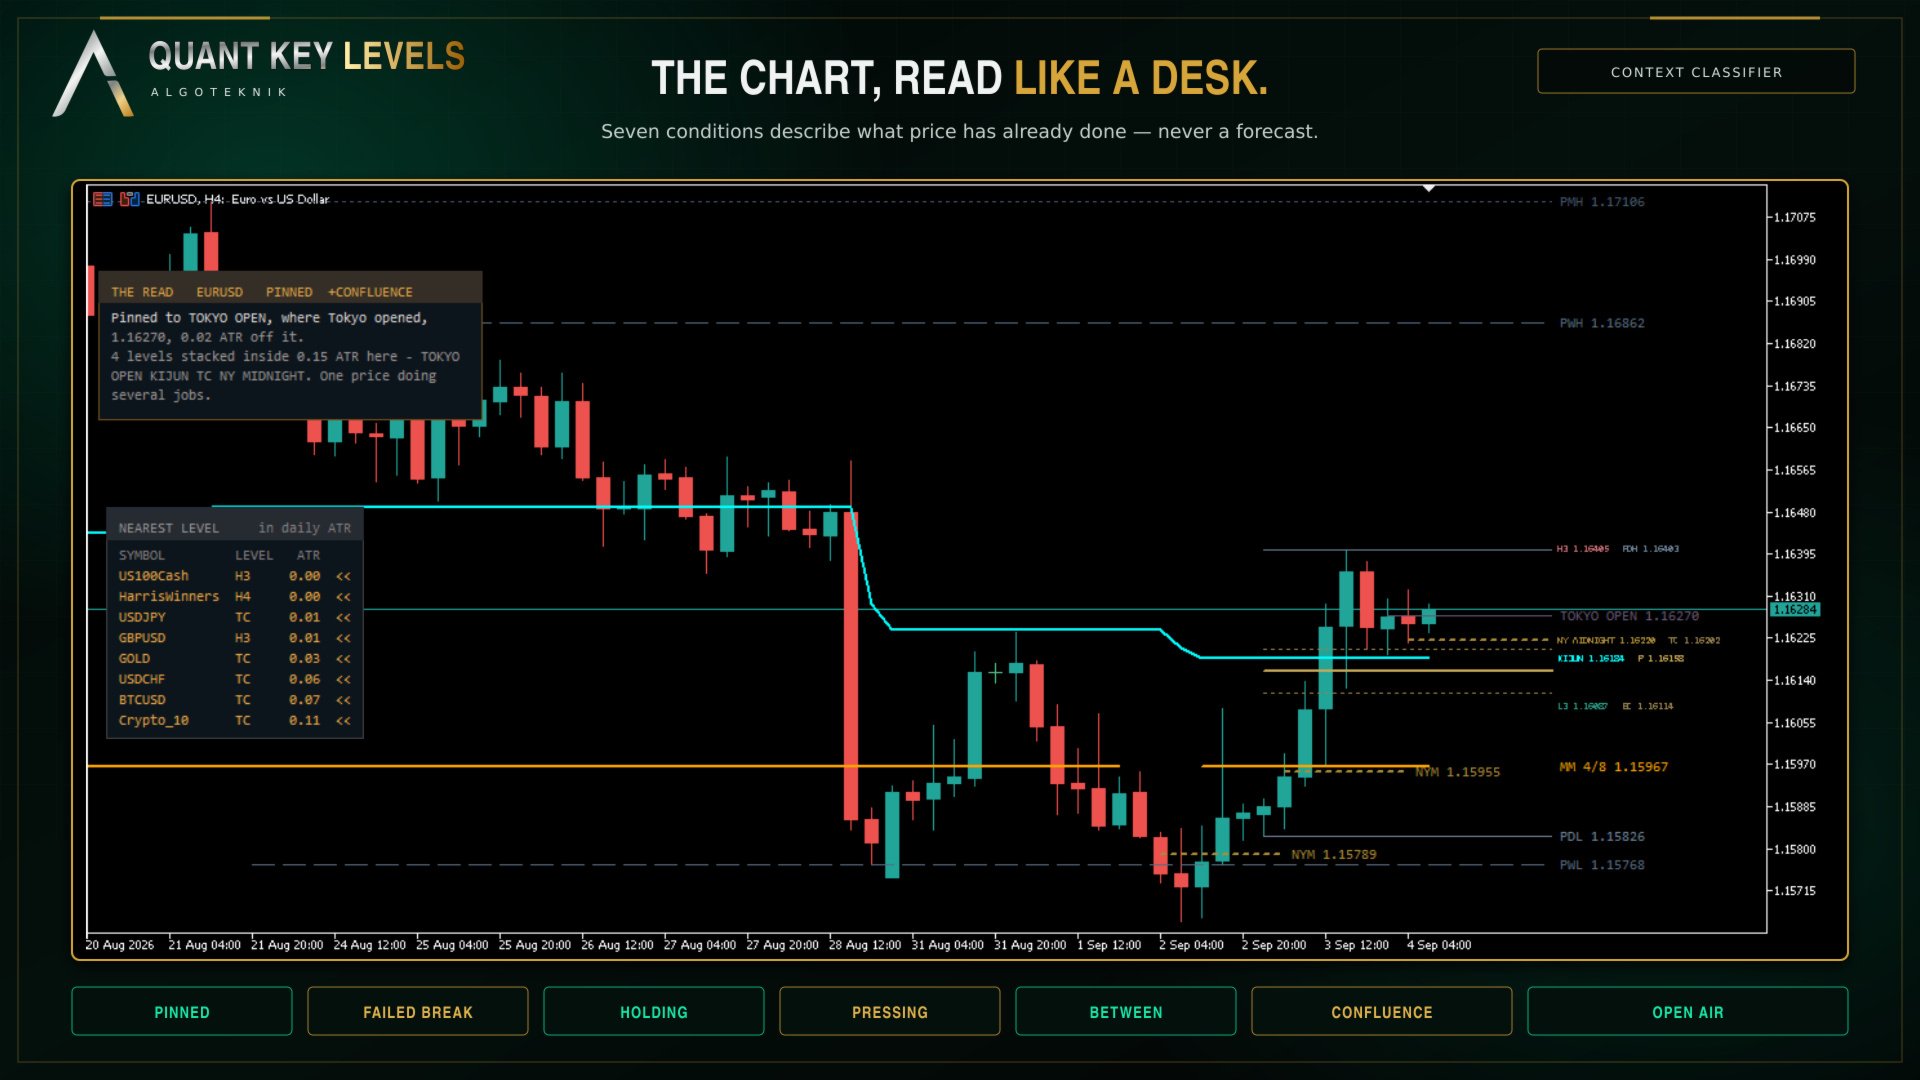
“Pinned to L3 4412.80, 0.04 ATR off it. Four touches in the last thirty bars and no close through.” The read measures the distance from price to every level on the chart in daily ATR, decides which of seven situations that is — pinned, failed break, holding, pressing, between, confluence, open air — and prints the sentence for it with the real numbers in. The panel holds eight lines; on the rare read that fills them the last line ends in three dots, which is the panel saying it ran out of room rather than the read stopping there.

It is a classifier, not a crystal ball, and the distinction is the point: there is no model, no forecast and no network anywhere in this product. Nothing on that panel says where price is going or what to do about it. Every sentence is a statement about what has already happened, which is the only thing a chart can honestly tell you. The same inputs produce the same sentence every time, and it holds its level through the small moves that would otherwise make it flicker between two neighbours.

The question a single chart cannot answer

Which of the things you trade is on a level right now. The multi symbol proximity readout scans your Market Watch, or a list you give it, and reports each symbol's distance to its nearest key level in that symbol's own daily ATR. 0.05 means price is on the level; 1.00 means a full average day away; anything inside a quarter of an ATR is called out. Nine levels per symbol, all from its previous completed daily bar. It never adds anything to Market Watch to fill the list out, and a symbol still downloading its history is shown as waiting rather than reported as a zero. In the Strategy Tester only the tested symbol is loaded, so the readout shows one row there and says so on the plate; that is the tester, not the product. When a symbol has no live quote, because the market is closed or it has not ticked since the terminal opened, its last daily close stands in for the price.

Nothing repaints, and the one thing that moves says so

Every level here is defined from a period that has already closed. The daily average true range that the read, the proximity readout and the pivot range width are measured in is built from closed daily bars only and never touches today's forming bar, so those numbers do not drift through the session. The Murrey octave is computed from the bars before the current one, so it is fixed the moment its bar opens. The ARC pair draws the level as it stood after the previous bar closed. The VWAP value on a closed bar was measured against its own recomputation and never changed afterwards. The single exception is today's running high and low, which is a live range by definition and carries a tilde in its name so it can never be mistaken for a settled level.

Levels that stay readable

A level that is flat for a day and jumps at the boundary is two shelves, not one sloping line. Drawing it as a single continuous line paints a vertical through prices that were never a level, and that is what turns a pivot chart into a staircase. Every family here that steps — the Camarilla set, the Murrey octave, the ARC pair at a side change — is drawn as separate flats with the joining bar left blank.

With everything switched on, eleven families put their levels on the chart and their labels all want the same strip of screen at the right edge. Rather than let them print on top of each other, the labels go into one queue and a single pass lays out the whole column at once. Labels that land within one text height of each other belong to one row, and a shared row is written side by side: they are not merged and nothing is thrown away, so each label keeps its own text, its own price and its own colour. A shared row is set 25 percent smaller than a label that has its row to itself, which is what buys the horizontal space back, and the widths are measured with the real font metrics rather than guessed from a character count. Grouping runs in order of importance and the rows come out correctly spaced on their own, so no label is nudged off its own price and none is hidden. A row holds at most six labels by default; past that the last one carries a “+N” so the count stays honest. Crowding is measured in pixels, so the column is recomputed as you zoom.

The two panels are drawn as framed plates whose colour is blended with your chart background rather than painted over it, so the candles behind them stay readable. Both can be dragged anywhere and both remember where you put them, per symbol.

The eleven families

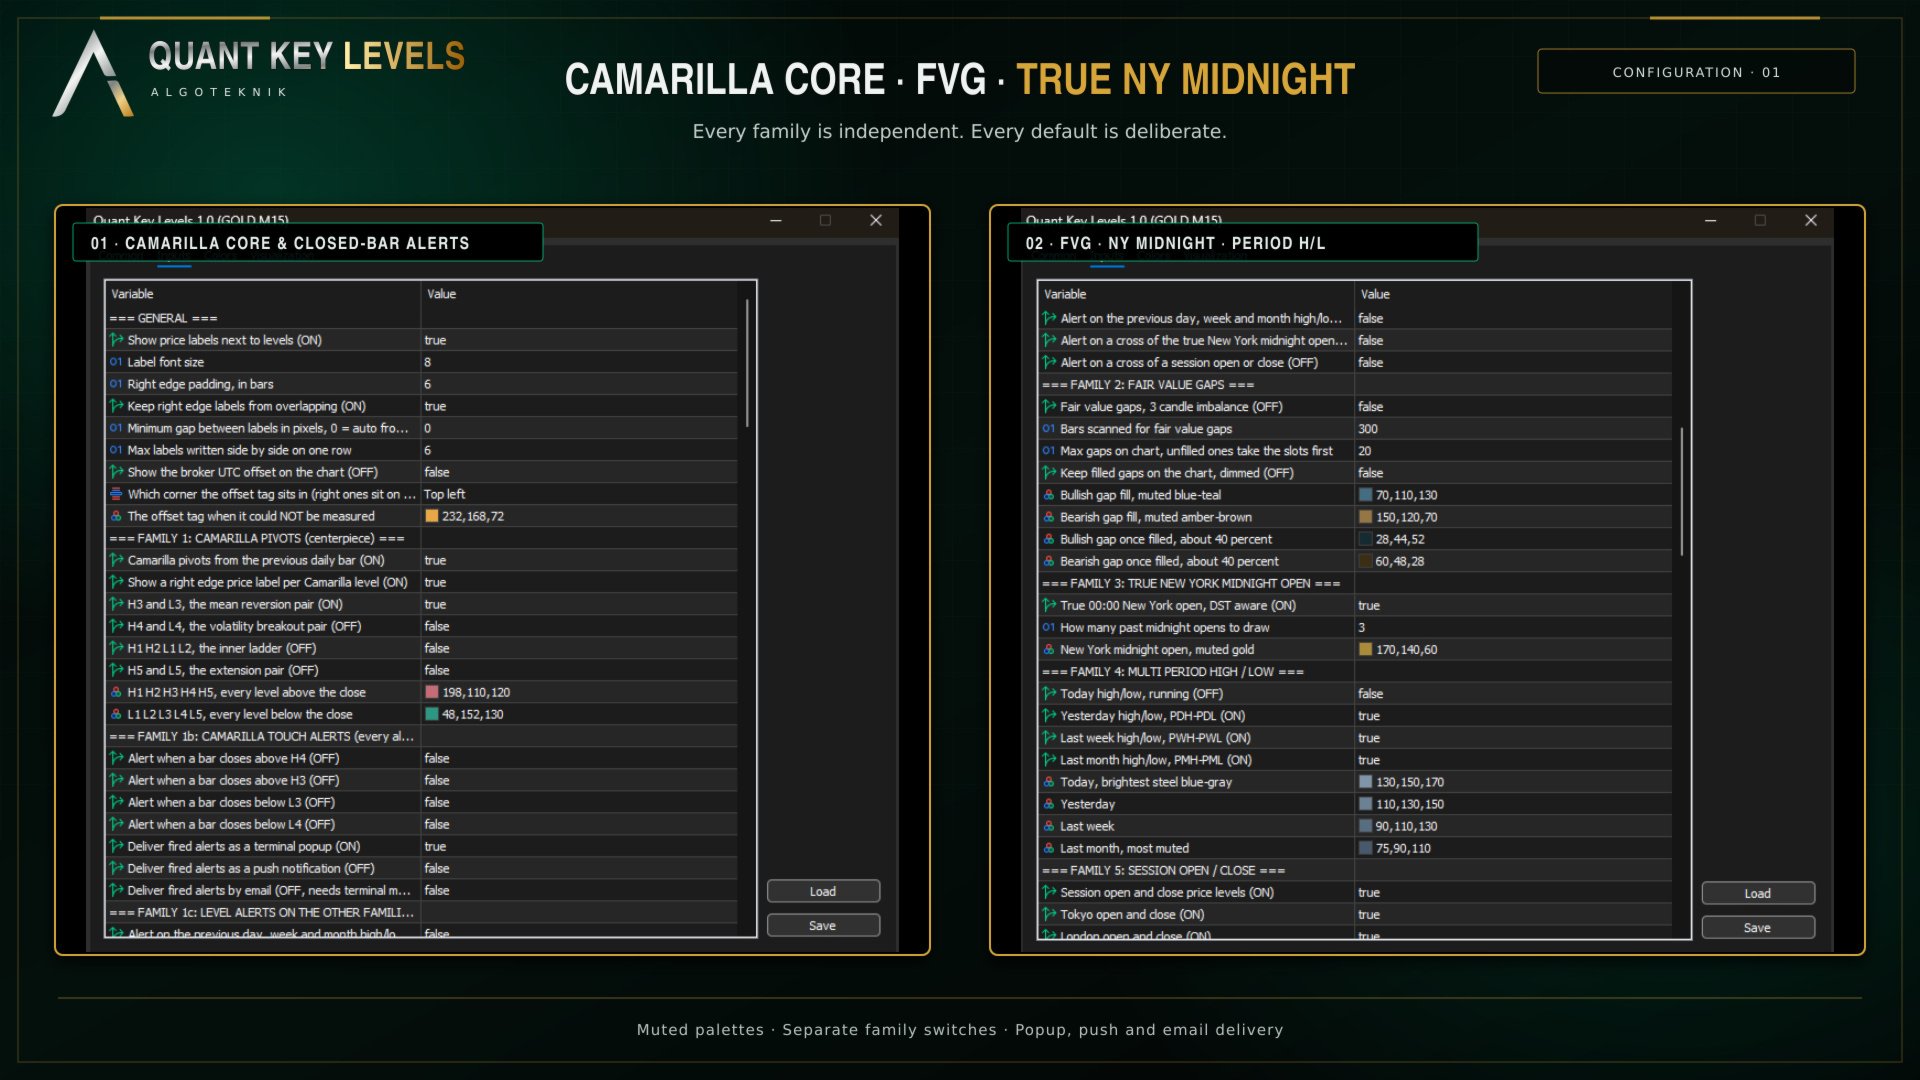
Camarilla pivots. Calculated from the previous completed daily bar, with R as the previous high minus the previous low. H4 and L4 sit at Close plus or minus R times 1.1 divided by 2, H3 and L3 at 1.1 divided by 4, H2 and L2 at 1.1 divided by 6, H1 and L1 at 1.1 divided by 12. H5 is the previous high divided by the previous low, multiplied by Close, and L5 is H5 mirrored around Close. This is the Camarilla Channel that ships with MetaTrader 5, drawn the way it draws it: all ten lines on every bar, solid, with H3 and L3 heavy and the other eight thin. The colours are this product's own, rose above the close and teal below it, measured for contrast rather than picked by eye. Switch all four pairs on, put the stock Camarilla Channel on the same chart, and every value sits exactly on top of its own. That is the only kind of proof worth offering.

What ships on is the mean reversion pair alone, H3 and L3. Ten lines at once is a wall and those are the two a trader actually works from. The other three pairs are one switch each, because a level and its mirror are read together, and turning a pair off removes its line, its right edge label and its touch alert together. The arithmetic is untouched: every level is still computed, so turning a pair back on shows the numbers that were always there.

What this module adds to the stock version is correctness, never a different picture. The stock indicator builds its object prefix from the clock, so it changes on every restart and leftover labels can never be swept away; here the prefix is fixed and a sweep runs before anything is drawn. The stock indicator can stall permanently when the previous daily bar is missing, and not only for that bar but for the whole rest of the chart; here the history is actively requested, the affected bar is left blank and the levels repair themselves when the data arrives. The stock indicator divides by the previous Low without checking it; here H5 and L5 are left out rather than invented when that division is not safe. The stock indicator refuses to start at all above D1; here Camarilla simply stops drawing above D1 while the other families carry on. Several vendors publish different H5 and L5 conventions; the one used here is the MetaQuotes published extension, and it is written on the tooltip of the level itself, so a number that differs from another package is a convention difference rather than an error.

Fair value gaps. The classic three candle imbalance, scanned over the last 300 bars by default and drawn as a shaded block extended to the right for as long as the gap stays open. A gap counts as filled the moment price trades through its far edge, the bottom of a bullish gap or the top of a bearish one, because reaching that edge means the whole imbalance has been traded back through. The box is cut at the candle that fills it and is never drawn past that candle. A filled gap is not deleted: it is dimmed and its right edge is frozen there, so the record of where imbalance was resolved stays on the chart. At most twenty gaps are kept, open ones claim the slots first, and the first thing dropped is always the oldest already resolved gap.

True New York midnight open. The daily open at midnight New York time, which is 05:00 UTC in winter and 04:00 UTC in summer, switching on the real United States daylight saving dates rather than on a broker server offset that someone typed in once. It is placed with the measured clock described above.

Multi period high and low. Four periods, each with its own switch. Yesterday, last week and last month ship on; today running ships off because it is the one level that moves all day. Every value is read from a completed daily, weekly or monthly bar rather than assembled by scanning intraday bars across a boundary, which is what makes weekend and holiday gaps a non issue. On a Monday the previous day is simply the previous daily bar, which is Friday. Style carries recency rather than colour: all four use one steel blue family, and you read the age of a level from how it is drawn.

  • Today, solid and brightest
  • Yesterday, solid and slightly muted
  • Last week, dashed
  • Last month, dotted and most muted

Session open and close. The six exchange levels described above, drawn from the published hours of Tokyo, London and New York on their own daylight saving calendars.

ARC trend pair. ARC stands for Average Range times Constant, from Welles Wilder Jr, 1978. A constant times the Average True Range is measured off price to give a level that trails the market, and the rule is short: if close minus factor times ATR is above the level the level moves up to it, if close plus factor times ATR is below the level it moves down to it, and otherwise the level does not move at all. The level is therefore dragged along only when price gets further than one ARC away from it. Inside that band nothing happens, which is why the line sits on long flat shelves and why price can cross it without moving it a single tick. The ATR used is the plain average of true range, not Wilder smoothing.

Two lines are drawn, used the way an Ichimoku uses its two fast lines but built from Average True Range instead of fixed period highs and lows: the Tenkensen on a nine period ATR with factor one, drawn thin, and the Kijunsen on a twenty six period ATR with factor 2.9, drawn heavy. Both period and factor are inputs. Each line has two colour inputs, one for while it sits below price and one for while it sits above, on separate plots so the handover at a side change is flat rather than a jump. They ship set to the same value per line, white for the Tenkensen and aqua for the Kijunsen, so each line reads as one colour unless you choose to have the side called out. The value drawn on a bar is the level as it stood after the previous bar closed, so nothing on the current bar can change it.

Murrey Math 4/8. Murrey Math takes the range of the last sixty four bars by default, snaps it onto a base eight octave grid and cuts that octave into eight equal eighths. The 4/8 line is the middle one, the main pivot, where price is treated as being in balance. Only the 4/8 is drawn here: the other twelve lines of a full Murrey set would turn the chart into a grid, and the 4/8 is the one that behaves like a key level. The calculation is a line for line port of the Murrey Math indicator that is already in the terminal, quirks included rather than tidied up, so the two agree to the last digit and can be checked against each other on the same chart.

Session VWAP. The volume weighted average price, accumulated from the start of the session: each bar contributes its typical price weighted by that bar's activity, and the line is the running average of the two. By default the session starts at the open of the broker's own daily bar, the same boundary the Camarilla levels use and the same one your daily chart draws, so the two never disagree about where the day began; the alternative anchor is true midnight New York.

Where the feed supplies real traded volume it is used. No retail foreign exchange or CFD feed does, so on those instruments the weight is the tick count, the number of price changes in the bar. That was measured rather than assumed, and so was what it tracks: tick count correlates 0.74 with the bar's range, which means it follows activity and volatility rather than traded size, while its shape through the day does match the real liquidity curve. On foreign exchange this line is honestly a volatility weighted mean price, and knowing that is worth more than a footnote. It is timeframe dependent, and so is every other VWAP: each bar contributes a single typical price, so a coarser chart folds more of the movement inside each bar into one number. Three optional band pairs sit at plus and minus a multiple of the weighted standard deviation of price around the line, using the same weights; all three ship switched off, because six lines that move together crowd out everything else.

Central Pivot Range, described above with its width tag. Multi symbol proximity and the read are the tenth and eleventh, and both are panels rather than lines; both ship on, because a feature nobody finds is a feature nobody bought.

Alerts

Camarilla H3, H4, L3 and L4 raise a close alert; so do the previous day, week and month highs and lows, the true New York midnight open, and the session opens and closes. Every one of them judges the last closed bar and never the forming one, none fires for the history that was already on the chart when the indicator loaded, and each level fires at most once a day. Direction is per family: a previous high is broken upward and a previous low downward, so those fire on a close past the level, while a midnight open or a session open has no side to break and fires on a cross in either direction. Delivery is popup, push notification or email, each on its own switch. Every alert ships off.

The Data Window

Every level that is drawn as a chart object is also published to the Data Window under its own name: previous day, week and month high and low, today's running high and low, the New York midnight open, the pivot range, and the six session levels. Hover a bar and read the exact number instead of taking it off a label that shortens when the right edge is crowded. A level is only reported from the bar that defined it onward, so hovering last month does not report today's previous day high, and a family you switch off leaves the Data Window rather than freezing its last value there.

Colours, settings and the full reference

A small set of muted hue families, each distinguished inside itself by line style and weight rather than by adding more colours. Nothing is neon and nothing is a pure red or green, and the shipped values are chosen to stay readable across a long session on a dark chart. Every colour is an input, so the whole palette can be retuned to your own theme without losing the structure.

Colour, line style and width come from the Inputs tab and are re-applied every time the indicator starts, so edits made in the Colors tab do not stick. That is deliberate. A chart stores the plot settings of every indicator attached to it and pushes them back over what the indicator asks for, so a chart that once held a different version of this tool can force that version's settings onto this one, and when the two disagree about how a line is drawn the line does not appear at all. Rather than let a stale chart setting silently blank out a level, the indicator puts its own definition back.

The complete input reference, including every default, every allowed range and the behaviour that has no switch, is in the Manual.txt file, published on the channel linked at the foot of this page. A Market product carries one file, so the manual is not packed with the EX5.

Questions, bug reports and feature requests are welcome on the TrendTower channel: https://www.mql5.com/en/channels/trendtower

This is an indicator for analysis and decision support. It does not place trades. Always test thoroughly before using any tool in live trading. Trading involves risk.

algoteknik

Support, updates and every other product: mql5.com/en/users/bugraky123
Product channel: mql5.com/en/channels/trendtower

Quant Key Levels version 1.0
Produtos recomendados
Apex Trend Zone — Product Description Apex Trend Zone is a trend-following signal indicator designed to capture the market's primary direction and help you stay in a position throughout the trend. By tracking price momentum, it marks potential reversal and continuation points on the chart using clean arrow markers and an adaptive trailing line. The indicator uses a dynamic zone logic that adjusts itself to market volatility. As the trend strengthens, the trailing area widens, aiming to reduce ea
Grid MA Robot MT5
Songkiet Manoharn
Grid MA: Institutional Risk Edition by Hello Quant is an advanced, fully-automated mean-reversion grid framework engineered for stringent capital preservation and extreme volatility management. Unlike traditional grid systems that hold stranded losing positions while scraping small individual profits, Grid MA V1.71 utilizes a proprietary Directional Basket Profit Realization engine. It calculates the net equity of your entire directional exposure (including swaps and commissions) and executes a
Supply and Demand Indicator + FREE Currency Strength Meter ADD-ON Looking for a powerful tool that can help you identify the most reactive zones in the forex market? Our supply and demand indicator for MetaTrader 4 and 5 is exactly what you need. With its advanced algorithms and real-time analysis, this indicator helps traders of all experience levels make informed trading decisions. The supply and demand indicator is a cutting-edge tool that helps traders identify areas where buyers and sellers
ASI fractals with DPO filter - is the manual trend-following system. ASI fractals are the base of every trend. System plots an arrow when fractal pattern appears on ASI indcator and DPO direction is same as incomming signal. System has several ways of usage : simply indicator, indicator with suggested arrows, arrows with single targets and arrows with common profit targets. User can simply switch indicator's modes directly from chart. Main Indicator's Features Signals are not repaint,non-late or
This product is designed for the MT5 platform and offers two key features: VWAP (Volume Weighted Average Price) calculation and Volume Profile analysis. Advantages: VWAP Calculation: The product calculates the VWAP, which is a popular indicator used by traders to determine the average price of a security based on its trading volume. It helps identify potential buying or selling opportunities by comparing the current price to the average price weighted by volume. Volume Profile Analysis: The prod
Smart Volatility Squeeze MT5 Smart Volatility Squeeze MT5 is a volatility compression and momentum expansion indicator for MetaTrader 5. It builds on John Carter's Volatility Squeeze framework and extends the usual single-tier squeeze into three compression tiers, so you can see not only whether the market is compressed but how tightly it is compressed before it expands. The indicator opens in a separate window and draws two elements: a linear regression momentum histogram and a row of coloured
Inspired investing.com Technical Indicators, this indicator provides a comprehensive view of the symbol by synthesizing indicators including: RSI, StochRSI : have 3 level oversold - red, midle (aqua when upper, pink when lower), overbuy – blue Stoch: oversold – red, overbuy- blue, aqua when main line < signal line, pink when main line > signal line MACD: aqua when main line < signal line, pink when main line > signal line ADX:   aqua when line plus > line minus, pink when line plus < line minus
Visual Heatmap Book Analyzer
Alexandre Moraes De Souza Lima
Visual Heatmap Book Analyser Este indicador revolucionário monitora efetivamente a liquidez do mercado e gera as cores a partir de ordens de padrões de quantidades e atividades de renovações no livro. Isso permite que você visualize o fluxo de ordens e identifique áreas de alta e baixa liquidez e alta e baixa atividade. O indicador utiliza técnicas machine learning para analisar o comportamento das ordens no livro. Isso significa que ele pode detectar padrões e tendências nas ordens, permitind
KS Master Tool 12 em 1 Trade with Me é um indicador personalizado para MetaTrader 5 (MT5) num único ficheiro que combina diversas ferramentas de negociação numa única sobreposição na janela do gráfico. Foi concebido para que cada módulo possa ser totalmente ativado ou desativado através de chaves mestras. Quando um módulo está desativado, os seus cálculos, gráficos, temporizadores e processamento de eventos do gráfico são completamente ignorados (utilização adicional de CPU zero para módulos de
No Chase Entry Filter
Mohamed Amr Mohamed Osama Abdelwahab
No Chase Entry Filter - Entradas que não chegam tarde Muitas operações perdedoras não erram a direção. Chegam tarde. A ideia era boa, a entrada aconteceu depois de o movimento já ter ocorrido, e o stop foi atingido num repique comum que um preço melhor teria suportado. No Chase Entry Filter marca entradas de compra e de venda a partir da estrutura de mercado e recusa as que são tomadas a mau preço. Um ponto verde significa comprar a partir daqui. Um ponto vermelho significa vender a partir da
Volume Trio Multi is a three-layer market-structure tool for MetaTrader 5: session Volume Profile (POC, VAH/VAL, Value Area), a CVD volume-pressure histogram with a strict Regular divergence engine, and anchored VWAP with standard-deviation bands — extended with a watchlist scanner that runs all three across the symbols in your Market Watch. This is the Pro edition of my free indicator, Volume Trio. The base engine is identical, so this page describes only what Pro adds. For the three layers the
Alexander The Great EA
Syed Jawad Hussain Naqvi
Alexander The Great EA is a premium Expert Advisor developed exclusively for MetaTrader 5. It is designed to automate disciplined trend-following strategies using intelligent market analysis, advanced risk management, and professional trade execution. Unlike traditional Expert Advisors that rely on basic indicator crossovers, Alexander The Great EA combines trend confirmation, execution filters, and structured money management into a reliable automated trading solution. Every component has been
Delta Profile Volume
Teresinha Moraes Correia
Descrição Técnica do Indicador – Delta Profile para MetaTrader 5 O Delta Profile é um indicador desenvolvido para o MetaTrader 5 com foco em análise detalhada do fluxo de volume dentro de um intervalo definido de candles. Ele organiza e exibe informações sobre o desequilíbrio de volumes positivos (associados a movimentos de alta) e negativos (associados a movimentos de baixa) em diferentes níveis de preço. O resultado é uma visão clara dos pontos do gráfico onde há maior concentração de negócios
A Master Edition é uma ferramenta analítica de nível profissional projetada para visualizar a estrutura do mercado através da lente do volume e do fluxo de dinheiro. Ao contrário dos indicadores de volume padrão, esta ferramenta exibe um Perfil de Volume Diário diretamente no seu gráfico, permitindo ver exatamente onde a descoberta de preços ocorreu e onde o "dinheiro inteligente" está posicionado. Esta Master Edition é projetada para clareza e velocidade, apresentando um sistema único de Auto-T
Reverse Strike
Antonio Gutemberg Frota
Reverse Strike – Indicador Profissional de Reversão para Ouro no MetaTrader 5 EXPERT:  Reverse Strike expert V Reverse Strike é um indicador profissional para MetaTrader 5 desenvolvido para identificar oportunidades de reversão de alta probabilidade no XAUUSD e em outros ativos. Criado com lógica de trailing stop baseada em ATR, análise de regressão linear e confirmação multi-timeframe, ele ajuda traders a detectar possíveis pontos de virada do mercado com mais clareza e precisão. Em vez de simp
VPDemandSupply
Xavier Gregory Yvon Remy Boussougant
Cet indicateur combine plusieurs outils d'analyse technique avancée sur un seul graphique. Il est conçu pour identifier les zones clés de prix, les niveaux de liquidité et les retracements potentiels. Double ZigZag Deux ZigZag superposés avec des sensibilités différentes. Le ZZ1 (argent, rapide) détecte la structure de marché à court terme, tandis que le ZZ2 (or, lent) identifie la tendance principale . Ensemble ils permettent de lire le marché sur deux niveaux simultanément. Zones Supply & Dem
Nspikes Sniper R2 Premium Edition for MT5 Nspikes Sniper R2 Premium Edition is a technical indicator designed for Boom 1000/500/900/600 and Crash 1000/500/900/600 indices. It integrates liquidity zone detection, session filters, and a 3-step recovery entry visual layout directly on MetaTrader 5 charts. Key Features: - Automatic Instrument Detection: Identifies whether the current chart is Boom or Crash and applies the corresponding logic. - Timeframe Optimization: Formatted for M1 and M5 time
HTF FVG Scanner – Indicador de Fair Value Gap para MT5 Exibe Fair Value Gaps de timeframes superiores — H1, H4, D1, Semanal — diretamente no gráfico M5 ou M15. Sem trocar de janela nem marcar manualmente. A maioria dos indicadores FVG escaneia apenas o timeframe atual. Este funciona de forma diferente: ele lê os gaps de um timeframe superior e os desenha no gráfico atual em tempo real. Gaps de H4 em um gráfico M15. Gaps de D1 em H1. Gaps semanais em H4. As zonas permanecem alinhadas ao rolar, a
IntensywnyScalperPro
Bartlomiej Mateusz Konecki
INTENSYWNY SCALPER PRO — Sistema de Scalping Completo em um Único Indicador 1. Adaptive ATR-Based Targets — Works on Any Market & Timeframe 1. Alvos Adaptativos Baseados em ATR — Funciona em Qualquer Mercado e Timeframe Take-profit spacing and stop-loss distance are calculated from real market volatility (ATR). Switch between M1, M15 or M30+, or jump from Gold to Bitcoin to indices — the indicator instantly recalculates all levels. No manual configuration, ever. O espaçamento do take-profit e a
Floating DD Tracker — Free Risk Monitoring Indicator for MT5 Floating DD Tracker is a lightweight and professional MetaTrader 5 indicator designed to help traders monitor real-time floating drawdown directly on the chart. The indicator continuously tracks your current floating drawdown, records the highest drawdown reached, and displays the historical maximum DD with the exact date and time it occurred. Its compact neon-style dashboard is optimized for all chart sizes and provides instant visual
FREE
Optimized Trend Tracker OTT is an indicator that provides traders to find an existing trend or in another words to ser which side of the current trend we are on. We are under the effect of the uptrend in cases where the prices are above OTT , under the influence of a downward trend, when prices are below OTT it is possible to say that we are. The first parameter in the OTT indicator set by the two parameters is the period/length. OTT will be much sensitive to trend movements if it is sma
Liquidity HeatMap Profile
Israr Hussain Shah
5 (1)
Here   our more valuable tools SMC Trend Trading   ,  Easy SMC Trading  ,  Institutional SMC Architect Volume Analysis Tools  ,  Volume flow Profile  ,  Market volume profile  , FVG with Volume  , Liquidity Heatmap Profile  ,  Volume Spread Analysis 2. Key Features Dynamic Filtering : The core feature. As soon as the current price crosses a historical liquidity level, that level disappears. This reduces chart clutter and prevents you from trading off "dead" support/resistance. Liquidity Heatma
Apex Heikin Ashi Pro V1.0 , desenvolvido pelo Sr. Brijesh Jaiswal, é um indicador de tendência premium Heikin Ashi para MT5 que apresenta setas de compra/venda sem repintura (non-repaint), confirmação SuperTrend, cores de vela reais, estilo de gráfico escuro, notificações de alerta e um painel profissional simplificado para uma leitura rápida da tendência. O Apex Heikin Ashi Pro foi projetado para traders que desejam uma maneira mais limpa de identificar a direção da tendência, mudanças de tend
Eng Gold
Ely Alkrar Xshkaky
ENG-GOLD Scalper It is an auxiliary indicator that identifies potential targets and determines the place of entry with a stop loss that works on Heiken Ashi candles  The green lines are usually the targets, the red lines are the stop loss, and the yellow lines are the entry location.  This file is recognized on small and medium frames, usually less than the watch frame I highly recommend using XAUUSD Nasdaq100 Dow30 USOIL 
Sinal IFR
Aurenice Barros De Abreu Carvalho
Sinal com base no indicador RSI, que indica compra marcando com uma seta verde quando o preco sai da região de sobrevendido, e sinaliza venda quando o preco sai da regiao de sobrecomprado. A sinalizacão é  feita com uma seta verde para compra e seta rosa para venda. Permite configurar o nível de sobrecompra e de sobrevenda, além do período do RSI. Funciona em qualquer período gráfico.
Adjustable Consecutive Fractals  looks for 2 or more fractals in one direction and sends out a on screen alert, sound alert and push notification, for strong reversal points . Adjustable Consecutive Fractals, shows the fractals on chart along with a color changing text for buy and sell signals when one or more fractals appear on one side of price. Adjustable Consecutive Fractals is based Bill Williams Fractals . The standard Bill Williams fractals are set at a non adjustable 5 bars, BUT withe th
Tom FX
Bazeermohamad Khanmohamed
TOMMY SCALPER EA — Powered by TOMFX Short Description (MQL5 Market) TOMMY SCALPER EA is a professional XAUUSD (Gold) scalping Expert Advisor for MetaTrader 5, developed to capture fast market movements with disciplined risk management and automated trade execution. Built for traders who prefer simple operation with powerful internal logic, the EA focuses on consistency, precision, and efficient profit management. Simply set your preferred Lot Size and Daily Profit Target, then let the EA manage
A maioria dos traders segue o preço… FARMAN MULTI-TF segue a estrutura por trás do preço. Isto não é apenas um indicador de tendência. É um motor fractal multi-timeframe criado para revelar a verdadeira direção do mercado. E aqui está a verdade: Fractais nunca mentem. Porque o próprio mercado é fractal. O preço muda. O ruído muda. Mas a estrutura permanece. É exatamente isso que o FARMAN TREND V12.9 rastreia. Linhas de Tendência Fractais Multi-Timeframe Modos Dinâmico e Estático Alpha
Gold GridScalper by fxstarpro Advanced Automated Gold Trading EA for MetaTrader 5 Gold GridScalper SD is an advanced automated trading system developed specifically for Gold (XAUUSD) . It combines Supply & Demand analysis, market structure, trend confirmation, volatility filters, and intelligent basket/grid management into one fully automated Expert Advisor. The EA is designed for traders who want a systematic approach to Gold trading without manually monitoring every market movement. Note :
Manyal trading system, CovEchoTrend Robot, focuses on reliability and flexibility. By employing statistical analysis methods to study the relationships between the base indicator and market patterns, the system enables a deeper understanding of market processes. Intelligent pattern analysis: The application of statistical data processing helps identify key trend reversal points more accurately, signaling significant market shifts. Informed decision-making is based on the intersection of indicato
Os compradores deste produto também adquirem
Trend Sniper X
Sarvarbek Abduvoxobov
4.8 (20)
Trend Sniper X é um indicador de acompanhamento de tendência para múltiplos tempos gráficos no MetaTrader 5 que ajuda os traders a identificar a direção da tendência e potenciais pontos de reversão com clareza e precisão. para MT4: https://www.mql5.com/en/market/product/193245 Informações sobre o preço: O preço atual é promocional e está sujeito a alterações à medida que novas atualizações e funcionalidades forem lançadas. Oferta Bônus: Para obter o Auto-Trade Assistant EA GRATUITO para este in
Neuro Poseidon MT5
Daria Rezueva
4.85 (54)
Neuro Poseidon is a new indicator by Daria Rezueva. It combines precise trading signals with adaptive TP/SL levels - creating best possible trades as a result! Message me and get  Neuro Poseidon Assistant  as a gift to automize your trading process! What makes it stand out? 1. Proven profitability on all assets and timeframes 2. Only confirmed BUY and SELL signals present on the chart 3. Adaptive TP & SL levels generated by the software for each trade 4. Easy to understand - suitable for al
UNIX Scalper — Gold Scalping Indicator for MetaTrader 5 UNIX Scalper is a focused Gold scalping indicator designed primarily for XAUUSD on M1, M2, M3, M5, M10 and M15. It gives the trader a clear BUY, SELL or WAIT decision together with the complete trade plan: Entry, Stop Loss, TP1 and TP2 . PRICE UPDATE NOTICE: Currently available for $199. The price will   increase to $399   after the next   30 purchases . The concept is simple: wait for the signal, follow the levels, move the Stop Loss to
M1 Sniper MT5
Oleg Rodin
5 (7)
O   M1 SNIPER   é um sistema indicador de negociação fácil de usar. É um indicador de seta projetado para o período M1. O indicador pode ser usado como um sistema independente para scalping no período M1 e pode ser usado como parte do seu sistema de negociação existente. Embora este sistema de negociação tenha sido projetado especificamente para negociação no M1, ele também pode ser usado em outros períodos. Originalmente, desenvolvi este método para negociar XAUUSD e BTCUSD. Mas considero-o úti
Superhero
Ihor Otkydach
5 (3)
O indicador SUPERHERO é um sistema de negociação multimoeda concebido numa base «tudo incluído». O indicador analisa o mercado de forma independente e fornece sinais sobre quando abrir e encerrar posições. Utiliza ordens Stop Loss e Take Profit. O rácio R:R é de 1:1. De vez em quando, faço pessoalmente operações com base nos sinais deste sistema, e eis os resultados que obtenho — SINAL EM TEMPO REAL Este sistema pode enviar notificações push para o seu smartphone, para que possa realizar transaç
Divergence Bomber
Ihor Otkydach
4.89 (94)
De vez em quando, faço transações pessoalmente com este sistema. Avalia a minha estratégia de trading manual «BOMBER» numa conta real - LIVE SIGNAL Cada comprador deste indicador recebe adicionalmente, e de forma gratuita: A ferramenta exclusiva "Bomber Utility", que acompanha automaticamente cada operação, define os níveis de Stop Loss e Take Profit e fecha operações de acordo com as regras da estratégia; Arquivos de configuração (set files) para ajustar o indicador em diferentes ativos; Set f
A lenda está de volta: Entry Points Pro 10. O relançamento do lendário indicador que se manteve por 3 anos no Top-3 do MQL5 Market. Centenas de avaliações entusiasmadas (589 nas duas versões), milhares de traders operam com ele todos os dias, 31.000+ downloads da versão demo   MT4+MT5 . Li cada avaliação de vocês ao longo de cinco anos — e, em vez de promessas, coloquei as respostas dentro da versão 10. Do autor que está no mercado desde 1999 e valoriza a honestidade, a própria reputação e os se
Azimuth Pro
Ottaviano De Cicco
5 (7)
Azimuth Pro V2: Estrutura Fractal Sintética e Entradas Confirmadas para MT5 Visão geral Azimuth Pro é um indicador de estrutura swing multinível da Merkava Labs . Quatro camadas de swing aninhadas, VWAP ancorado em swings, detecção de padrões ABC, filtragem estrutural de três timeframes e entradas confirmadas em barra fechada — um gráfico, um fluxo de trabalho dos micro-swings aos macro-ciclos. Este não é um produto de sinais cegos. É um fluxo de trabalho baseado em estrutura para traders que v
Advanced Supply Demand MT5
Bernhard Schweigert
4.53 (15)
Atualmente com 33% de desconto! A melhor solução para qualquer Trader Novato ou especialista! Este indicador é uma ferramenta de negociação exclusiva, de alta qualidade e acessível porque incorporamos uma série de recursos proprietários e uma nova fórmula. Com esta atualização, você poderá mostrar fusos horários duplos. Você não só será capaz de mostrar um TF mais alto, mas também mostrar ambos, o TF do gráfico, MAIS o TF mais alto: MOSTRANDO ZONAS ANINHADAS. Todos os traders de Oferta e Demanda
O UZFX {SSS} Scalping Smart Signals v5.0 MT5 é um indicador de negociação de alto desempenho, sem repintura, concebido para scalpers, day traders e swing traders que exigem sinais precisos e em tempo real em mercados em rápida evolução. Desenvolvido pela (UZFX-LABS), este indicador combina a análise da ação do preço, a confirmação de tendências e a filtragem inteligente para gerar sinais de compra e venda de alta probabilidade, sinais de alerta e oportunidades de continuação de tendências em tod
TrendMaestro5
Stefano Frisetti
note: this indicator is for METATRADER4, if you want the version for METATRADER5 this is the link:  https://www.mql5.com/it/market/product/108106 TRENDMAESTRO ver 2.5 TRENDMAESTRO recognizes a new TREND from the start, he never makes mistakes. The certainty of identifying a new TREND is priceless. DESCRIPTION TRENDMAESTRO identifies a new TREND in the bud, this indicator examines the volatility, volumes and momentum to identify the moment in which there is an explosion of one or more of these da
Smart Market Structure Toolkit
Garry James Goodchild
5 (1)
Smart Market Structure Pro by G-Labs — ICT and Smart Money Concepts toolkit with built-in multi-symbol scanner for MetaTrader 5. Break of structure, change of character, order blocks, fair value gaps, liquidity sweeps, premium and discount zones, ICT sessions, confluence scoring, AI trade ideas, and a traffic-light scanner across up to 30 pairs and four timeframes from one chart. Map SMC and ICT on the active chart while the built-in scanner monitors your full watchlist. Each cell shows BUY, S
O   SR Liquidity   é um indicador de trading projetado para revelar as zonas ocultas onde a liquidez do mercado se concentra e o preço reage com maior intensidade. Essas áreas específicas de liquidez funcionam como níveis poderosos de suporte e resistência, oferecendo um mapa claro de onde é mais provável que o mercado reverta. Em vez de traçar linhas comuns de Suporte e Resistência, o SR Liquidity analisa o comportamento real dos preços para detectar as zonas onde se acumulam pressões de compra
Currency Strength Wizard   é um indicador muito poderoso que fornece uma solução completa para uma negociação bem-sucedida. O indicador calcula o poder deste ou daquele par forex usando os dados de todas as moedas em vários intervalos de tempo. Esses dados são representados em uma forma de índice de moeda fácil de usar e linhas de energia de moeda que você pode usar para ver o poder desta ou daquela moeda. Tudo o que você precisa é anexar o indicador ao gráfico que deseja negociar e o indicador
M1 Quantum MT5
Hamed Dehgani
4.27 (11)
Sinais de Trading ao Vivo usando o M1 Quantum: Sinal   (Operação executada automaticamente pelo Quantum Trade Assistant , incluído gratuitamente neste produto.) Últimas Notícias : A versão 1.64 foi lançada. Agora, todas as operações têm um Stop Loss colocado atrás das zonas relevantes de Suporte/Resistência. A função Smart Close também foi aprimorada para aumentar o desempenho do EA nesta versão. Desde 9 de agosto, o sinal ao vivo está sendo executado na versão 1.64. Plano de Preços: Preço Atua
Grabber System MT5
Ihor Otkydach
4.83 (24)
Apresento a você um excelente indicador técnico: Grabber, que funciona como uma estratégia de trading “tudo incluído”, pronta para usar. Em um único código estão integradas ferramentas poderosas de análise técnica de mercado, sinais de entrada (setas), funções de alertas e notificações push. Cada comprador deste indicador também recebe gratuitamente: Utilitário Grabber: ferramenta para gerenciamento automático de ordens abertas Vídeo tutorial passo a passo: como instalar, configurar e operar com
PZ Swing Trading MT5
PZ TRADING SLU
5 (5)
Swing Trading é o primeiro indicador projetado para detectar oscilações na direção da tendência e possíveis oscilações de reversão. Ele usa a abordagem de negociação de linha de base, amplamente descrita na literatura de negociação. O indicador estuda vários vetores de preço e tempo para rastrear a direção da tendência agregada e detecta situações nas quais o mercado está sobrevendido ou sobrecomprado em excesso e pronto para corrigir. [ Guia de instalação | Guia de atualização | Solução de prob
Boom & Crash & PainX & GainX Ultimate Spike Detector Trade Spikes With Confidence — Not Guesswork Catching spikes should be one of the most profitable strategies in synthetic markets. But for most traders, it becomes one of the most frustrating. You enter too early… price goes against you. You wait for a spike… it never comes. You finally catch one… but don’t know whether to hold or close. You make profit… then give it all back because there’s no exit plan. This is exactly the problem the Ultim
This indicator has a unique support and resistance calculation program, which is a unique trading system. Index characteristics Imagine if you can accurately determine the important trading support and resistance areas and points in advance, how will your trading improve? Based on a unique calculation method, the indicator analyzes the trend, analyzes the current support and resistance, and obtains the current important support resistance and single direction, the calculated stop profit and sto
Gartley Hunter Multi
Siarhei Vashchylka
5 (12)
Gartley Hunter Multi - An indicator for searching for harmonic patterns simultaneously on dozens of trading instruments and on all possible timeframes. Manual (Be sure to read before purchasing) | Version for MT4 Advantages 1. Patterns: Gartley, Butterfly, Shark, Crab. Bat, Alternate Bat, Deep Crab, Cypher 2. Simultaneous search for patterns on dozens of trading instruments and on all possible timeframes 3. Search for patterns of all possible sizes. From the smallest to the largest 4. All fou
Weltrade Spike Sentinel
Batsirayi L Marango
5 (1)
Introducing Indicator for PainX and GainX Indices Traders on Weltrade Get ready to experience the power of trading with our indicator, specifically designed for Weltrade   broker's PainX and GainX Indices.  Advanced Strategies for Unbeatable Insights Our indicator employs sophisticated strategies to analyze market trends, pinpointing optimal entry and exit points.  Optimized for Maximum Performance To ensure optimal results, our indicator is carefully calibrated for 5-minute timeframe charts on
RealTime Swing Sentinel — Non-Repainting Major Trend & Swing Reversal Indicator for MT5 If you've ever watched an arrow appear on your chart, only to realize the "signal" it's showing you happened four or five candles ago — this indicator was built to end that. RealTime Swing Sentinel is a zero-lag, non-repainting Heiken Ashi trend and swing confirmation system engineered for traders who need to know the instant a trend actually turns, not several bars after the fact. Why most swing/HA indicator
The Oracle Pro
Ottaviano De Cicco
5 (1)
The Oracle Pro: Motor de Viés Multi-Timeframe Sintético para MT5 ️ Oferta de Lançamento de Verão — Adquira o The Oracle Pro por USD 199 (primeiros compradores). O preço sobe com a tração; preço final USD 399. The Oracle Pro é um motor de viés multi-timeframe premium para MetaTrader 5, criado para traders exigentes e profissionais. Responde com disciplina a uma pergunta: qual é o viés direcional em cada timeframe agora, qual a sua força e quanto os timeframes concordam? Tudo é calculado apenas e
The SyntheticaFX Scalper Pro Indicator is a versatile and user-friendly tool designed to assist traders in identifying high-accuracy entry points across multiple timeframes and all currency pairs. This indicator provides clear visual signals on the chart, along with recommended Stop Loss (SL) and Take Profit (TP) levels, making it easier for traders to plan their trades with confidence. With its built-in dashboard, the SyntheticaFX Scalper Pro Indicator offers real-time trade statistics, helpin
Gem SIGNAL
Shengzu Zhong
5 (1)
GEM Signal Pro GEM Signal Pro é um indicador seguidor de tendência para MetaTrader 5, desenvolvido para traders que desejam sinais mais claros, setups mais estruturados e uma gestão de risco mais prática diretamente no gráfico. Em vez de mostrar apenas uma seta simples, o GEM Signal Pro ajuda a apresentar a ideia completa da operação de forma mais clara e fácil de entender. Quando as condições são confirmadas, o indicador pode mostrar o preço de entrada, o stop loss e os alvos de take profit no
SkyHammer Signal Pro Indicador profissional de sinais de tendência sem repaint, com níveis Entry, SL e TP bloqueados SkyHammer Signal Pro é um indicador estruturado de tendência e momentum, desenvolvido para traders que procuram sinais claros, fixos e verificáveis. Funciona melhor em timeframes baixos, como M1 e M5 . O indicador não tenta prever topos ou fundos do mercado. Em vez disso, ele aguarda estrutura de mercado confirmada, direção de tendência, força de momentum, volatilidade saudável e
KURAMA GOLD SIGNAL PRO (MT5) — Filtro de 7 camadas · TP/SL automático · Pontuação de qualidade · Salvamento do histórico de sinais | Sistema completo de trading para XAUUSD Sem repintura em tempo real. No instante em que um sinal aparece, a seta, a entrada, o TP e o SL ficam travados no lugar e nunca mais se movem. O que você opera é esse sinal em tempo real. E na v7.20, cada sinal realmente enviado é salvo automaticamente e restaurado com exatidão após reiniciar. BÔNUS PARA
Stargogs Spike Catcher
Lorenzo Edward Beukes
4.56 (9)
Stargogs Spike Catcher V4.0 This Indicator is Developed To milk the BOOM and CRASH indices . Now Also work on weltrade for PAIN and GAIN indices. Send me Message if you need any help with the indicator.  CHECK OUT THE STARGOGS SPIKE CATCHER EA/ROBOT V3: CLICK HERE ALSO CHECK OUT SECOND TO NONEFX SPIKE CATCHER:   CLICK HERE STARGOGS SPIKE CATCHER V4.0 WHATS NEW! Brand New Strategy. This is the Indicator you need for 2025. New Trend Filter to minimize losses and maximize profits. New Trendline th
PrimeScalping
Temirlan Kdyrkhan
PrimeScalping is a powerful trading companion designed to generate high-probability entry signals with dynamic TP/SL/DP levels based on volatility. Built-in performance tracking shows win/loss stats, PP1/PP2 hits, and success rates — all updated live. Key Features: Buy/Sell signals with adaptive volatility bands Real-time TP/SL/DP levels based on ATR Built-in MA Filter with optional ATR/StdDev volatility Performance stats panel (Success, Profit/Loss, PP1/PP2) Alerts via popup, sound, push, or e
Mais do autor
Smart Exit EA
Bugra Kaan Yildirim
Smart Exit EA — Ride the Trend, Skip the Chop Smart Exit EA follows a trend with an adaptive ATR trailing line and stays in the move until the trend really turns. It is built for two problems every trend trader knows: getting shaken out of a good trade too early, and getting chopped up in a sideways market. Release notes, chart examples and new product announcements are posted on the TrendTower channel:   https://www.mql5.com/en/channels/trendtower What It Does Rides trends longer.   The trailin
FREE
Refine OBV
Bugra Kaan Yildirim
Refine OBV  Refine OBV measures cumulative volume flow read against its own adaptive signal line with a color-coded spread and non-repainting divergence detection. Raw On Balance Volume answers one question: is volume being credited to the buyers or the sellers? While useful, raw OBV is a single wandering line with no reference point. Refine OBV adds an adaptive EMA of the flow itself as a reference line. The distance between the flow and its signal line (the spread) is rendered as a color-coded
FREE
Smart Chandelier Exit
Bugra Kaan Yildirim
5 (3)
Smart Chandelier Exit Smart Chandelier Exit is an adaptive trailing-stop and trend-direction indicator. It plots a multi-layer ratchet stop line that follows price: green below price in an uptrend, red above price in a downtrend. The line only ever ratchets in the trend's favor, never against it, so it doubles as a mechanical trailing stop and a clear trend-state signal. What makes it smart is the built-in Pearson R trend-quality filter. A raw stop line tells you where the stop is; the Pearson R
FREE
Trix Trend
Bugra Kaan Yildirim
Trix Trend algoteknik · MetaTrader 5 Indicator Manual Overview Trix Trend is a momentum oscillator based on TRIX — the rate of change of a triple-smoothed exponential moving average of price. Triple smoothing removes most of the short-term noise, so the oscillator reacts to the underlying momentum of the move rather than to every small wiggle, while staying more responsive than a simple long moving average. The indicator draws a slope-colored TRIX line, a weighted signal line, a zero line, and t
FREE
SVS Assistant
Bugra Kaan Yildirim
SVS Assistant SVS Assistant is the execution half of Smart Volatility Squeeze MT5. It carries out the orders you request from that indicator's 1-Click Trading Desk, applies your risk rules to them, and manages the resulting positions. It is published free of charge. Please read this before downloading: it does not analyse the market and it produces no signals of its own. Without the Smart Volatility Squeeze indicator running on the same chart there is nothing for it to listen to, and it will do
FREE
Smart Volatility Squeeze MT5 Smart Volatility Squeeze MT5 is a volatility compression and momentum expansion indicator for MetaTrader 5. It builds on John Carter's Volatility Squeeze framework and extends the usual single-tier squeeze into three compression tiers, so you can see not only whether the market is compressed but how tightly it is compressed before it expands. The indicator opens in a separate window and draws two elements: a linear regression momentum histogram and a row of coloured
Quant Desk Pro
Bugra Kaan Yildirim
Quant Desk Pro An R-native trade manager for MetaTrader 5.   It manages the trades you have already opened: it measures what each one is really risking, protects it, scales out of it on a plan you set, trails what is left, and stops the whole book when the day has gone far enough wrong. Read this first.   Quant Desk Pro does not open trades and has no signal. And it ships in   VIEW ONLY : it will not send a single order until you set   I understand the risks   to true in the inputs. Until you do
Filtro:
Sem comentários
Responder ao comentário