Visual Heatmap Book Analyzer

Visual Heatmap Book Analyser


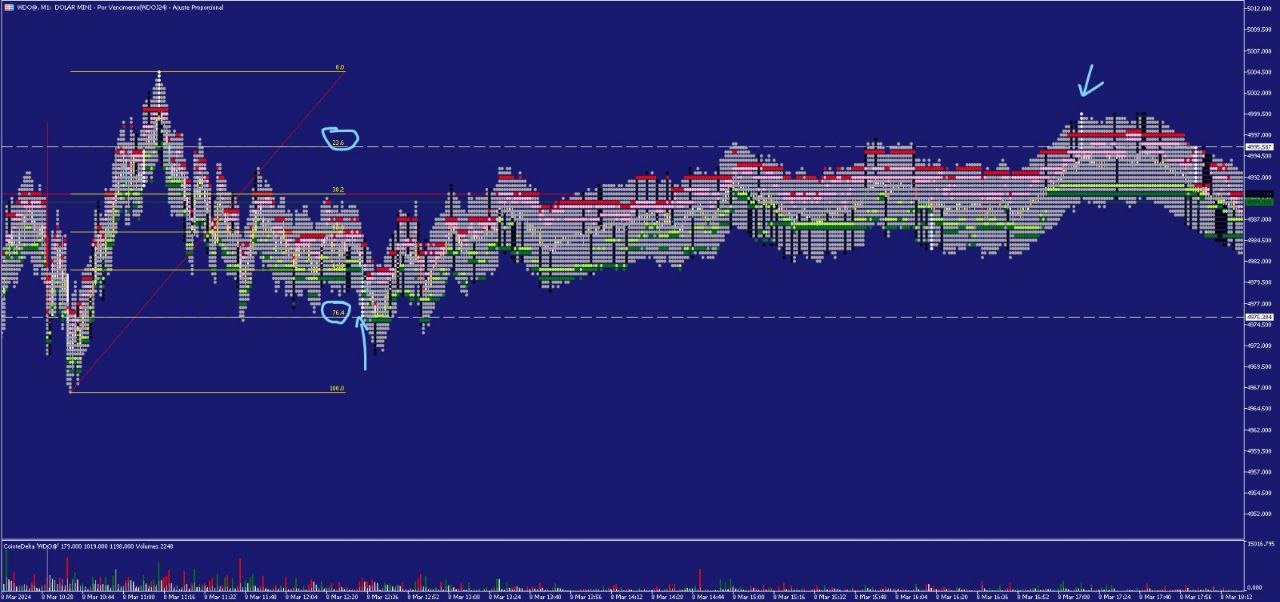
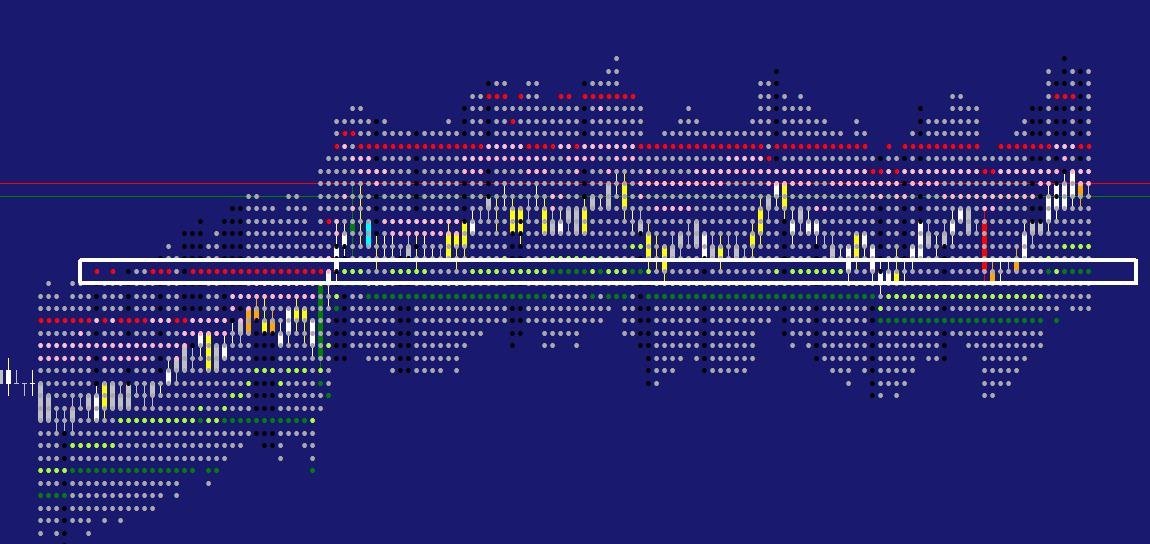
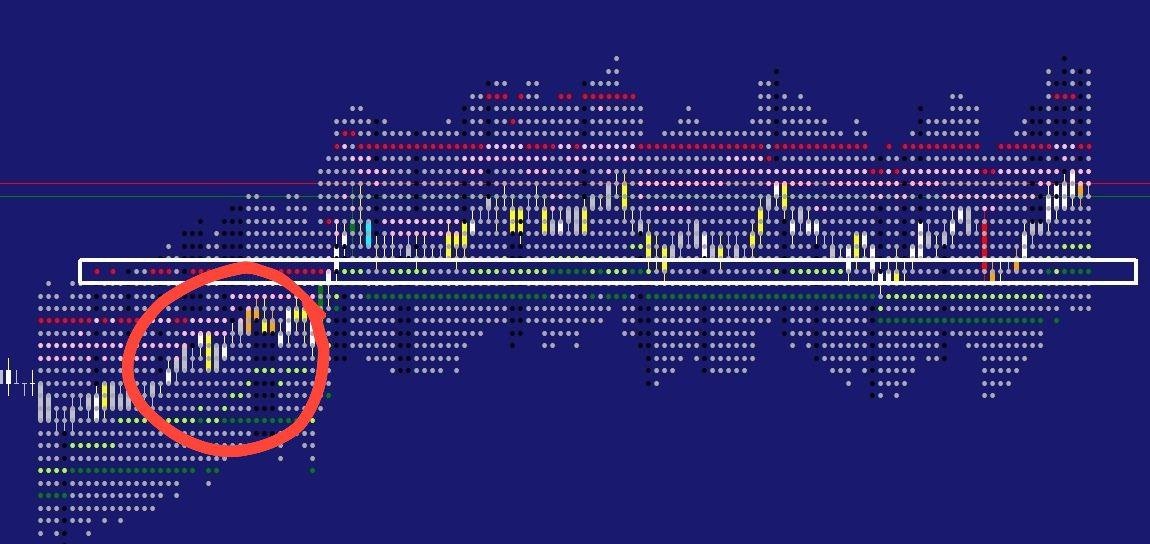
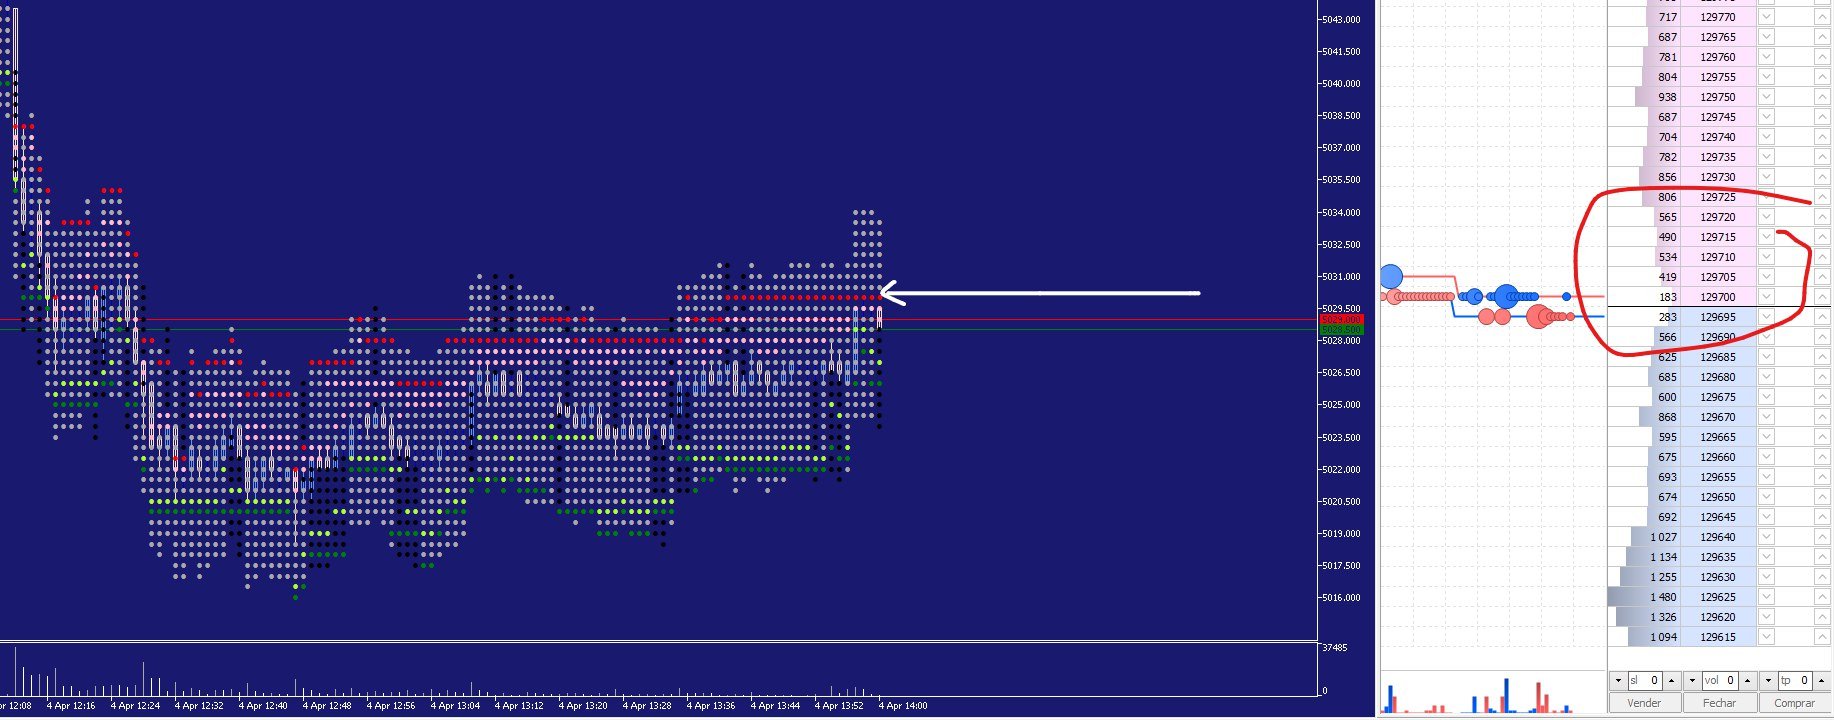
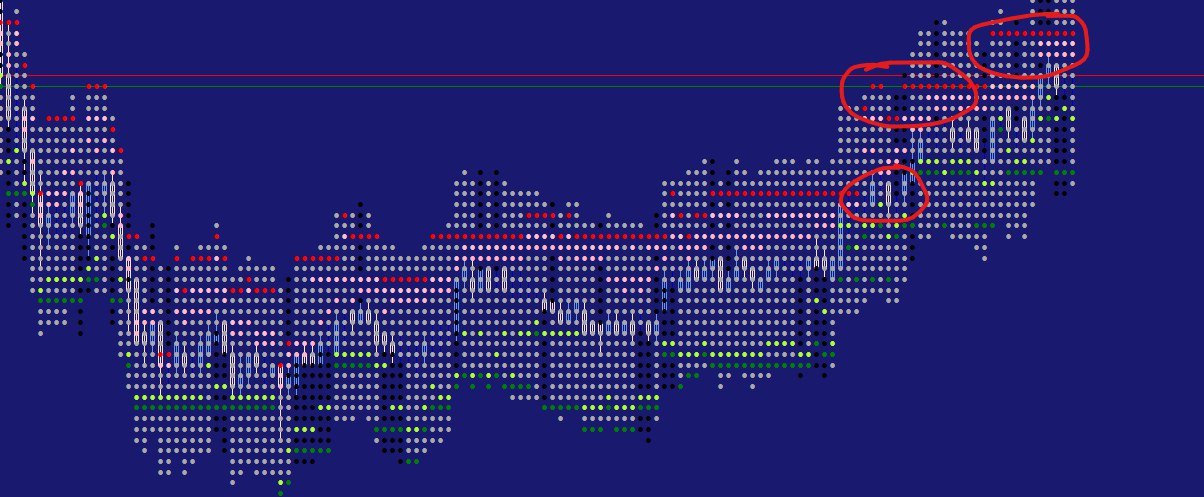
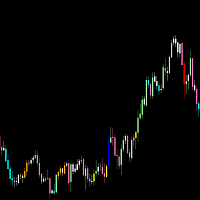
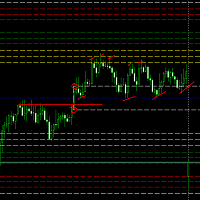
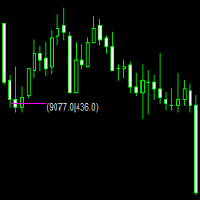
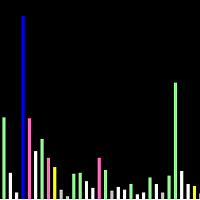
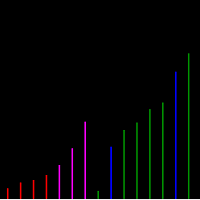
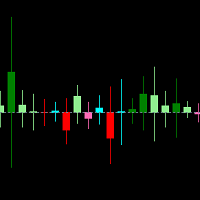
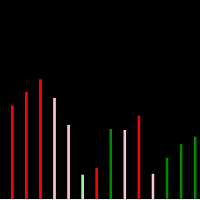
This indicator monitors the market liquidity and generates colors based on order patterns, quantities, and renewal activities in the book. This allows you to visualize the order flow and identify areas of high and low liquidity and activity.

The indicator uses machine learning techniques to analyze the order behavior in the book, enabling it to detect patterns and trends in orders, allowing you to make informed decisions about your trading operations.

The color palette of the indicator is generated from real-time market order flow. This enables you to quickly identify areas of high and low liquidity and activity, making data-driven decisions.

Identify Areas of High and Low Liquidity:

With this indicator, you can rapidly identify areas with high liquidity, where orders are easier to execute, and areas with low liquidity, where orders may be more challenging to realize.

Identify Areas of High and Low Activity:

The indicator also enables you to quickly identify areas with high activity, which may indicate some type of dispute between market players, making it a prime candidate for testing.

Make Data-Driven Decisions:

The indicator provides precise information about the order flow in the market, enabling you to make informed decisions about your trading operations.

Stay Ahead of the Game:

With this indicator, you can monitor the market liquidity in real-time and react quickly to changes in patterns of liquidity.

Color Correlation:

Here's the correlation between colors and market liquidity and activity:

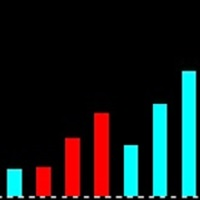
  • White: Maximum liquidity, many orders in the book.
  • Light Gray: High liquidity, large number of orders in the book.
  • Dark Gray: Medium liquidity, reasonable number of orders in the book.
  • Gray: Low liquidity, few orders in the book.
  • Black: Minimum liquidity, only one or a few orders in the book.
  • Red: High demand for an asset, indicating low liquidity.
  • Green: High supply for an asset, indicating high liquidity.
  • Light Yellow: Minimum liquidity and many orders in the book.
  • Yellow: Medium liquidity and moderate number of orders in the book.
  • Pink: Low liquidity and few orders in the book.
  • Light Pink: Maximum liquidity and many orders in the book.
  • Green-Yellow: Medium liquidity and reasonable number of orders in the book.

See the real market structure, predict your trades with information on what may happen, not based on what has already happened.


IMPORTANT: for the correct functioning of the indicator it is MANDATORY to have access to the depth of the market.

Test demo account

Discussão sobre o indicador

推荐产品
Heiken Ashi Stacked Pro is a chart overlay indicator that combines smooth Heiken Ashi visual trend candles, a real-time bar completion timer, and an on-hover crosshair HUD for instant price and wick-to-body ratio diagnostics. Marketplace Description Overview Heiken Ashi Stacked Pro upgrades standard Heiken Ashi candle visuals with an interactive HUD. Designed for trend followers and price action traders, it filters out market noise using colored candles while supplying precise candle metric read
Delta Profile Volume
Teresinha Moraes Correia
指标技术说明 – Delta Profile for MetaTrader 5 Delta Profile 是为 MetaTrader 5 开发的一款指标,用于在指定的 K 线区间内对成交量流进行详细分析。它能够在不同的价格水平上对正向成交量(与上涨相关)和负向成交量(与下跌相关)的不平衡进行结构化和可视化展示。最终,用户可以清晰地识别图表中成交最为集中的区域,以及真实的市场不平衡形成的位置。 以下是该指标的主要技术特征与参数说明。 核心概念 指标会识别 价格水平 ,并将其分类为正向成交量、负向成交量,以及净 Delta(正负成交量的差值)。 每个价格水平会在图表中以 水平条形 显示,帮助用户直观观察市场活跃区和不平衡区域。 用户可自由控制 分析的 K 线数量 、 价格精度(小数位数) 、 显示的最大水平数量 以及 可视化样式 。 主要功能 价格水平映射 :根据设定的精度对价格进行四舍五入,并累计对应 K 线的成交量。 净 Delta 计算 :显示正负成交量的差值,提供每个价格区间的客观数值。 最强 Delta 水平突出显示 :自动识别 Delta 绝对值最大的价格水平,并用特殊颜色标
Advanced Volume Profile
Henry Armando Baltazar
Advanced Volume Profile Liquidity Analysis via Custom Area Selection The Advanced Manual Volume Profile is a precision tool for MetaTrader 5 designed to deconstruct market structure through price-level volume analysis. Unlike static profiles, this indicator exclusively processes the price and time range defined by the user via a rectangle object, offering a surgical view of the market auction. Elite Technical Specifications Dynamic Algorithm: Real-time calculation (400ms refresh rate) based on t
FREE
SMC Alpha Engine
Chinthala Baji
SMC Alpha Engine SMC Alpha Engine is a Smart Money Concepts indicator for MetaTrader 5 designed to identify Order Blocks, Fair Value Gaps, Liquidity Sweeps, and market structure changes directly on the chart. The indicator focuses on displaying the most recent valid Order Block together with automatically calculated TP and SL levels for simplified chart analysis. Main Features Automatic Order Block detection Buy and Sell zone visualization Automatic TP and SL calculation Fair Value Gap (FVG) det
Candlestick Pattern Teller
Flavio Javier Jarabeck
5 (1)
Minions Labs' Candlestick Pattern Teller It shows on your chart the names of the famous Candlesticks Patterns formations as soon as they are created and confirmed. No repainting. That way beginners and also professional traders who have difficulties in visually identifying candlestick patterns will have their analysis in a much easier format. Did you know that in general there are 3 types of individuals: Visual, Auditory, and Kinesthetic? Don't be ashamed if you cannot easily recognize Candlesti
WAPV Weis Wave Chart Forex
Eduardo Da Costa Custodio Santos
The Weis Wave Chart Forex for MT5 is a Price and Volume indicator. The Price and Volume reading was widely disseminated through Richard Demille Wyckoff based on the three laws created by him: Supply and Demand, Cause and Effect and Effort vs. Result. In 1900 R.Wyckoff already used the wave chart in his analyses. Many years later, around 1990, David Weis Automated R. Wyckoff's wave chart and today we bring you the evolution of David Weis' wave chart. It shows the amount of Volume and the amount o
A Média Móvel é um indicador que faz parte da Análise Técnica. Com ela, é possível identificar o equilíbrio dos preços no mercado, observando tendências de alta, neutra ou baixa. Este indicador customizado traz opções extras pera definir o método de cálculo podendo-se esclolher entre SMA,EMA,SSMA,LWMA,JJMA,JurX,ParMA,T3,Vidya,AMA,HULL MA. Também conta com varias opções para escolher o método de cálculo para o preço base a ser usado no cáculo da média.
Sinal IFR
Aurenice Barros De Abreu Carvalho
Sinal com base no indicador RSI, que indica compra marcando com uma seta verde quando o preco sai da região de sobrevendido, e sinaliza venda quando o preco sai da regiao de sobrecomprado. A sinalizacão é  feita com uma seta verde para compra e seta rosa para venda. Permite configurar o nível de sobrecompra e de sobrevenda, além do período do RSI. Funciona em qualquer período gráfico.
Clock Et Mt5
Andrew Tsujiguchi
在图表上显示简洁的美国东部时间(ET)时钟,自动与美股交易时间同步。每秒更新。 Full description: ClockET — 轻量级指标,直接在图表上显示当前的美国东部时间(ET)日期和时间,让您始终准确掌握美股交易时段的进度 — 无需手动计算时区。 图表显示内容 • 实时时钟 — 显示星期、月份、日期和ET时间,每秒更新(例如 "Thu Jul 24  07:36:45 ET") • 居中标签 — 显示在图表底部,图表调整大小时自动重新居中 • 自动夏令时检测 — 根据美国官方夏令时规则(3月第二个星期日至11月第一个星期日)自动在EDT(UTC-4)和EST(UTC-5)之间切换 — 无需每年手动调整两次 设置 • 字体大小、字体颜色、字体名称 — 自定义时钟外观 • Y轴偏移 — 距图表底部的垂直位置 • Auto DST — 启用/禁用自动EDT/EST检测 • 手动ET偏移 — 可选的固定UTC偏移量,仅在禁用Auto DST时使用 支持平台 • MetaTrader 5 (ClockET.mq5) • MetaTrader 4 (ClockET.m
FREE
NHK Local Time Scale NHK Local Time Scale displays your PC/local time directly on the MT5 chart , alongside the broker's native chart time. The trader can easily compare both time zones for any candle. Benefits for Traders: Quickly convert Broker Time ↔ Local/PC Time . Helps accurately set News Stop/News Filter times. Makes London, New York, Asian and other trading sessions easier to identify in your local time. Helps verify that EA session and news time settings are correct. Reduces mistakes ca
FREE
Phantom Edge SMC
Nattapon Chuekamhod
Phantom Edge SMC — The Ultimate Smart Money Indicator for MT5 Tired of manually drawing structures while trading SMC or ICT concepts? Let Phantom Edge SMC do the heavy lifting for you. Key Features Internal & Swing Structure: Automatically detects BOS and CHoCH across two structural levels. Order Blocks (OB): Identifies Internal and Swing OBs with automated mitigation tracking. Equal Highs / Lows: Highlights EQH / EQL to pinpoint Liquidity pools. Fair Value Gaps (FVG): Displays FVGs with
WAPV Box Effort x Result
Eduardo Da Costa Custodio Santos
WA_PV_BOX_EFFORT X MT5 的结果 WAPV Box Effort x Result Indicator 是 Package Indicators 组(Wyckoff Academy Wave Market)的一部分。 MT5 的 WAPV Box Effort x Result Indicator 可帮助您阅读价格和交易量。它的阅读包括协助识别努力x结果 在图表创建的波浪中。 当方框为绿色时,MT5 的 WAPV Box Effort x Result Indicator 表示交易量有利于需求,而当方框为红色时 量有利于供应。 方框越大,成交量相对于价格的位移越大。如果价格的上升波与 Box 的大小不成比例,则 努力x结果。 以一种非常直观的方式,我们可以识别出数量和价格之间的这种差异。 MT5 的 WAPV Box Effort x Result Indicator 还允许您通过将指标置于零轴下方来改善可视化。 以即时交易量和实际交易量在市场上运作 看图片:
Angus Orderflow Heatmap
Mr Monthon Chaipreechapat
Volume Footprint & Heatmap Indicator This indicator combines Volume Footprint and Heatmap visualization, inspired by the Order Flow and Heatmap concepts found in Bookmap. Unlike futures markets, the Forex market does not provide real exchange-traded volume data. Instead, it only offers Tick Volume . This indicator is designed to simulate Bookmap-style market visualization as closely as possible using the available Tick Volume data. Because the indicator relies on Tick Volume, the quality and acc
Transaction Speed MT5
Ivan Stefanov
5 (4)
当然,以下是翻译成中文(简体)的版本: 该指标标出市场中显现出 交易兴趣 的区域,并随后显示 订单积累区域 。它的工作方式类似于大规模的订单簿。 这是为 大资金 打造的指标,性能卓越。市场中有任何兴趣,你都能通过它清晰看到。 (这是一个 完全重写的自动化版本 —— 不再需要手动分析。) 交易速度 是一个全新的概念指标,它显示了市场上大订单 何时 、 何地 聚集,并揭示了其背后的意义。它可以在 非常早期 就检测到趋势的变化。 在外汇市场,所谓的“交易量”实际上是误导性的,因为那指的是价格在单位时间内的变化,因此真正的名称应是“交易速度”。 一切都取决于我们如何思考、如何行动、如何分析。 改变分析范式至关重要。 该指标完全重构了外汇市场上“交易量”的概念,用逻辑方式重新定义并应用,从而成为一个 独特而精准的工具 。 使用方法: 默认情况下,指标处于 自动模式 ,可独立用于任何时间周期。如果你希望切换到手动模式,只需点击 Auto / Manual Mode 按钮即可。 在 手动模式 下,所有计算从 2025年1月1日 开始。你可以根据需要更改该日期,以查看不同的分析结果。 最优数据周期
Value Chart Candlesticks
Flavio Javier Jarabeck
4.57 (14)
The idea of a Value Chart indicator was presented in the very good book I read back in 2020 , " Dynamic Trading Indicators: Winning with Value Charts and Price Action Profile ", from the authors Mark Helweg and David Stendahl. The idea is simple and the result is pure genius: Present candlestick Price analysis in a detrended way! HOW TO READ THIS INDICATOR Look for Overbought and Oversold levels. Of course, you will need to test the settings a lot to find the "correct" one for your approach. It
FREE
The indicator enables very quick orientation in the market phase (re/accumulation, re/distribution, up/down trend). It is counted only from price data (without volume). It is based on the assumptions of Wyckoff's law of Causa and Effect. Oscillations are an expression of the level of market uncertainty and point to the presence of Big Money. Such a "storm" is followed by a calmer trend that needs to be exited. You need to use other tools or shorter period of the same indicator for that. I keep t
Shadow mentor analyser
Nadir Ally Abdallah
GOLD TRADERS, DO YOU SEE THIS?  this is  a non-trading XAUUSD analyser   Why is this important? The EA helps you see what most traders miss — traps, order blocks, FVG, and liquidity sweeps. You get institutional-grade signals without manual analysis. Works on ANYThis is NOT a trading EA — it's an INDICATOR that detects: FVG Bull (Open) with age tracking SSL Taken (Liquidity Sweep) TRAP — Stop Hunt Low/High Fake Bear BOS Inducement of FVG Bullish BOS It gives you bias,
Mano de Midas
Job Israel Vargas Sarabia
MANO DE MIDAS   is a MetaTrader 5 Expert Advisor developed by   Egyptian Eye Trading / JV Trader , built to automate trade execution and management with a proprietary risk-control system, configurable market filters, and a full real-time results panel. Key features: Direction filter: trade Buy-only, Sell-only, or Both directions. Optional trend filter based on a moving average (Simple, Exponential, Smoothed or Linear Weighted), with a timeframe selectable independently from the chart the EA runs
Session Flow Board A session scoreboard for XAUUSD and NAS100. One glance tells you who has been leaning on the session: buyers, sellers, or neither. It splits session tick volume into a buy proxy and a sell proxy from where each bar closed inside its range. Close near the high, the bar counts more as buy. Close near the low, more as sell. That running difference is the session CVD. What you see Session buy and session sell Session CVD and the last closed bar's delta Tilt, in percent POC, VAH an
Accumulated Aggression
Edson Cavalca Junior
The indicator measures the accumulated balance of aggression. The formula is as follows:  Accumulated   = Previous Candle Accumulated + Purchase Volume - Sales Volume. Know our products    *** Did you like the product? Then, help us doing review in the " Reviews " tab. The indicator sends information to your email or cell phone when the accumulated balance changes direction. Example : Accumulated seller becomes a buyer. Note : It is recommended to use the default configuration and VPS valu
CMF Scalping Indicator
Thiago Pereira Pinho
动态 CMF 计算: 自定义 蔡金资金流 (Chaikin Money Flow, CMF) 的周期,以微调您的分析并最大化信号精度。  直观的颜色编码警报: 通过清晰的视觉提示,即时解读市场状况:  绿色警报: 表示处于 超买 区域 – 预示着潜在的卖出机会。  红色警报: 表示处于 超卖 区域 – 暗示着潜在的买入机会。  灰色警报: 代表 中性 区域 – 信号是等待确认的趋势或反转。 自动背离检测: 轻松揭示隐藏的市场转折点。我们的系统 自动发现 价格和动量之间的 背离 ,帮助您预测重要的反转。  整合真实成交量: 通过切换到 真实成交量选项 来增强信号准确性,确保您的交易决策基于最可靠的市场数据。 --------------------------------------
FREE
ModGod Trend Scalp Pullback
Egon Henrique Portolani
ModGod Scalp Pullback - Precision Trend & Reversion Engine LAUNCH PROMOTION: Only $49 for the first 10 copies! The official price will be $490. Buy before the price goes up! The   ModGod Scalp Pullback   is an advanced, all-in-one indicator designed for professional scalpers and day traders. It combines the extreme smoothness of Triangular Moving Averages (TMA) with Heikin-Ashi trend filtering to provide highly accurate pullback entries and extreme exhaustion reversals. By mapping the natu
In the high-stakes arena of Gold trading, where volatility can be both a weapon and a wound, the Gold Titan Anti-Martingale Alpha Manager stands as a beacon of mathematical discipline and institutional-grade logic. Most retail algorithms fall into the trap of Martingale "gambling"—doubling down on losing trades and praying for a retracement—but Gold Titan flips the script by employing a professional "Pyramiding" strategy. It targets the 1-Hour timeframe (H1) to filter out market noise, utilizing
Master HMA
Leonel Alberto Jose Quintana
MetaTrader 5 的 Master HMA Master HMA 是一款适用于 MetaTrader 5 的技术指标,将不同的 Hull Moving Average 计算方式结合到一个可视化结构中,用于分析价格的方向、斜率以及运动行为。 该指标使用三个 HMA 周期:Fast、Main 和 Slow。这些线之间的关系可以帮助观察市场运动结构的变化,并跟踪不同的市场阶段。 Main HMA 使用不同颜色表示系统识别出的状态。指标还可以显示由 Fast 和 Slow HMA 之间关系形成的云带。 结构分析 Master HMA 分析移动平均线行为的不同特征,包括斜率、HMA 之间的距离、压缩、扩张、加速、力量减弱以及云带宽度的变化。 这些信息经过综合分析后,用于形成当前市场运动结构的可视化读数。 Master Score 该指标包含一个名为 Master Score 的内部系统,其计算范围为 -100 至 +100。 计算会考虑 HMA 结构的不同组成部分,包括趋势、斜率、均线之间的关系以及加速度。 Master Score 与 Master State 结合使用,将当前分析状态
Volume flow Profile
Israr Hussain Shah
大师版是一款专业级的分析工具,旨在通过成交量和资金流向的视角来可视化市场结构。与标准的成交量指标不同,该工具直接在图表上显示每日成交量分布,让您准确看到价格发现发生的位置以及“聪明钱”的定位。 此大师版专为清晰度和速度而设计,具有独特的自动主题同步系统,加载后即刻美化您的图表布局。 主要特点: 真实资金流向计算: 超越标准的跳动量。启用“Use Money Flow”时,成交量按价格加权,揭示了特定价格水平的实际资金投入。 价值区域 (VA) 可视化: 自动计算价值区域(默认为成交量的70%)。 VA填充: 为价值区域背景着色,以便即时识别控制区域。 关键水平: 清晰标记控制点 (POC)、价值区域高点 (VAH) 和价值区域低点 (VAL)。 专业标记系统: 扫描概况结构以识别关键交易区域: HVN (高成交量节点): 接受和盘整区域(支撑/阻力)。 LVN (低成交量节点): 拒绝区域或“快速通过”区域。 所有标记均向右绘制延长线,便于监控。 Delta 背离(左侧直方图): 左侧直方图可视化每个级别的买卖压力对比。这有助于识别隐藏的背离——即价格可能上涨,但卖家在这些水平上激进打
Reverse side scalper
Ekaterina Saltykova
Reverse side scalper is the manual trading system, that works on choppy(anti-trend) market. As a rule markets are on 80% choppy and only 20% is trend phase. System is based on custom step Moving and RSI and reverse pattern. System defines up movement, down movement, trend / choppy phases. Indicator plots Buy signal arrow when current direction is down and phase is trend, Sell signal arrow is plotted when currently is up movement and phase is trend. As a rule it allows to "catch" local maximum/mi
Aggression Volume Profile
Edson Cavalca Junior
4.55 (11)
This indicator plots the volume profile by Price on the chart There are 5 ways to view it: By Total Volume Traded (Premium Version); Volume Ticks(Forex) Separated by Buyers and Sellers (Premium Version); Buyers Only (Premium Version); Sellers Only (Premium Version); Business balance (Buyers - Sellers) (Premium Version); . It is possible to select how many days the profiles will be calculated.( Premium Version) On the current day it recalculates the histogram data for each new candlestick.
FREE
Easy VWAP
Luca Spinello
VWAP Indicator, the short form of Volume Weighted Average Price, is similar to a moving average but takes into consideration the tick volume of the candles. The indicator calculates the moving average multiplying the price of each candle for the tick volume in the candle. Said calculation weighs with more significance price where more transactions were made. Features: Visual styling customizable Period customizable Ease of use
FREE
Onyx FVG Pro
Thirawut Detbangoon
Onyx FVG Pro 基于市场结构与 Fair Value Gap (FVG) 的 MT5 智能交易系统 1. 市场结构检测引擎 (Market Structure Engine) 采用高级 Swing High/Low 逻辑,自动识别关键的市场结构转变,包括 CHoCH (结构转变) 和 BOS (结构突破) ,确保您的交易始终顺应主趋势。 2. 动态 FVG 自动检测 (含自动缓解功能) 根据可自定义的最小点数阈值,实时扫描并绘制高概率的 Fair Value Gap (失衡区) 区域。具备 智能自动缓解 (Auto-Mitigation) 功能,当区域被价格填补后会自动变为灰色,保持图表整洁。 3. 智能趋势过滤与信号引擎 严格过滤信号,仅允许进入与当前市场结构方向一致的 FVG 区域。自动计算并显示高精度的交易计划: 入场价 (Entry) 与 止损价 (SL) 位置 TP1 至 TP4 止盈目标(风险回报比从 1:1 到 1:4) 4. 纯黑极简仪表盘 (Pure-Black Dashboard) 在图表上直接显示直观的 HUD 仪表
FREE
Phoenix Delta Volume
Nigel Nii Darku Narnor Darko
5 (1)
This is the Phoenix Institutional SMC Dashboard (Emerald-Teal Edition). It is engineered to provide retail traders with the same "Volume-at-Price" clarity used by institutional desks. Below is a full breakdown of the benefits, the high-confluence logic for entries, and how to manage your trades using the current visual engine. Strategic Benefits to the User Sentiment over Price: Most indicators only look at where the price is. This dashboard tells you how much effort (Volume Delta) was required
FREE
该产品的买家也购买
Neuro Poseidon MT5
Daria Rezueva
4.75 (52)
Neuro Poseidon is a new indicator by Daria Rezueva. It combines precise trading signals with adaptive TP/SL levels - creating best possible trades as a result! Message me and get  Neuro Poseidon Assistant  as a gift to automize your trading process! What makes it stand out? 1. Proven profitability on all assets and timeframes 2. Only confirmed BUY and SELL signals present on the chart 3. Adaptive TP & SL levels generated by the software for each trade 4. Easy to understand - suitable for al
RelicusRoad Pro MT5
Relicus LLC
4.96 (25)
别再凭猜测做交易。 在同一张图表上看清何时入场、何时离场,以及市场的方向。 RelicusRoad Pro 将近二十种工具整合进一个指标,你可以只开启适合自己交易方式的那几项。 入场清晰。出场清晰。每张图表都有计划。 是不是很熟悉? 你刚买入,价格一分钟后就逆着你运行。 你出场太早,然后眼看着行情在你离场后继续走下去。 图表上有五个指标,给出五种不同的答案。 你的止损全凭猜测。 我们为何开发它 我们做外汇交易已有 18 年。RelicusRoad 背后的核心算法最初是在私下为我们自己的专业交易员圈子开发的。 初衷很个人。我们厌倦了一次次手工画同样的线,违反自己定下的规则,错过图表上真正重要的那一点。 对我们有效的是一致性:每天以同样的方式读图,直到它变成肌肉记忆。RelicusRoad Pro 把这种看盘方式带到你的图表上。 之后我们把它开放给更多交易员,因为一个小圈子能看到的东西有限。 每位交易员都会带来新的问题和想法,好的想法会进入下一次更新。今天其中很多工具之所以存在,是因为我们的交易员提出了需求。 这个社区保持私密且规模不大,同时活跃的交易员保持在 2,000 人以内。有些人使
您好,交易员! 大多数散户交易者依赖于滞后的网页脚本。真正具有交易优势需要机构化的架构。 Astro AI 指标并非标准的图表叠加层。它是一个编译后的神经网络,包含两个代理,直接运行在您的终端上。 以下是该系统背后的具体技术: 1. 代理 1:分析师(图神经网络 - GNN) 市场并非孤立的价格柱;它们是相互关联的数据网络。 功能:代理 1 使用图神经网络来映射这些复杂的非线性关系。 优势:标准指标仅考虑单一的历史移动平均线,而我们的 GNN 可以实时处理深层的市场结构关系,在散户交易量发挥作用之前揭示隐藏的相关性。 2. 代理 2:执行器(近端策略优化 - PPO) 模式识别只是成功的一半。基于当前市场波动做出正确的决策,才是预测模型与滞后模型之间的区别所在。 功能:代理 2 使用 PPO(一种先进的强化学习算法)来确定最佳入场点。 优势:它持续调整交易策略,而非使用静态的“超买”或“超卖”线。它会分析当前市场状况并计算最可能的成交点。 执行桥接:通过 ONNX 集成到交易终端 如果执行速度慢,模式识别就毫无用处。我们已通过 ONNX(开放神经网络交换平台)
Spike Fakeout Detector
Brighton Mufaro Mudzingwa
PainX 400 FAKEOUT DETECTOR MT5 Custom Indicator  ·  Sell-Side Bias  ·  Scalping  ·  RSI(6) Filtered   OVERVIEW   The Spike Fakeout Detector is a non repaint precision technical indicator built exclusively for Crash / PainX synthetic indices on the platform. It is engineered around one of the most consistent and exploitable patterns on this instrument — the false breakout above resistance followed by a sharp price drop. Crash/PainX is a growing index that produces a significant price drop app
Azimuth Pro
Ottaviano De Cicco
5 (7)
Azimuth Pro V2:MT5合成分形结构分析与确认入场 概述 Azimuth Pro 是 Merkava Labs 推出的多层级波段结构指标。四层嵌套波段层级、锚定波段的VWAP、ABC形态识别、三时间框架结构过滤以及收盘确认入场——一个图表,一个从微观波段到宏观周期的完整工作流程。 这不是盲目的信号产品。它是一个以结构为先的工作流程,专为重视位置、背景和时机的交易者打造。 ️ 夏季促销 — 庆祝夏至与 The Oracle Pro 上市:Azimuth Pro 七折优惠,现价 279 美元(原价 399 美元)。限时夏季优惠。 1. V2的变化 合成多时间框架引擎 高时间框架分析从零开始重建,采用与Meridian Pro相同的专有合成架构。更清晰的HTF背景、稳定的实时行为、无经典MTF同步问题。合成引擎还解锁了 固定比率时间框架级联 (x2、x3、x4、x6)——不再在经纪商的固定时间框架之间任意跳转,您可以按图表时间框架的固定倍数分析结构,在每个尺度上保持相同的分形关系。 确认入场箭头 作为稳定且可恢复的执行层而设计的收盘确认箭头。当ABC设置形成且自适应确认逻辑
UZFX {SSS} 超短线智能信号 v5.0 MT5 是一款无重绘的高性能交易指标,专为在快速波动的市场中需要精准、实时信号的超短线交易者、日内交易者和波段交易者设计。该指标由 (UZFX-LABS) 开发,融合了价格行为分析、趋势确认和智能过滤技术,可在所有货币对和时间周期内生成高概率的买卖信号、预警信号以及趋势延续机会。 别再对交易犹豫不决了,开始遵循这一专为追求清晰、精准和纪律性市场执行的交易者设计的结构化信号系统吧。 相信我,这是 MQL5 上最优秀的指标之一,所以千万不要错过!!“为睿智交易者打造的智能信号” 最新 5.0 版本现已发布,价格可能会在未事先通知的情况下上涨至 499.99 美元,所以请尽快入手,以免错失良机!! 最终购买前!如果您想获取免费试用版,请通过 WhatsApp 号码 +923030751987 联系我!! 如果您遇到任何问题“或”有任何不明白的地方,请在私聊中向我咨询!!! 主要功能更新 • 自动买入和卖出信号检测 • 先进的反转识别逻辑 • 潜在市场反转前的预警信号 • 趋势延续确认信号 • 内置风险管理功能,包含入场点、止损点、TP1、
Meravith Scanner
Ivan Stefanov
5 (3)
MERAVITH SCANNER 是一款适用于 MetaTrader 5 的专业金融市场指标,将多种分析工具整合为一个统一的系统。它基于专有的成交量加权平均价格(VWAP)方法自动完成所有计算,完全消除主观判断。 该指标适用于所有资产类别(外汇、股票、指数、大宗商品、加密货币)以及从 M1 到 Monthly 的所有时间周期。其核心原理是价格跟随成交量。MERAVITH 识别机构资金成交量的集中区域,并从该集中区域中推导出数学上精确的价格水平。它不预测,不推测。它只计算。 使用 MERAVITH SCANNER,您可以在 2–3 分钟内扫描全部 28 个主要外汇货币对的所有时间周期。您也可以扫描任何您选择的市场——例如,大约 100 只股票约需 10 分钟。 该指标计算耗尽水平、平衡线、偏差、统计水平以及目标投射。 图表元素 Origin Point 标记所有计算的起始位置。指标会自动将其放置在最佳位置。红色标签(TOP)表示市场高点并带有看跌倾向。绿色标签(BOTTOM)表示市场低点并带有看涨倾向。 Sentiment Line 是一条动态曲线,反映基于成交量加权计算得出的市场情绪。
Meravith MT5
Ivan Stefanov
5 (3)
MERAVITH 是一款适用于 MetaTrader 5 的多周期成交量与流动性指标,它在每一个时间周期上显示趋势、支撑与阻力区域、入场、目标和止损。它为您提供完整的市场流动性地图,一个对冲基金风格的流动性工具,并用专有的成交量加权平均价格方法自动完成全部计算,因此没有主观解读。 适用于外汇、黄金(XAUUSD)、指数和加密货币,适用于所有时间周期。 购买后赠送:一套关于如何用 MERAVITH 交易的视频课程。购买后请给我发消息。 MERAVITH 的功能 分析所有时间周期,并显示每个周期上正在生效的趋势。 标记流动性区域(Volume Equilibrium),即多头与空头成交量相等的位置。 将所有时间周期的流动性水平直接显示在您的图表上。 写出市场的文字分析供您参考。 根据当前趋势计算入场、目标、支撑位和止损。 计算您交易的风险回报比。 按您的账户余额计算仓位大小,并估算潜在利润。 在市场出现重要变化时提醒您:警报、电子邮件和推送到手机的通知。 主要线条 Bullish / Bearish Volume Exhaustion 线:目标位。 趋势线:随趋势改变颜色(多头或空头),显
IQ FX Gann Levels a precision trading indicator based on W.D. Gann’s square root methods . It plots real-time, non-repainting support and resistance levels to help traders confidently spot intraday and scalping opportunities with high accuracy. William Delbert Gann (W.D. Gann) was an exceptional market analyst, whose trading technique was based on a complex blend of mathematics, geometry, astrology, and ancient mathematics which proved to be extremely accurate. We don't offer free or bonus indic
This indicator automatically detects internal & swing market structure, Fibonacci Retracement and Fibo Levels. Features Full internal & swing market structure labeling in real-time Fibonacci Retracement Fibonacci Levels After purchasing the indicator, the full source code is provided, and via indicator buffers it can be easily integrated into your Expert Advisors (EAs) for automated trading strategies.
First time on MetaTrader, introducing IQ Star Lines, an original Vedic Astrology Based Intraday Trading Indicator. We don't offer free or bonus indicators in exchange of reviews from you. You won't need any free products with this indicator to make it work. ;) Enjoy! Welcome to the new and updated  IQ Star Lines , the ultimate fusion of ancient planetary cycles and modern quantitative trading, published for the first time on Metatrader. This is an indicator built by the developer, who has spent
Volume Arrow Signal Product Description Volume Arrow Signal is a smart trading indicator designed to help traders identify potential buy and sell opportunities using price action, volume behavior, and directional arrow signals. The indicator places clear arrows directly on the chart, making it easy to spot possible market reversals, trend continuations, and entry opportunities without spending hours analyzing charts manually. Whether you are trading Gold (XAUUSD) , Forex pairs, Indices, or Crypt
Gem SIGNAL
Shengzu Zhong
5 (1)
GEM Signal Pro GEM Signal Pro 是一款適用於 MetaTrader 5 的趨勢跟隨指標,專為希望在圖表上獲得更清晰訊號、更有結構的交易設定,以及更實用風險管理的交易者而設計。 它不僅僅顯示一個簡單的箭頭,GEM Signal Pro 還能以更清晰、更易讀的方式呈現完整的交易思路。當條件確認完成後,指標可在圖表上顯示進場價、止損價與止盈目標,幫助交易者更有效率地評估交易設定。 運作方式 該指標首先根據其內部邏輯識別有效的初始訊號。 當確認條件滿足後,GEM Signal Pro 會在圖表上顯示完整的交易設定。這讓交易者可以更清楚地看到交易結構,並減少手動分析與計算的工作量。 圖表上的交易價位 對於已確認的訊號,GEM Signal Pro 可顯示: 進場價 止損價 止盈 1 止盈 2 止盈 3 風險報酬比 這讓交易設定更容易理解,也有助於讓圖表分析更有條理。 內建風險管理 風險管理是此指標設計的重要部分。 止損位基於近期市場結構,結合附近的擺動高低點與可選的 ATR 緩衝距離。這能讓交易價位更貼近當前市場條件,而不只是依賴固定距離。 圖表資訊面板 GEM Si
ORB Seeker MT5
Marcela Goncalves De Oliveira
特价促销,限量供应,保持产品稀缺性! 仅售 599 美元! 购买后请联系我以获取奖励的 ORB Seeker EA 和个人优化设置文件。 自信地捕捉干净利落的比赛片段! ORB Seeker MT5 是一款专业的开盘区间突破 (ORB) 指标,专为追求准确性、简洁性、灵活性和清晰图表结构的交易者而设计。 它能自动绘制任何交易品种的盘前或自定义交易时段区间,然后给出清晰的突破信号,包括入场点、止损点、止盈点以及可选的50%部分止盈位。所有数据均实时计算并直接显示在图表上。 您可以选择交易伦敦开盘、纽约交易时段、亚洲交易时段,或者自定义交易时段。ORB Seeker MT5 会自动适应您选择的交易时段,让您精准掌握市场波动范围、突破位和交易位。 每次购买均免费赠送 ORB Seeker EA 智能交易系统。该 EA 系统读取指标的突破信号并可自动下单,您可以选择手动交易,也可以让 EA 系统根据指标的信号逻辑自动处理入场。   为什么选择 ORB Seeker MT5 支持多个交易时段 - 您可以自行设置伦敦、纽约、亚洲或自定义交易时段的盘前交易时间和交易时段。 完整的突破视觉效果 -
KenKem Master Volume Profiler - Brief Introduction A Display-only volume-profile cockpit for XAUUSD, BTCUSD and other liquid symbols. Draws profile structure, multi-timeframe flow, EMA trend and study-only setup markers. Places no orders. Not a signal service.  It maps where the market has actually traded and reads recent order flow, so you can see structure and lean at a glance.  What it shows: Master and local volume profiles (POC and value-area high/low) - the price shelves that matter. A liv
Presenting one-of-a-kind Gann Indicator for XAUUSD IQ Gold Gann Levels is a non-repainting, precision tool designed exclusively for XAUUSD intraday trading. It uses W.D. Gann’s square root method to plot real-time support and resistance levels, helping traders spot high-probability entries with confidence and clarity. William Delbert Gann (W.D. Gann) was an exceptional market analyst whose trading technique was based on a complex blend of mathematics, geometry, astrology, and ancient calculation
Navigator Equilibrium:在一个窗口中同时呈现市场阶段、动量、峰值与背离 不必再在动量震荡指标、趋势过滤器、波动率指标和背离扫描工具之间来回切换。Navigator Equilibrium 将它们整合到一个彩色编码的窗口中,让您一眼看出动量是在增强还是减弱、哪一方占主导、市场处于趋势还是盘整,以及价格与动量在哪里出现分歧。 它既适合希望清晰解读市场的主观交易者,也适合需要干净、有文档说明的缓冲区的 EA 开发者。 与众不同之处 五种状态的柱状图,而不仅仅是多或空。 除了方向之外,颜色还显示动量是在增强、在减弱,还是已经处于峰值状态。 零轴兼具市场状态指示器的作用。 它会变色,告诉您市场处于趋势还是盘整。 一眼看清“谁在主导”。 柱状图顶部的标记线会相对于慢速均线变色,同时提示何时可以考虑逆势交易。 峰值跟踪。 每个柱状图峰值都会与同侧的上一个峰值比较,让您看出动量是在扩张还是收缩。 自动识别四种背离: 常规与隐藏、看涨与看跌。它们以箭头绘制,并可附带文字;滚动或缩放图表时,文字与箭头之间始终保持固定的像素间距。 可切换的计算模式 ,包括柱状图、盘整检测和峰值检测,便于
一句话理解 这是一个 二合一的智能指示器 ——把 RSI 和 MACD 两位“专家”的意见打包成一个简单的结论:出现箭头,就行动;没有箭头,就等待。 而且箭头 不会重绘 ,收盘后是什么样,永远就是什么样。 它解决了什么问题 很多交易者同时看 RSI(判断动量和超买超卖)和 MACD(判断趋势方向),但两者经常给出矛盾信号。 这个指示器的做法是: 只有两人同时同意 ,才发出信号。这就过滤掉了大量假信号和模糊时段。 你实际看到的东西 独立的指示器窗口(不遮住 K 线图) 清晰的 买入箭头 和 卖出箭头 放大版的 MACD 柱状图(更容易看清动量变化) RSI 和 MACD 的线依然在,但你的注意力只需放在箭头上 谁适合用 新手 :不用学两个指标如何配合,跟着箭头做即可 老手 :节省时间,快速过滤噪音,且不重绘的特性让回测结果可信 所有讨厌信号闪烁的人 为什么它不重绘 因为它的判断逻辑基于 完整收盘后的价格数据 。信号只有在满足条件的那一刻才会固定下来,之后不会因为后续 K 线的变化而修改之前的箭头。 这意味着你可以放心做回测,也能在实盘中信任你看到的每一个信号。 底层特点(不复杂地说) 它
TrendMaestro5
Stefano Frisetti
note: this indicator is for METATRADER4, if you want the version for METATRADER5 this is the link:  https://www.mql5.com/it/market/product/108106 TRENDMAESTRO ver 2.5 TRENDMAESTRO recognizes a new TREND from the start, he never makes mistakes. The certainty of identifying a new TREND is priceless. DESCRIPTION TRENDMAESTRO identifies a new TREND in the bud, this indicator examines the volatility, volumes and momentum to identify the moment in which there is an explosion of one or more of these da
看清市场真正在做什么。   在您眼前实时观察三大市场阶段(收缩、扩张、趋势),并在趋势阶段的早期阶段抓住更优的入场点。   不要再猜测。开始像机构和聪明钱那样解读市场。   Apex Market Structure Pro(MT5 版)是一款精准的聪明钱分析工具,它剥离噪音,向您展示每根 K 线之下的真实结构:流动性、结构转变、吸   筹区域与趋势偏向,全部呈现在一个简洁、专业的图层中。专为厌倦了滞后指标、准备以清晰视角交易的严肃交易者打造。   重要提示:本指标专为 Heikin Ashi(平均足)K 线设计。使用前请将图表切换为 Heikin Ashi,以释放其全部威力。全部分析都围绕 Heikin   Ashi 的价格流构建。正是在这里,Apex Market Structure Pro 发挥出最佳表现。   交易者为何选择 Apex Market Structure Pro:   流动性,一览无遗: 瞬间看清止损池所在之处。卖方与买方流动性会被自动标注。实时关注尚未被扫的价位,捕捉价格攫取流动性并反转的精确时   刻。在聪明钱交易的地方交易。   会说话的结构:
FX-AIEA 供给需求区智能识别指标(Supply and Demand Indicators MT5)——技术原理与参数讨论 版本:2.51 | 适用平台:MetaTrader 5 引言 供给需求区是机构订单流的重要表现形式,相比传统支撑阻力位能更直接地反映买卖力量的失衡。本指标尝试通过算法自动识别高概率供需区域,以减少手动绘制的耗时与主观性。其核心逻辑基于自适应 ZigZag 算法,提取波峰波谷并生成区域标识 。 核心技术特点 全自动绘制机制 :基于改良版 ZigZag 动态提取有效极值,标记潜在供给区与需求区。指标遵循 MQL5 原生   prev_calculated   机制,在新 K 线生成时自动重绘,支持跨周期强制计算( Forced_TimeFrame   参数)。 区域边界模式 :支持宽带(覆盖K线影线极值)与窄带(仅覆盖实体)两种模式,用户可通过   use_narrow_bands   参数切换,以适应不同交易风格。 滤噪算法 :启用   kill_retouch   后,自动剔除被后续行情反复轻触但未有效突破的弱势区域,以提升信号有效性。 视觉与性能 :支持自
Footprint 是一款用于分析订单流 (Order Flow) 和成交量的指标。 它有助于在聚类层面识别市场结构,寻找活动增加的关键区域,并直接在图表上使用过滤器,无需不断打开设置窗口。 Footprint 指标功能 Bid x Ask, Delta 聚类图表; 图表上的控制面板; 用于调整过滤器的滑块; Absorption; Initiative; Stacked Imbalances; Big Trades; dPOC / Dynamic Point of Control; Delta; 侧边市场轮廓 (Market Profile); 累计 Delta (Cumulative Delta)。 核心优势 在密集的 Tick 流上快速计算和渲染数据; 图表内管理 — 主要模式和过滤器可直接在图表上切换,无需打开设置; 通过过滤突出显示重要的价格水平和聚类; 视觉信号高亮:吸收、主动性、失衡和大单交易; 按日、周或当前可见范围显示的侧边轮廓; 包含总成交量、Delta 和累计 Delta 的面板。 Footprint 帮助您确定: 重要成交量集中的位置; 主动性压力出现的位置;
Zain Gold ScalpingV5
Ahmed Gamal Abdel Nasser Mohamed
Zain Gold Scalping V5 is a technical analysis indicator for MetaTrader 5 designed for Forex and Gold markets. It provides chart-based market information, trend analysis, signal conditions, and an on-screen dashboard to help traders analyze price movement across multiple timeframes. Main Features The indicator supports multiple timeframes, including M1, M5, M15, M30, H1 and higher timeframes. It can be used with Gold (XAUUSD), Forex currency pairs, indices and other supported instruments. The in
Flag Pattern Angelo
Brighton Mufaro Mudzingwa
Brandon Angelo Flag Pattern — how it works This indicator automatically detects classic bull and bear flag chart patterns in real time. The detection happens in three stages for each bar. First it looks for a flagpole — a sharp, strong directional move over a configurable number of bars ( FlagpoleBars , default 5) that must exceed a minimum percentage size ( FlagpoleMinPct ). For a bullish flag the pole must close net higher than it opened; for a bearish flag, net lower. Second it identifies th
KT Alpha Hunter Arrows MT5
KEENBASE SOFTWARE SOLUTIONS
大多数箭头指标只给你一个信号,然后让你自己去判断剩下的一切。KT Alpha Hunter Arrows 为你提供完整的交易计划。 每一个信号箭头出现时,都会同时绘制一套完整计划:入场线、止损位、四个止盈目标,以及实时优势判断,告诉你当前这个交易品种和时间周期是否值得交易。随附的 Trade Manager EA 会在你手动入场后负责后续执行,让你在市场波动剧烈、情绪干扰明显时也能保持交易纪律。不重绘。仅在K线收盘后确认信号。适用于 Forex、黄金、指数以及任何你在 MT5 上交易的品种。 核心功能 不重绘买入和卖出箭头,只在K线收盘后生成。 每个信号都会显示入场线、结构性止损位和四个止盈目标。 Edge Dashboard 会分别评估当前图表上的买入和卖出机会。 判断系统包括:No Edge、Marginal、Tradeable、Good 或 Strong。 一键 Auto Optimize 按钮可根据当前品种和时间周期自动优化设置。 完整套装包含 Trade Manager EA,并提供五种专为本指标设计的预设交易管理方案。 Prop Firm Risk Panel 可在图表上
Boom & Crash & PainX & GainX Ultimate Spike Detector Trade Spikes With Confidence — Not Guesswork Catching spikes should be one of the most profitable strategies in synthetic markets. But for most traders, it becomes one of the most frustrating. You enter too early… price goes against you. You wait for a spike… it never comes. You finally catch one… but don’t know whether to hold or close. You make profit… then give it all back because there’s no exit plan. This is exactly the problem the Ultim
历史相似性匹配指标  概述 历史相似性匹配器(Historical Similarity Matcher)是 MetaTrader 5 的技术分析指标。它扫描历史价格数据,寻找与用户在图表上选定的参考时期具有统计相似性的片段。当找到匹配时,指标会显示历史模式,并根据这些历史片段的后续走势绘制潜在未来价格走势的投影。 本指标仅供教育和分析用途,不构成财务、投资或交易建议。不保证结果或盈利能力。过去表现不代表未来结果。交易存在重大损失风险。用户对自己的交易决策和结果负全责。  功能特点 - 识别与选定参考时期具有相关性的历史价格片段 - 支持正向和反向模式匹配 - 显示多个匹配的历史模式(数量可配置) - 为每个匹配绘制基于历史延续的独立投影线 - 可选 OpenCL 支持,在兼容硬件上加速计算(不支持时回退到 CPU) - 适用于任何时间周期和交易品种 - 允许在不同于当前图表的时间周期上进行扫描 - 在图表上提供启动扫描和导出结果的按钮 - 导出每个匹配的截图以及包含匹配详情的 CSV 文件  工作原理 1. 用户通过在图表上放置两条垂直线或在输入参数中设置日期来选择
OrderFlow Absorption – 專業級MT5買賣差與吸收訊號指標 釋放真正訂單流分析的力量,OrderFlow Absorption 是MetaTrader 5上最強大的買賣差(Delta)直方圖與吸收訊號指標。專為想看清每一個價格波動背後真相的交易者設計,這個工具揭示了隱藏的買賣壓力與推動市場的吸收事件。 功能特色 買賣差直方圖視覺化:   以清晰的色彩直方圖即時顯示買方與賣方壓力。 吸收訊號偵測:   先進邏輯自動辨識多空吸收事件,及早預警潛在反轉。 圖表標記:   吸收訊號直接標示於主圖表,方便視覺辨識。 彈出式警報:   新吸收訊號出現時即時通知。 自訂門檻:   過濾弱訊號,專注高勝率機會。 資源管理:   高效運算,適用於大型圖表也能流暢運行。 全品種兼容:   適用於任何商品與週期,包括外匯、指數、商品等。 簡易整合:   參數簡單,快速上手與調整。 OrderFlow Absorption 的邏輯說明 OrderFlow Absorption 採用專利演算法,能在沒有完整Tick數據的情況下,估算每根K棒的買賣壓力(Delta)。它分析成交量、價格行為、K
Chimera Volume
Marko Milenkovic
适用于 MetaTrader 5 的 Chimera Volume 高级成交量分析与市场活跃度可视化 Chimera Volume 是一款为 MetaTrader 5 设计的自定义指标,旨在通过动态视觉框架分析标准化成交量活跃度,并展示市场参与度的变化。 该指标利用自适应标准化算法处理 Tick 成交量数据,生成关于成交量强度、累积阶段以及不同市场条件下活跃度变化的结构化表达。 与显示原始成交量数值的标准成交量指标不同,Chimera Volume 应用了额外的计算方法,以突出市场活动的相对变化并提高图表的可读性。 主要功能 根意图直方图 (Root Intent Histogram): 一种动态直方图,用于可视化标准化成交量强度和市场参与度。该直方图使用自适应颜色过渡,以区分活跃度增加时期与参与度减弱时期。 惯性线 (Inertia Line): 一条由标准化成交量计算得出的平滑分析线。旨在帮助交易者观察成交量动能的变化,并监控扩张期与收缩期之间的转换。 信号线 (Signal Line): 一个用于比较短期和长期成交量表现的次级计算层,在评估市场状况时可作为辅助参考。 自适应成交量
作者的更多信息
MediasCoiote
Alexandre Moraes De Souza Lima
5 (1)
As médias coiote automatizam a leitura de analise de médias rápidas e lentas no saldo do volume e preço. Quando as médias estão em modo compra, a coloração do candle fica azul. Quando as médias estão em modo venda, a coloração do candle fica magenta. Quando a coloração fica verde ou vermelho, temos a tomada das médias no volume mas não no preço, quando isso ocorre é um sinal de atenção. A concepção do indicador é ser utilizado para operações em saída de consolidações na direção da tendencia do
FREE
CoioteCandlePVA
Alexandre Moraes De Souza Lima
5 (1)
Candle com coloração de Volume Price Analysis  (VPA) segundo as definições da Anna Coulling, é possível configurar períodos de  climax e rising, fator de extreme e fator de rising. Pode-se usar volume real ou volume de ticks. O VPA considera a variação de preço por volume do período, indicando se um movimento está recebendo ignição, está em seu climax ou se já não existe mais interesse.
FREE
Coiote Volume Candle
Alexandre Moraes De Souza Lima
Candle de Volume Coiote O Candle de Volume  Coiote é um indicador que mede a variação do volume no tempo, seu corpo é pela variação do volume anterior pelo volume atual, sua direção pelo fechamento do preço. 1. identificado um topo no indicador Candle de Volume  Coiote (marcado o fechamento do preço). 2. identificado um fundo no indicador Candle de Volume Coiote (marcado o fechamento do preço). 3. fundo 3 igual fundo 2 no indicador Candle de Volume Coiote, preço no 3 é diferente de fundo 2. P


FREE
Divergence Wave
Alexandre Moraes De Souza Lima
Ondas de Divergência. Antes do mercado tomar um sentido e se manter em tendencia, existem sinais que podem ser lidos, nos permitindo assim entender o "lado mas forte", e realizar trades de maior probabilidade de acerto com risco reduzido, esses movimentos são persistentes e contínuos, proporcionando excelente rentabilidade. Ondas de Divergência é um histograma que acumula a divergência de  entre preço e volume a cada tick, permitindo assim encontrar pontos de absorção, áreas de acumulo e distrib
CoioteChart
Alexandre Moraes De Souza Lima
O Indicador CoioteChart foi construído pra facilitar desde a leitura de contexto de mercado até a micro estrutura do candle, facilitando ajustes operacionais e tomadas e decisão com alta eficácia. Possui um controle para habilitar e desabilitar a visualização das pocs, vwap, zonas de máxima e mínima negociação, pode ser utilizado data sources de tempos gráficos para cálculos ou utilizado os ticks de agressão do time and trades, funciona com volume real e volume de ticks. As colorações são atrib
CoioteTarget
Alexandre Moraes De Souza Lima
Projeção de alvos harmônicos com dois cliques, os alvos possuem melhor qualidade quando ancorados em candles climáticos, seja de ignição ou exaustão ou em pivôs de alto volume. Funciona com qualquer ativo (volume real e volume tick), em qualquer tempo gráfico, ações, indicies, futuros, forex, criptomoedas, commodities, energia, mineiro e qualquer outro. As projeções devem respeitar os princípios de confluência e simetria, portanto não devem ser utilizados unicamente como critério de decisão, seu
CoioteTradeDetector
Alexandre Moraes De Souza Lima
O CoioteTradeDetector monitora o time and trades (time and salles), é possível criar filtros de alerta gráficos (plotagem de linha com qtd) com variações de agressões pré-definidas. É possível monitorar grandes lotes, ordens diretas e alta frequência de trades. Para perfeito funcionamento do produto é preciso ter os dados de agressão da corretora (acesso completo ao times and trades).
CoioteAverageSpreed
Alexandre Moraes De Souza Lima
O indicador CoioteAverageSpreed é uma releitura do indicador AverageSpreed. Ele mostra a relação de esforço x resultado entre o volume e a volatilidade do preço. Com o volume heatmap é possível identificar visualmente se o preço foi deslocado com uma quantidade maior de volume e se o deslocamento do preço apresentou maior resultado ou não. É possível identificar momentos de ignição e exaustão do movimento, além de injeções de fluxo para dar continuidade a um movimento.

CoioteWeisWave
Alexandre Moraes De Souza Lima
CoioteWeisWave é uma releitura do indicador de VSA WeisWave com indicação do estouro de fractal, método de analise dos TradersPiolhos e implementado originalmente pelo Trader Dario Junqueira. A versão Coiote foi reprojetada para indicação da volatilidade do volume no fractal. A coloração adicional (azul e magenta) dão sinais de entrada, saída e pontos de gerenciamento, podendo ser usados também como suporte e resistência. Existem 3 modos de exibição do weis wave, por volume total, por range e po
CoioteDeltaCandle
Alexandre Moraes De Souza Lima
O indicador precisa do times and trades (time and salles) para seu correto funcionamento. O Volume é composto por ordens à mercado compradoras e vendedoras que agrediram o book de ofertas, o Delta é a diferença das ordens a mercado compradoras e vendedoras. O CoioteDeltaCandle monitora o time and trades e à partir dos dados de agressão forma candles temporais em 4 formatos diferentes, possível selecionar à partir de configurações. São elas: Modo com acumulação. Modo com pavio. Modo inverter.
Coiote Book Balance
Alexandre Moraes De Souza Lima
Coiote Book Balance é um indicador que monitora o livro de ofertas e indica de maneira simplificada o níveis de renovação de ordens agrupados no timeframe gáfico, mostrando quanto o maior lado renovou e a diferença dessas renovações. Além disso, é possível visualizar em quais preços estão as maiores ordens da cada lado, o preço teórico dessa liquidez e a quantidade de lotes em tempo real. Para correto funcionamento do indicador é preciso que o livro de ofertas seja aberto antes da inclusão do in
BopCoiote
Alexandre Moraes De Souza Lima
5 (1)
O Indicador BOPCoiote é uma releitura do indicador Balance of Power proposto por Igor Livshin em Agosto de 2001, publicado na Stocks and Commodities Magazine. Uma média móvel de 14 períodos é recomendada para gráficos diários. Embora o número de períodos possa variar dependendo da natureza do mercado e dos prazos. O nível em que ele agrupa seus fundos e topos é considerado uma das propriedades mais importantes do indicador BOP. Durante as tendências de alta, suas máximas frequentemente tocam os
OrderFlowMomentun
Alexandre Moraes De Souza Lima
order flow indicator that monitors price formation effectively identifying market direction. As it is an extremely fast indicator, it should be used in support and resistance, static and dynamic regions, the OrderFlowWay will predictively indicate the veracity of breakouts that have not happened yet, showing whether there is action by big players in the traded price. Operations must be carried out after crossing the lines, preferably close to the zero axis of the indicator.
CoioteOscilator
Alexandre Moraes De Souza Lima
CoioteOscilator é um rastreador de tendência e padrões de estruturas gráficas. O Indicador é composto de 3 elementos. oscilador principal lento: histograma com nível de 0 até 50 e 4 cores, 2 compradoras, de 0 até 30 e acima de 30 e duas vendedoras, de 0 até 30 e acima de 30.   oscilador principal  rápido: linha magenta com nível de -50 até 50. gatilho:  linha amarela com nível de -50 até 50. O  oscilador principal lento  é um rastreador de tendência primaria. O  oscilador   principal  rápido é u
筛选:
无评论
回复评论