Quant Key Levels

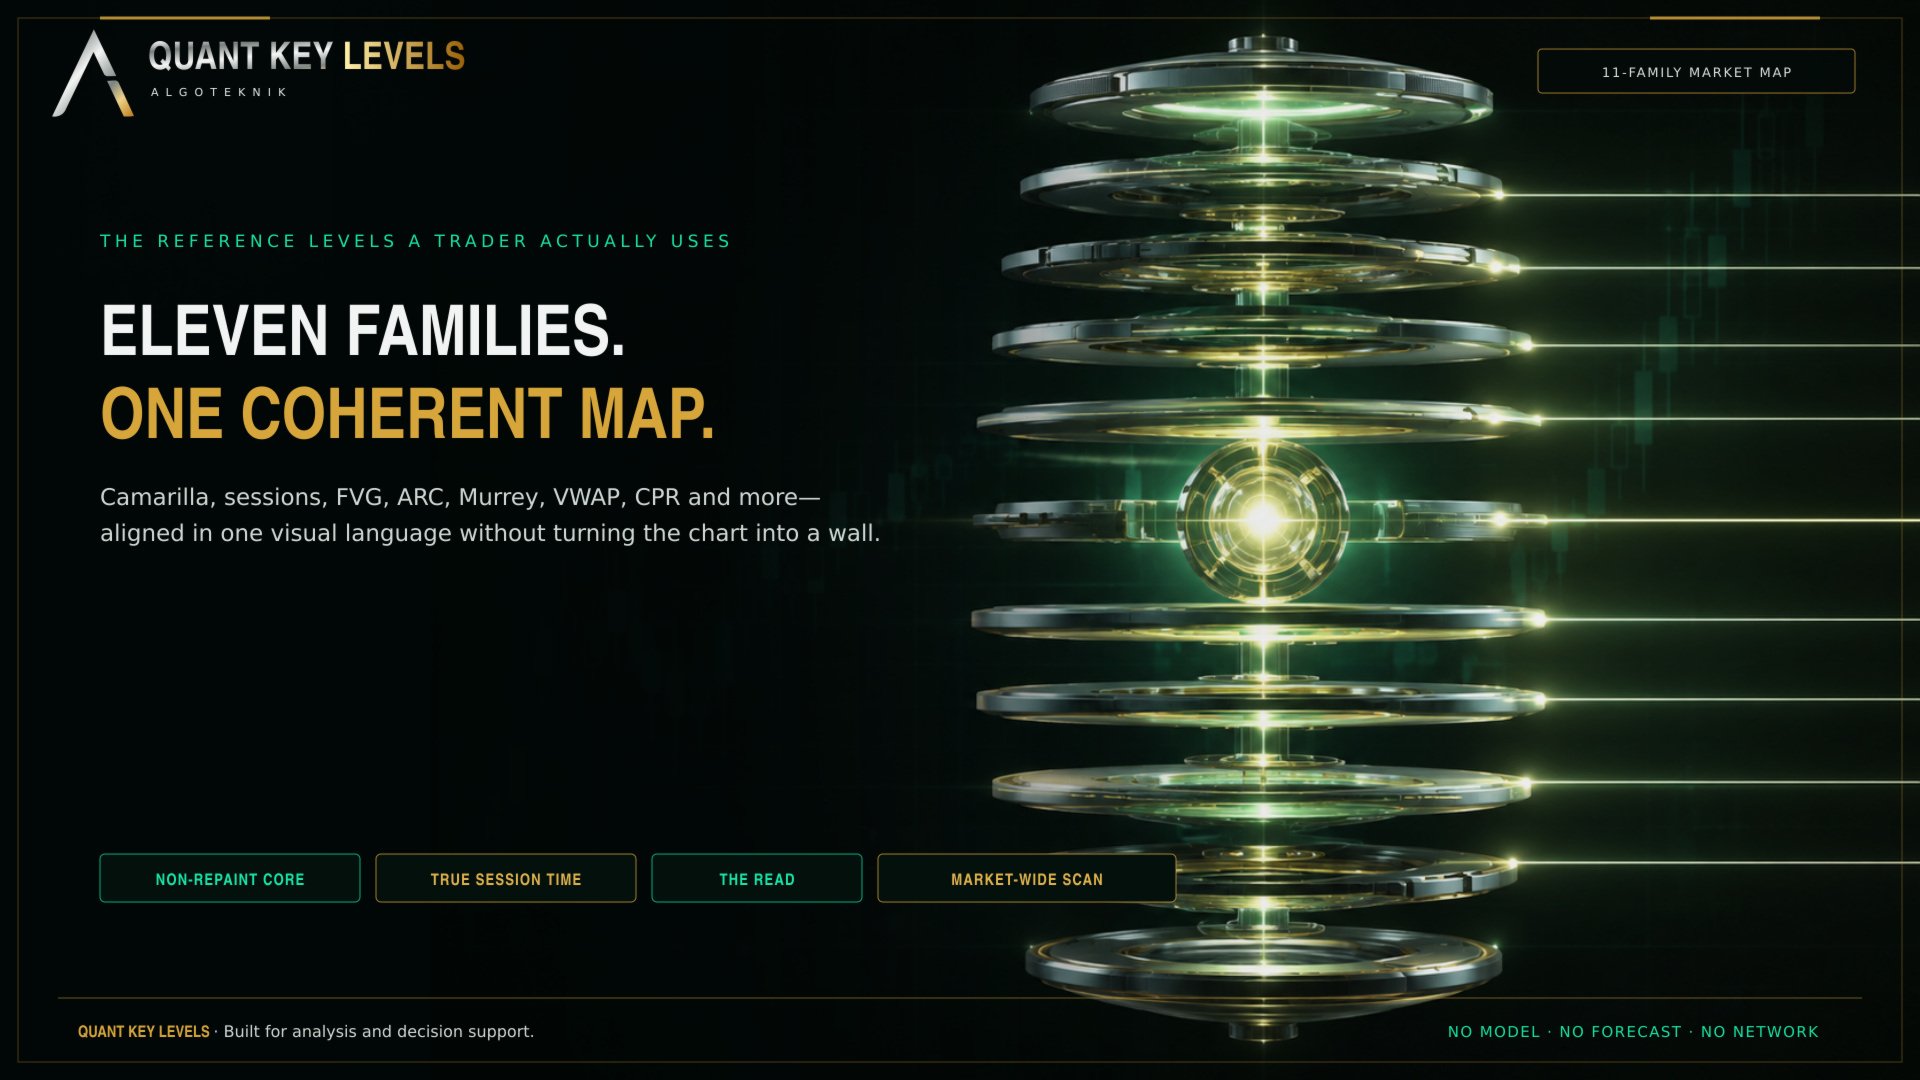
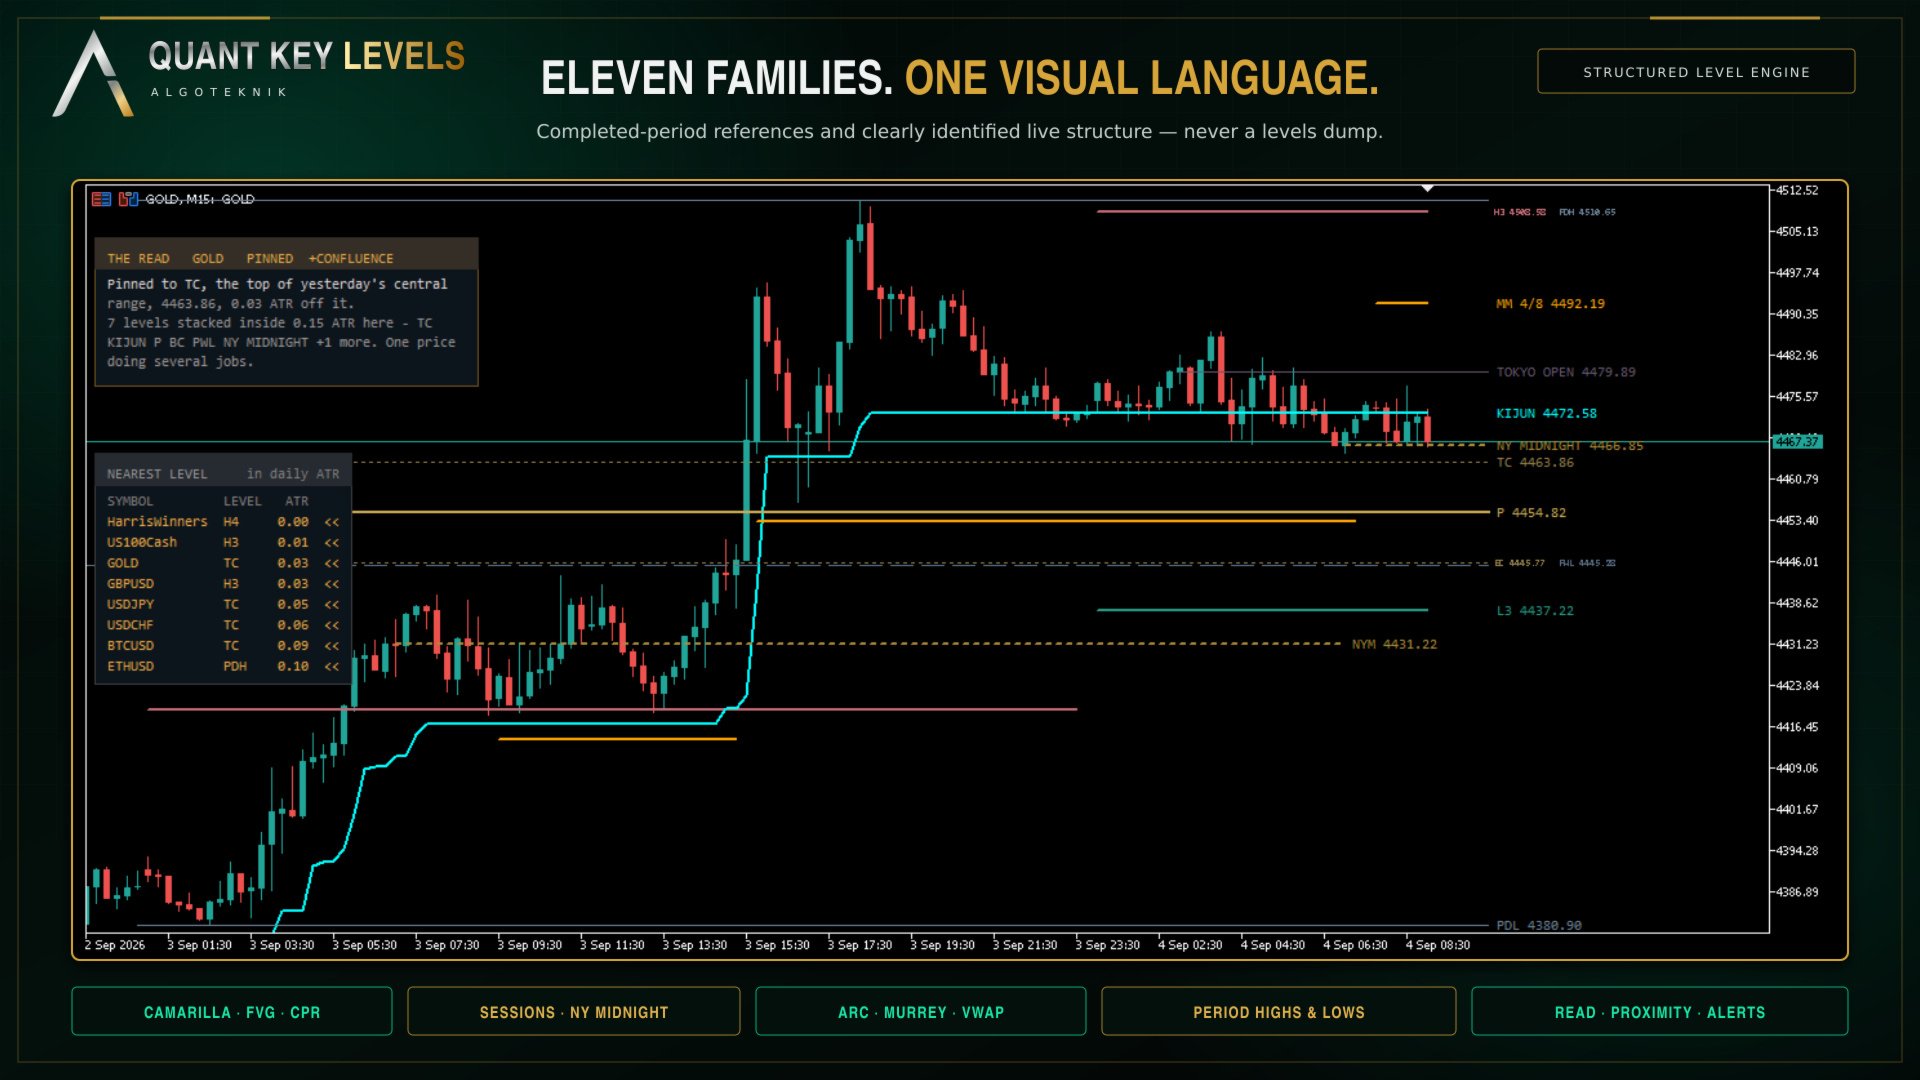
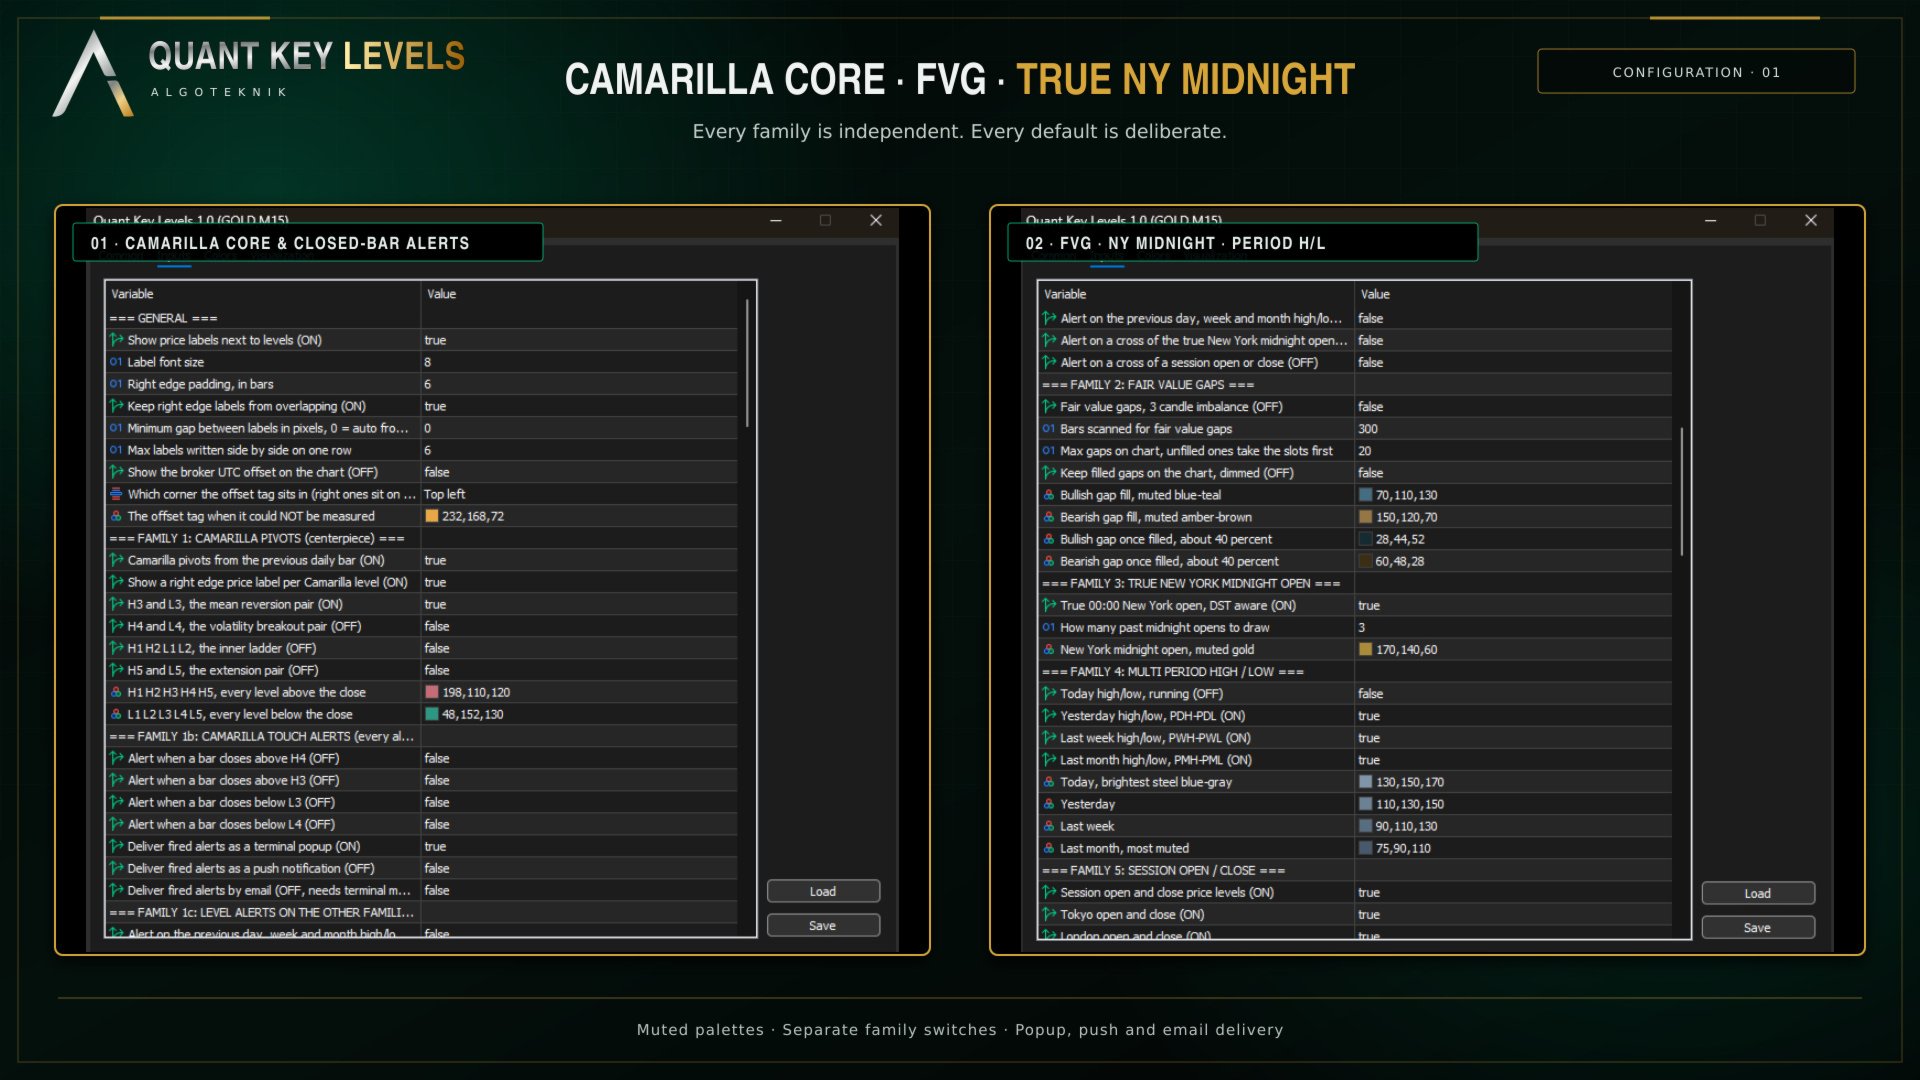
Quant Key Levels, version 1.0. The reference levels a discretionary trader actually works from, on one chart and in one visual language. Eleven families, each on its own switch, and nothing on the chart that a level does not earn.

What separates it from a pivot pack is not the number of families. It is that the things most level tools assume, this one measures. How far your broker's clock sits from UTC, measured out of your own terminal rather than typed into a box. Where an exchange actually opens, to the minute, on that exchange's own daylight saving calendar. How wide a pivot range is, in the symbol's own average day rather than in points that mean nothing across instruments. And what it measures it shows you: the offset goes in the journal and optionally on the chart, the range width is written on its label, the distance to the nearest level is a number you can read.

Every level is defined from a period that has already closed, so once it is drawn it does not move. There is exactly one exception and it is marked as such, today's running high and low, which is a live range by definition. Where the numbers can be checked against something you already own, they are: the Camarilla family matches the Camarilla Channel that ships with MetaTrader 5, value for value, on the same chart.

Release notes, chart examples and new product announcements are posted on the TrendTower channel: https://www.mql5.com/en/channels/trendtower

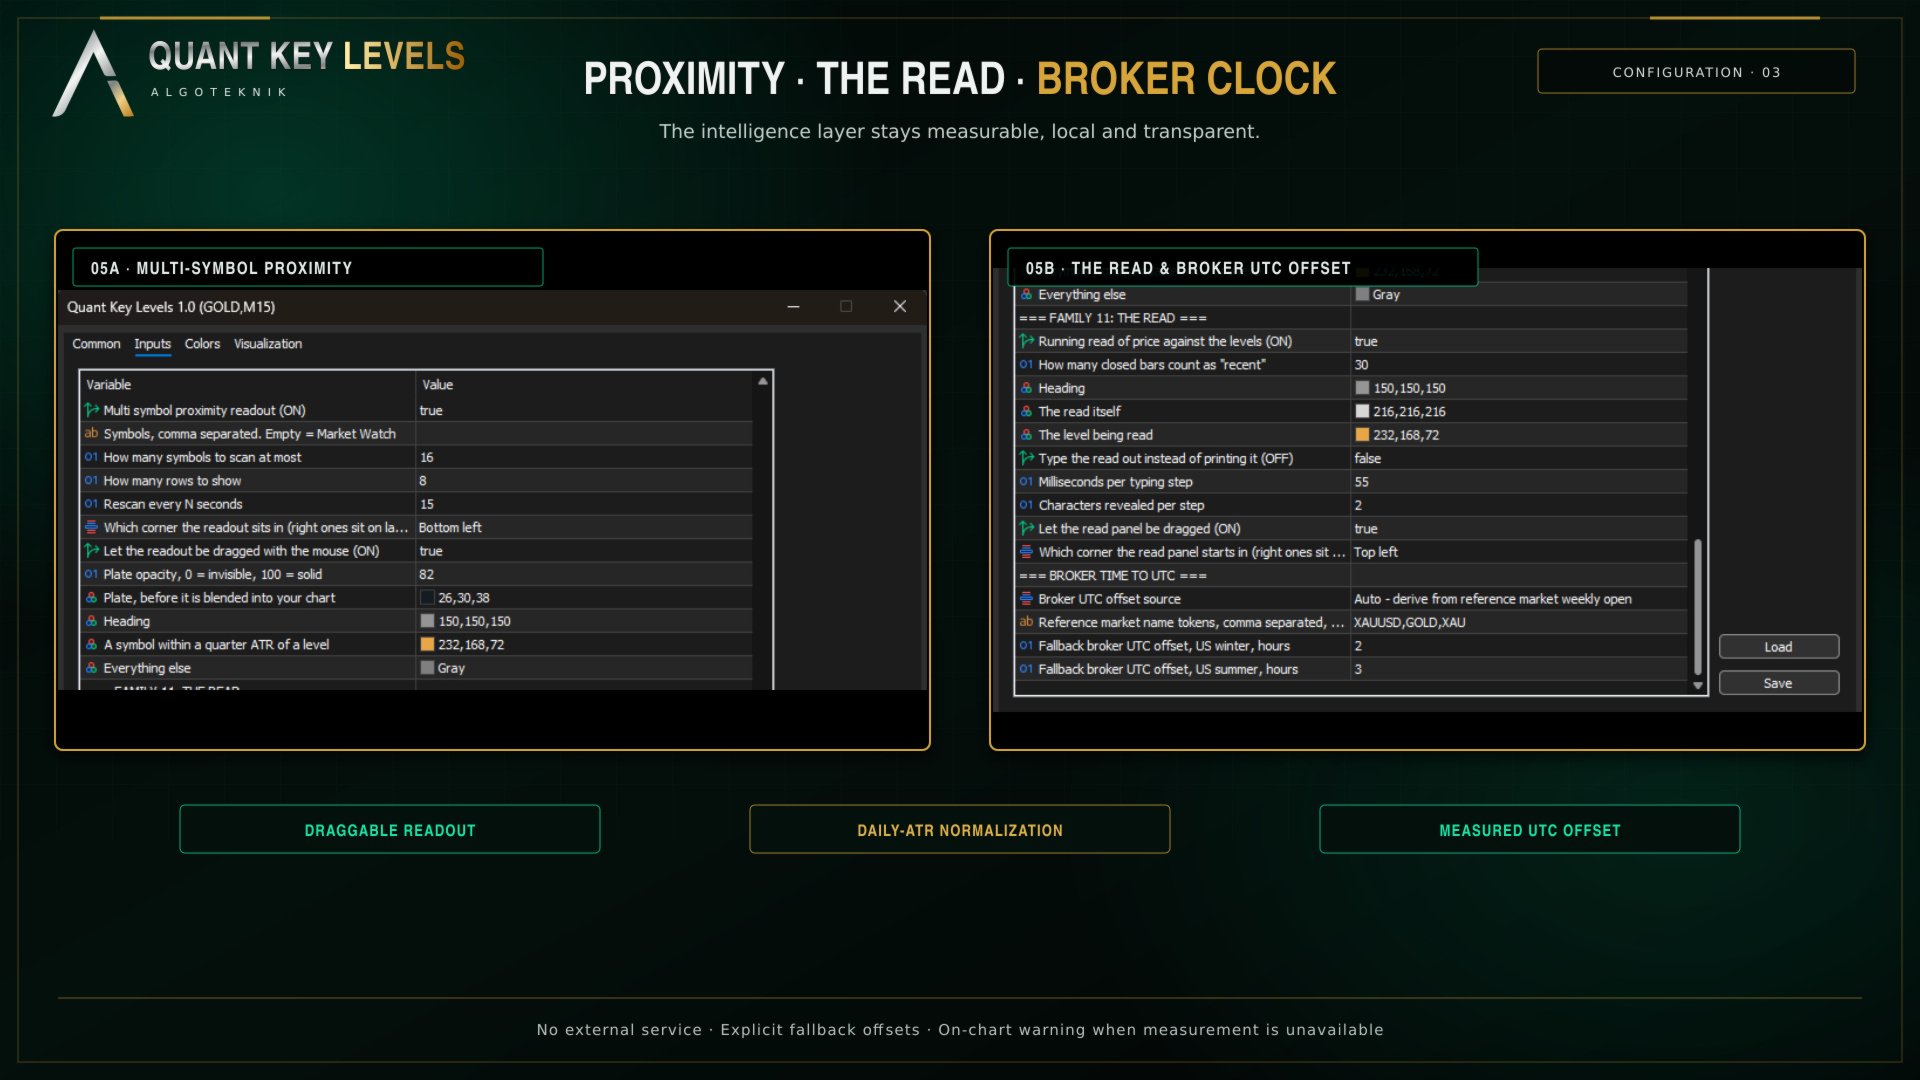
The broker clock is measured, not typed in

Three families are built on one number. The true New York midnight open, the six session levels and both daylight saving calendars all run off the broker's distance from UTC. Most level indicators ask you for it, or take it from the server offset, and either way it is wrong twice a year and wrong again when you change broker.

Here it is solved from data. The indicator reads the weekly opening bar of a reference market out of your own terminal and finds the single whole hour offset that puts that opening on Sunday at its known UTC time. There is no internet request, no external service and no library to install. The chart's own symbol is deliberately not used as the anchor: many brokers trim foreign exchange to broker midnight, and that silently produces an offset one hour wrong, so a continuously traded instrument is used and gold is the default. The name tokens searched for are an input.

The answer is reported in the journal at start-up and can be shown on the chart. When it cannot be measured a warning appears that cannot be switched off, because a wrong offset puts those levels on wrong prices while the chart still looks entirely reasonable. In the Strategy Tester, where only the tested symbol is loaded and the reference is usually missing, it says that too, and falls back to manual winter and summer offsets you can set.

Real exchange hours, and two daylight saving calendars

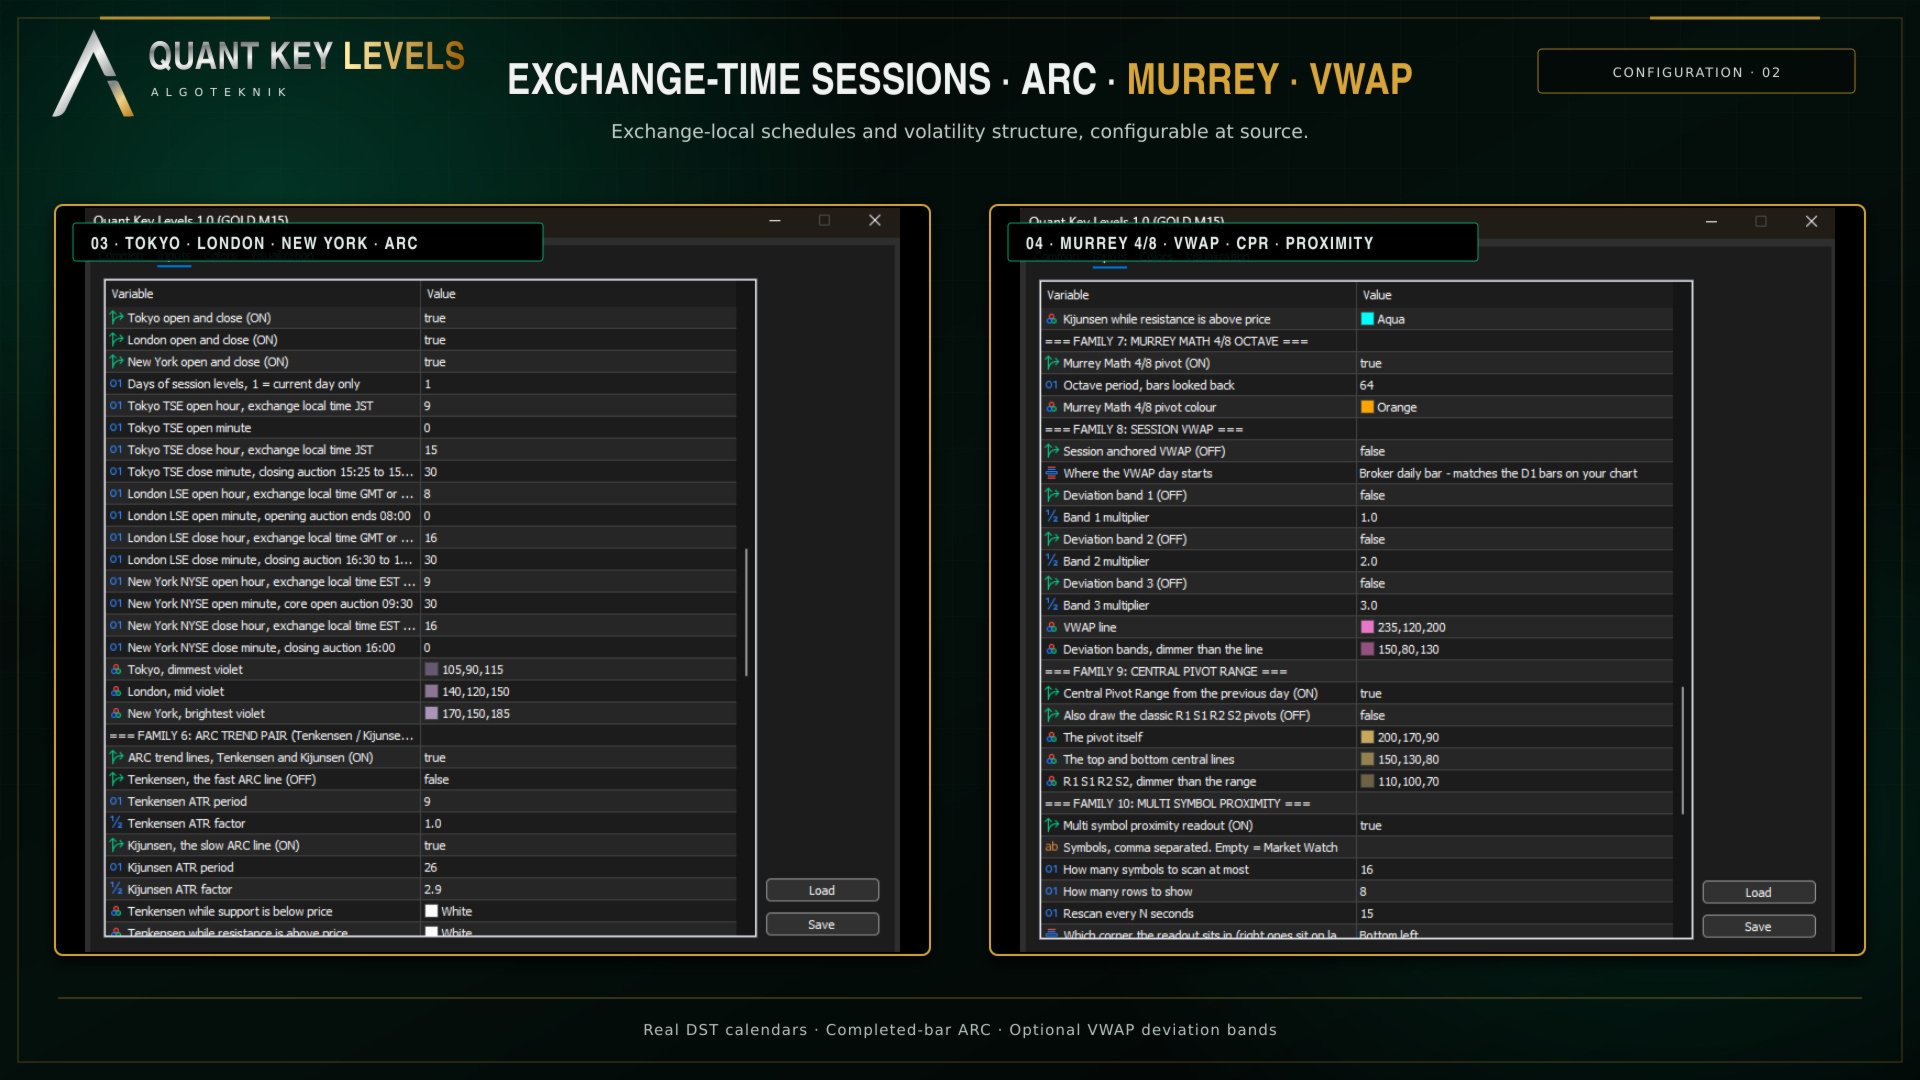
Six price levels, not shaded ranges: the open and the close of Tokyo, London and New York. These are not the rounded 08:00 to 17:00 blocks most session tools draw. They are the published trading hours of the three exchanges, to the minute. Tokyo runs 09:00 to 15:30 JST, with a closing auction from 15:25 that sets the official close, a 15:30 close that has been in force since November 2024, and no daylight saving anywhere in Japan, so it is 00:00 to 06:30 UTC every day of the year. London runs 08:00 to 16:30 London, with an opening auction ending at 08:00 and a closing auction from 16:30, which is 07:00 to 15:30 UTC on British Summer Time and 08:00 to 16:30 UTC on Greenwich Mean Time. New York runs 09:30 to 16:00 Eastern, the core open auction at 09:30 rather than 09:00, which is 13:30 to 20:00 UTC on Eastern Daylight Time and 14:30 to 21:00 UTC on Eastern Standard Time.

Every one of those times is entered as the exchange's own local time, hour and minute, exactly as that exchange publishes it. You never type a UTC number and you never type a summer variant and a winter variant: the conversion and the changeover are done for you, so nothing has to be re-entered twice a year. Change the local times if your working definition of a session differs and the UTC placement and the daylight saving shift stay correct on their own. Each level's tooltip shows both clocks, the UTC instant and the exchange local time with the zone in force that day, so you can check the placement without doing the arithmetic.

The two zones do not switch on the same weekend. In late October the United Kingdom has already fallen back while the United States has not, and for that week London and New York shift on different days. Each zone follows its own calendar here, so that week is handled correctly rather than smoothed over with one shared offset. Open is drawn solid and close dash dot in one violet family, so you can tell an open from a close by pattern alone. A boundary that has not happened yet draws nothing at all, and the close level appears only once the session has actually closed.

One unit: the symbol's own daily ATR

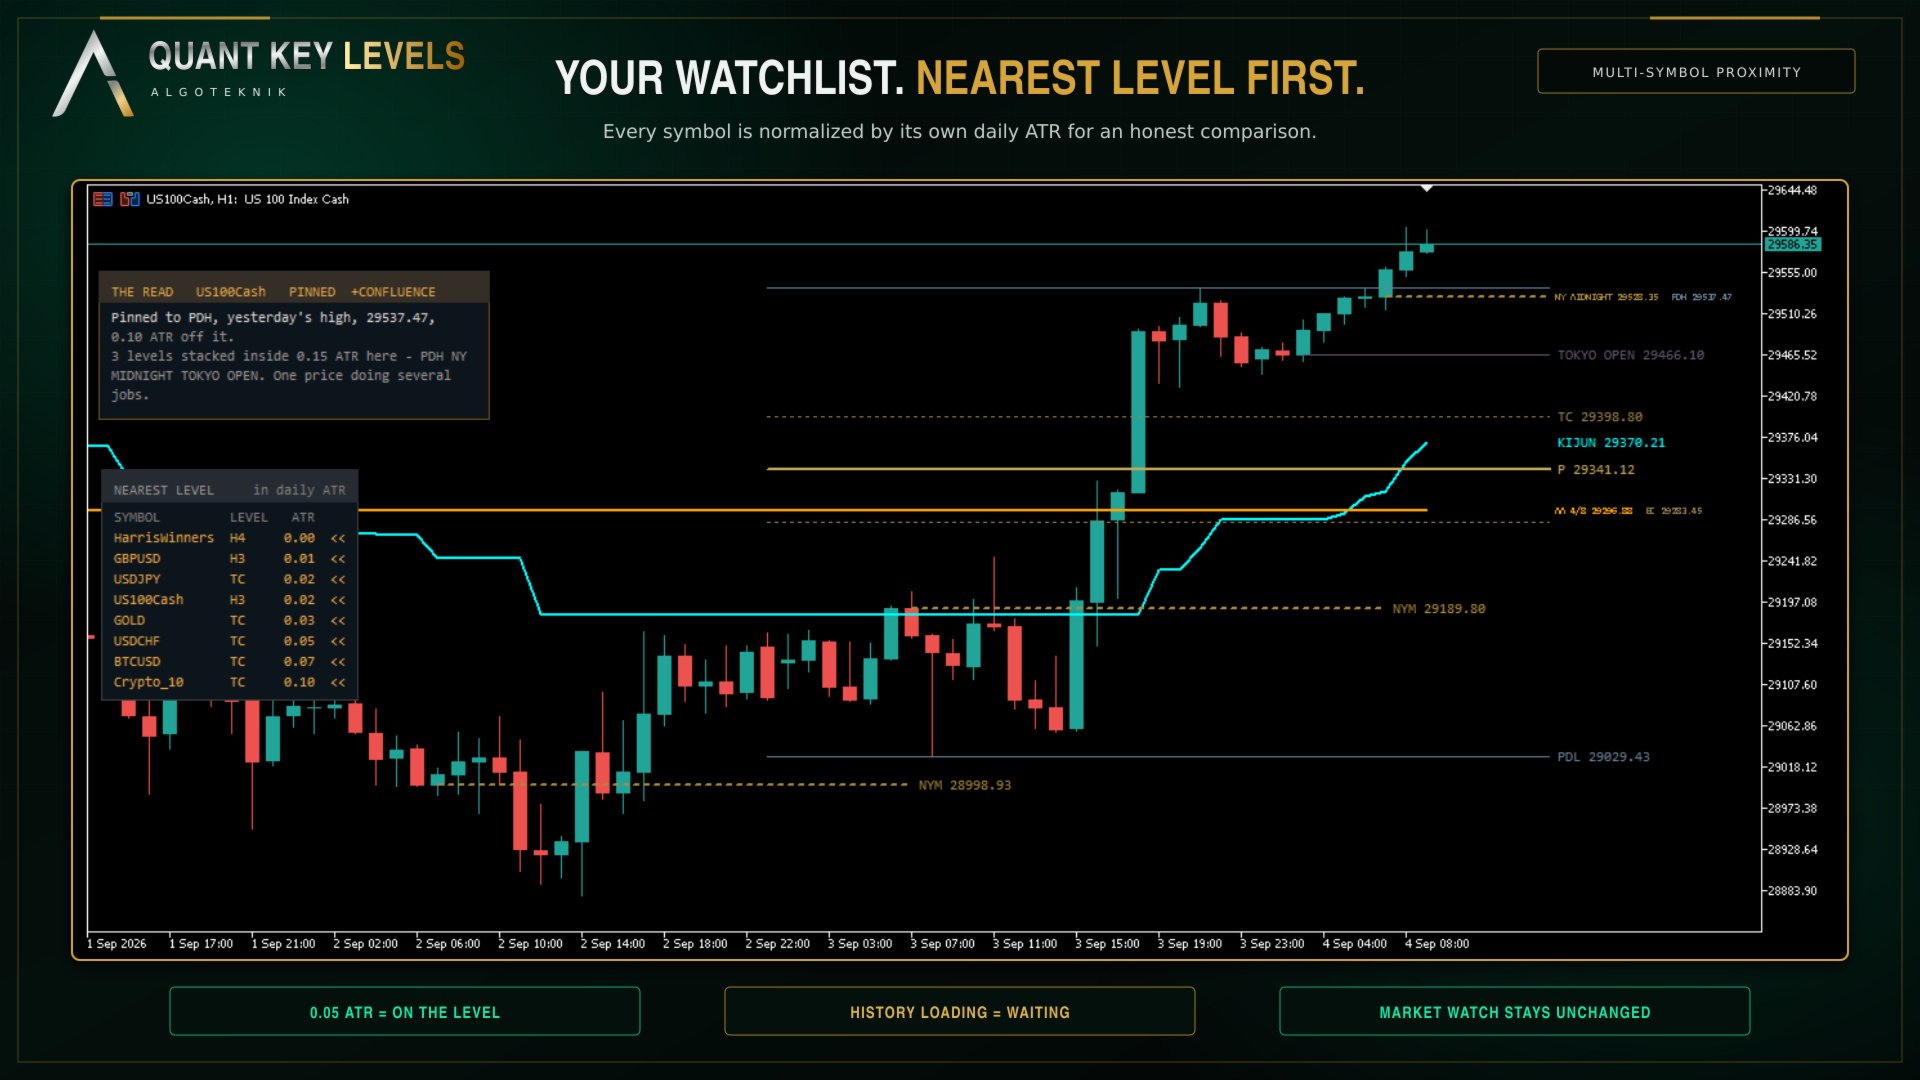
Distance in points does not travel. Forty points is nothing on gold and most of a day on EURUSD, so a number that is supposed to tell you how close price is to a level has to be normalised before it means anything. Everything in this product that reports a distance reports it in that symbol's own daily average true range, and that one decision is what lets a gold row and a EURUSD row sit in the same table and be read against each other.

The same unit measures the Central Pivot Range. P, TC and BC come from yesterday's daily bar, and the reading is the width between TC and BC rather than the lines themselves: narrow says yesterday closed near its own midpoint and the market did not decide, wide says it trended. That width is written on the label as a number, as in “TC 0.42 ATR wide”, so a narrow day is a measurement rather than an impression. TC is not always above BC. When yesterday closed below its own midpoint the pair inverts, and that flip is information, so both are drawn where they fall rather than sorted into a fixed order. The classic R1 S1 R2 S2 ride on the same pivot and ship off, because this family exists for the range.

A running read of the chart, in the language a desk would use

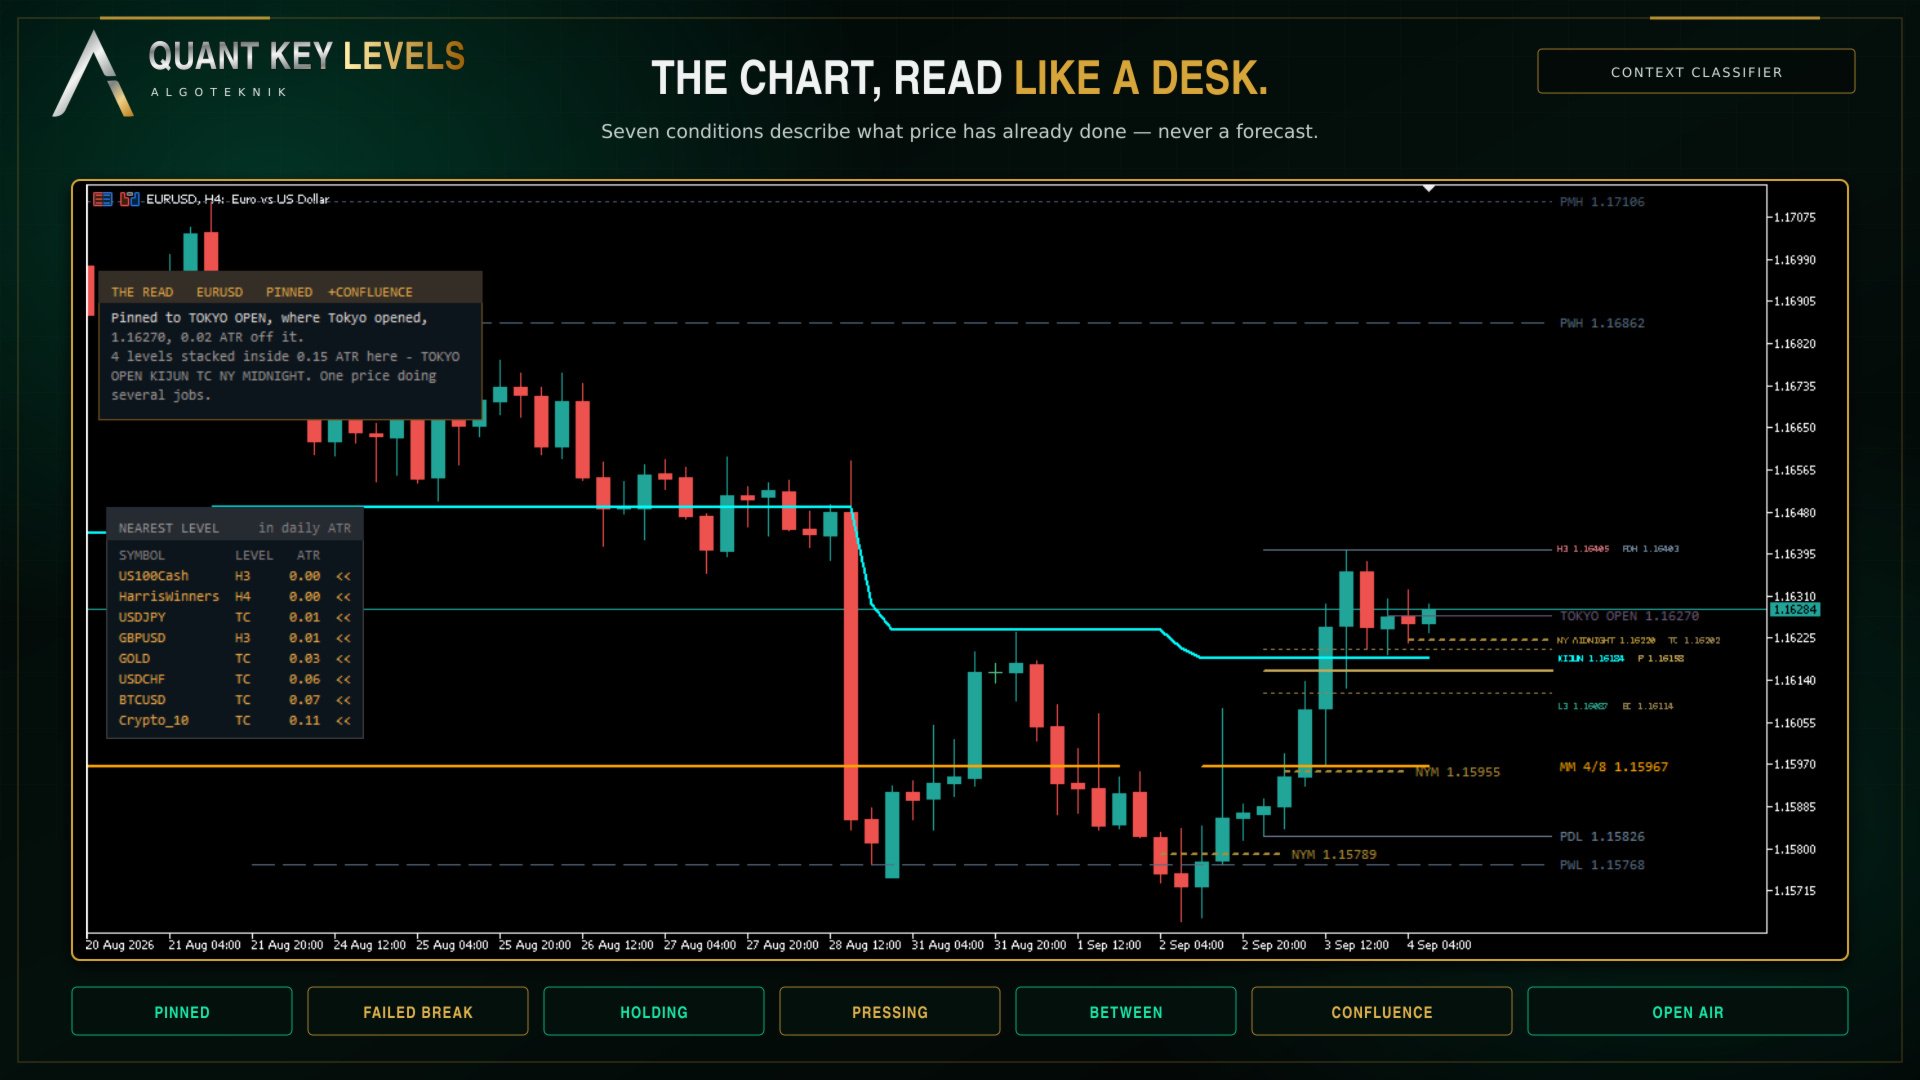
“Pinned to L3 4412.80, 0.04 ATR off it. Four touches in the last thirty bars and no close through.” The read measures the distance from price to every level on the chart in daily ATR, decides which of seven situations that is — pinned, failed break, holding, pressing, between, confluence, open air — and prints the sentence for it with the real numbers in. The panel holds eight lines; on the rare read that fills them the last line ends in three dots, which is the panel saying it ran out of room rather than the read stopping there.

It is a classifier, not a crystal ball, and the distinction is the point: there is no model, no forecast and no network anywhere in this product. Nothing on that panel says where price is going or what to do about it. Every sentence is a statement about what has already happened, which is the only thing a chart can honestly tell you. The same inputs produce the same sentence every time, and it holds its level through the small moves that would otherwise make it flicker between two neighbours.

The question a single chart cannot answer

Which of the things you trade is on a level right now. The multi symbol proximity readout scans your Market Watch, or a list you give it, and reports each symbol's distance to its nearest key level in that symbol's own daily ATR. 0.05 means price is on the level; 1.00 means a full average day away; anything inside a quarter of an ATR is called out. Nine levels per symbol, all from its previous completed daily bar. It never adds anything to Market Watch to fill the list out, and a symbol still downloading its history is shown as waiting rather than reported as a zero. In the Strategy Tester only the tested symbol is loaded, so the readout shows one row there and says so on the plate; that is the tester, not the product. When a symbol has no live quote, because the market is closed or it has not ticked since the terminal opened, its last daily close stands in for the price.

Nothing repaints, and the one thing that moves says so

Every level here is defined from a period that has already closed. The daily average true range that the read, the proximity readout and the pivot range width are measured in is built from closed daily bars only and never touches today's forming bar, so those numbers do not drift through the session. The Murrey octave is computed from the bars before the current one, so it is fixed the moment its bar opens. The ARC pair draws the level as it stood after the previous bar closed. The VWAP value on a closed bar was measured against its own recomputation and never changed afterwards. The single exception is today's running high and low, which is a live range by definition and carries a tilde in its name so it can never be mistaken for a settled level.

Levels that stay readable

A level that is flat for a day and jumps at the boundary is two shelves, not one sloping line. Drawing it as a single continuous line paints a vertical through prices that were never a level, and that is what turns a pivot chart into a staircase. Every family here that steps — the Camarilla set, the Murrey octave, the ARC pair at a side change — is drawn as separate flats with the joining bar left blank.

With everything switched on, eleven families put their levels on the chart and their labels all want the same strip of screen at the right edge. Rather than let them print on top of each other, the labels go into one queue and a single pass lays out the whole column at once. Labels that land within one text height of each other belong to one row, and a shared row is written side by side: they are not merged and nothing is thrown away, so each label keeps its own text, its own price and its own colour. A shared row is set 25 percent smaller than a label that has its row to itself, which is what buys the horizontal space back, and the widths are measured with the real font metrics rather than guessed from a character count. Grouping runs in order of importance and the rows come out correctly spaced on their own, so no label is nudged off its own price and none is hidden. A row holds at most six labels by default; past that the last one carries a “+N” so the count stays honest. Crowding is measured in pixels, so the column is recomputed as you zoom.

The two panels are drawn as framed plates whose colour is blended with your chart background rather than painted over it, so the candles behind them stay readable. Both can be dragged anywhere and both remember where you put them, per symbol.

The eleven families

Camarilla pivots. Calculated from the previous completed daily bar, with R as the previous high minus the previous low. H4 and L4 sit at Close plus or minus R times 1.1 divided by 2, H3 and L3 at 1.1 divided by 4, H2 and L2 at 1.1 divided by 6, H1 and L1 at 1.1 divided by 12. H5 is the previous high divided by the previous low, multiplied by Close, and L5 is H5 mirrored around Close. This is the Camarilla Channel that ships with MetaTrader 5, drawn the way it draws it: all ten lines on every bar, solid, with H3 and L3 heavy and the other eight thin. The colours are this product's own, rose above the close and teal below it, measured for contrast rather than picked by eye. Switch all four pairs on, put the stock Camarilla Channel on the same chart, and every value sits exactly on top of its own. That is the only kind of proof worth offering.

What ships on is the mean reversion pair alone, H3 and L3. Ten lines at once is a wall and those are the two a trader actually works from. The other three pairs are one switch each, because a level and its mirror are read together, and turning a pair off removes its line, its right edge label and its touch alert together. The arithmetic is untouched: every level is still computed, so turning a pair back on shows the numbers that were always there.

What this module adds to the stock version is correctness, never a different picture. The stock indicator builds its object prefix from the clock, so it changes on every restart and leftover labels can never be swept away; here the prefix is fixed and a sweep runs before anything is drawn. The stock indicator can stall permanently when the previous daily bar is missing, and not only for that bar but for the whole rest of the chart; here the history is actively requested, the affected bar is left blank and the levels repair themselves when the data arrives. The stock indicator divides by the previous Low without checking it; here H5 and L5 are left out rather than invented when that division is not safe. The stock indicator refuses to start at all above D1; here Camarilla simply stops drawing above D1 while the other families carry on. Several vendors publish different H5 and L5 conventions; the one used here is the MetaQuotes published extension, and it is written on the tooltip of the level itself, so a number that differs from another package is a convention difference rather than an error.

Fair value gaps. The classic three candle imbalance, scanned over the last 300 bars by default and drawn as a shaded block extended to the right for as long as the gap stays open. A gap counts as filled the moment price trades through its far edge, the bottom of a bullish gap or the top of a bearish one, because reaching that edge means the whole imbalance has been traded back through. The box is cut at the candle that fills it and is never drawn past that candle. A filled gap is not deleted: it is dimmed and its right edge is frozen there, so the record of where imbalance was resolved stays on the chart. At most twenty gaps are kept, open ones claim the slots first, and the first thing dropped is always the oldest already resolved gap.

True New York midnight open. The daily open at midnight New York time, which is 05:00 UTC in winter and 04:00 UTC in summer, switching on the real United States daylight saving dates rather than on a broker server offset that someone typed in once. It is placed with the measured clock described above.

Multi period high and low. Four periods, each with its own switch. Yesterday, last week and last month ship on; today running ships off because it is the one level that moves all day. Every value is read from a completed daily, weekly or monthly bar rather than assembled by scanning intraday bars across a boundary, which is what makes weekend and holiday gaps a non issue. On a Monday the previous day is simply the previous daily bar, which is Friday. Style carries recency rather than colour: all four use one steel blue family, and you read the age of a level from how it is drawn.

  • Today, solid and brightest
  • Yesterday, solid and slightly muted
  • Last week, dashed
  • Last month, dotted and most muted

Session open and close. The six exchange levels described above, drawn from the published hours of Tokyo, London and New York on their own daylight saving calendars.

ARC trend pair. ARC stands for Average Range times Constant, from Welles Wilder Jr, 1978. A constant times the Average True Range is measured off price to give a level that trails the market, and the rule is short: if close minus factor times ATR is above the level the level moves up to it, if close plus factor times ATR is below the level it moves down to it, and otherwise the level does not move at all. The level is therefore dragged along only when price gets further than one ARC away from it. Inside that band nothing happens, which is why the line sits on long flat shelves and why price can cross it without moving it a single tick. The ATR used is the plain average of true range, not Wilder smoothing.

Two lines are drawn, used the way an Ichimoku uses its two fast lines but built from Average True Range instead of fixed period highs and lows: the Tenkensen on a nine period ATR with factor one, drawn thin, and the Kijunsen on a twenty six period ATR with factor 2.9, drawn heavy. Both period and factor are inputs. Each line has two colour inputs, one for while it sits below price and one for while it sits above, on separate plots so the handover at a side change is flat rather than a jump. They ship set to the same value per line, white for the Tenkensen and aqua for the Kijunsen, so each line reads as one colour unless you choose to have the side called out. The value drawn on a bar is the level as it stood after the previous bar closed, so nothing on the current bar can change it.

Murrey Math 4/8. Murrey Math takes the range of the last sixty four bars by default, snaps it onto a base eight octave grid and cuts that octave into eight equal eighths. The 4/8 line is the middle one, the main pivot, where price is treated as being in balance. Only the 4/8 is drawn here: the other twelve lines of a full Murrey set would turn the chart into a grid, and the 4/8 is the one that behaves like a key level. The calculation is a line for line port of the Murrey Math indicator that is already in the terminal, quirks included rather than tidied up, so the two agree to the last digit and can be checked against each other on the same chart.

Session VWAP. The volume weighted average price, accumulated from the start of the session: each bar contributes its typical price weighted by that bar's activity, and the line is the running average of the two. By default the session starts at the open of the broker's own daily bar, the same boundary the Camarilla levels use and the same one your daily chart draws, so the two never disagree about where the day began; the alternative anchor is true midnight New York.

Where the feed supplies real traded volume it is used. No retail foreign exchange or CFD feed does, so on those instruments the weight is the tick count, the number of price changes in the bar. That was measured rather than assumed, and so was what it tracks: tick count correlates 0.74 with the bar's range, which means it follows activity and volatility rather than traded size, while its shape through the day does match the real liquidity curve. On foreign exchange this line is honestly a volatility weighted mean price, and knowing that is worth more than a footnote. It is timeframe dependent, and so is every other VWAP: each bar contributes a single typical price, so a coarser chart folds more of the movement inside each bar into one number. Three optional band pairs sit at plus and minus a multiple of the weighted standard deviation of price around the line, using the same weights; all three ship switched off, because six lines that move together crowd out everything else.

Central Pivot Range, described above with its width tag. Multi symbol proximity and the read are the tenth and eleventh, and both are panels rather than lines; both ship on, because a feature nobody finds is a feature nobody bought.

Alerts

Camarilla H3, H4, L3 and L4 raise a close alert; so do the previous day, week and month highs and lows, the true New York midnight open, and the session opens and closes. Every one of them judges the last closed bar and never the forming one, none fires for the history that was already on the chart when the indicator loaded, and each level fires at most once a day. Direction is per family: a previous high is broken upward and a previous low downward, so those fire on a close past the level, while a midnight open or a session open has no side to break and fires on a cross in either direction. Delivery is popup, push notification or email, each on its own switch. Every alert ships off.

The Data Window

Every level that is drawn as a chart object is also published to the Data Window under its own name: previous day, week and month high and low, today's running high and low, the New York midnight open, the pivot range, and the six session levels. Hover a bar and read the exact number instead of taking it off a label that shortens when the right edge is crowded. A level is only reported from the bar that defined it onward, so hovering last month does not report today's previous day high, and a family you switch off leaves the Data Window rather than freezing its last value there.

Colours, settings and the full reference

A small set of muted hue families, each distinguished inside itself by line style and weight rather than by adding more colours. Nothing is neon and nothing is a pure red or green, and the shipped values are chosen to stay readable across a long session on a dark chart. Every colour is an input, so the whole palette can be retuned to your own theme without losing the structure.

Colour, line style and width come from the Inputs tab and are re-applied every time the indicator starts, so edits made in the Colors tab do not stick. That is deliberate. A chart stores the plot settings of every indicator attached to it and pushes them back over what the indicator asks for, so a chart that once held a different version of this tool can force that version's settings onto this one, and when the two disagree about how a line is drawn the line does not appear at all. Rather than let a stale chart setting silently blank out a level, the indicator puts its own definition back.

The complete input reference, including every default, every allowed range and the behaviour that has no switch, is in the Manual.txt file, published on the channel linked at the foot of this page. A Market product carries one file, so the manual is not packed with the EX5.

Questions, bug reports and feature requests are welcome on the TrendTower channel: https://www.mql5.com/en/channels/trendtower

This is an indicator for analysis and decision support. It does not place trades. Always test thoroughly before using any tool in live trading. Trading involves risk.

algoteknik

Support, updates and every other product: mql5.com/en/users/bugraky123
Product channel: mql5.com/en/channels/trendtower

Quant Key Levels version 1.0
추천 제품
Apex Trend Zone — Product Description Apex Trend Zone is a trend-following signal indicator designed to capture the market's primary direction and help you stay in a position throughout the trend. By tracking price momentum, it marks potential reversal and continuation points on the chart using clean arrow markers and an adaptive trailing line. The indicator uses a dynamic zone logic that adjusts itself to market volatility. As the trend strengthens, the trailing area widens, aiming to reduce ea
Grid MA Robot MT5
Songkiet Manoharn
Grid MA: Institutional Risk Edition by Hello Quant is an advanced, fully-automated mean-reversion grid framework engineered for stringent capital preservation and extreme volatility management. Unlike traditional grid systems that hold stranded losing positions while scraping small individual profits, Grid MA V1.71 utilizes a proprietary Directional Basket Profit Realization engine. It calculates the net equity of your entire directional exposure (including swaps and commissions) and executes a
See the structure and liquidity. Read the trade plan on your chart. Pusula brings market structure, liquidity and SMC setups into one workspace for MetaTrader 5. BOS and CHoCH, liquidity sweeps, FVGs and order block zones are drawn on the chart. The Chart reading card explains in plain words what the market has done and which condition the setup is waiting for. When the conditions of one of three strategies are complete, entry, stop, targets and lot size based on your risk appear in one plan; th
Supply and Demand Indicator + FREE Currency Strength Meter ADD-ON Looking for a powerful tool that can help you identify the most reactive zones in the forex market? Our supply and demand indicator for MetaTrader 4 and 5 is exactly what you need. With its advanced algorithms and real-time analysis, this indicator helps traders of all experience levels make informed trading decisions. The supply and demand indicator is a cutting-edge tool that helps traders identify areas where buyers and sellers
ASI fractals with DPO filter - is the manual trend-following system. ASI fractals are the base of every trend. System plots an arrow when fractal pattern appears on ASI indcator and DPO direction is same as incomming signal. System has several ways of usage : simply indicator, indicator with suggested arrows, arrows with single targets and arrows with common profit targets. User can simply switch indicator's modes directly from chart. Main Indicator's Features Signals are not repaint,non-late or
This product is designed for the MT5 platform and offers two key features: VWAP (Volume Weighted Average Price) calculation and Volume Profile analysis. Advantages: VWAP Calculation: The product calculates the VWAP, which is a popular indicator used by traders to determine the average price of a security based on its trading volume. It helps identify potential buying or selling opportunities by comparing the current price to the average price weighted by volume. Volume Profile Analysis: The prod
Smart Volatility Squeeze MT5 Smart Volatility Squeeze MT5 is a volatility compression and momentum expansion indicator for MetaTrader 5. It builds on John Carter's Volatility Squeeze framework and extends the usual single-tier squeeze into three compression tiers, so you can see not only whether the market is compressed but how tightly it is compressed before it expands. The indicator opens in a separate window and draws two elements: a linear regression momentum histogram and a row of coloured
SV Symbol health
Minh Truong Pham
Inspired investing.com Technical Indicators, this indicator provides a comprehensive view of the symbol by synthesizing indicators including: RSI, StochRSI : have 3 level oversold - red, midle (aqua when upper, pink when lower), overbuy – blue Stoch: oversold – red, overbuy- blue, aqua when main line < signal line, pink when main line > signal line MACD: aqua when main line < signal line, pink when main line > signal line ADX:   aqua when line plus > line minus, pink when line plus < line minus
Visual Heatmap Book Analyzer
Alexandre Moraes De Souza Lima
Visual Heatmap Book Analyser This indicator monitors the market liquidity and generates colors based on order patterns, quantities, and renewal activities in the book. This allows you to visualize the order flow and identify areas of high and low liquidity and activity. The indicator uses machine learning techniques to analyze the order behavior in the book, enabling it to detect patterns and trends in orders, allowing you to make informed decisions about your trading operations. The color pale
'KS Master Tool 12 in 1 Trade with Me'는 여러 가지 트레이딩 도구를 하나의 차트 창 오버레이로 통합한 단일 파일 형태의 MetaTrader 5(MT5)용 사용자 정의 지표입니다. 이 지표는 마스터 스위치를 통해 각 모듈을 완전히 활성화하거나 비활성화할 수 있도록 설계되었습니다. 모듈이 비활성화되면 해당 모듈의 계산, 그래픽 그리기, 타이머 및 차트 이벤트 처리 과정이 완전히 생략되므로, 비활성화된 모듈로 인한 추가 CPU 사용량은 발생하지 않습니다.  모듈 기능 SMC / 피보나치 / 구조 돌파(Structure Break) / FVG / CPR / IB (SMC 기반 차트 패턴) Fair Value Gap (FVG): 라벨 표시 여부, 완화(mitigation) 구간 축소, 이력 표시 제한 설정 가능 구조 돌파 (BOS / CHoCH): 이력 표시, 현재 구조 강조, 몸통 또는 꼬리 기준 돌파 옵션 피보나치 레벨 (5개 레벨 설정 및 표시/숨
Volume Trio Multi is a three-layer market-structure tool for MetaTrader 5: session Volume Profile (POC, VAH/VAL, Value Area), a CVD volume-pressure histogram with a strict Regular divergence engine, and anchored VWAP with standard-deviation bands — extended with a watchlist scanner that runs all three across the symbols in your Market Watch. This is the Pro edition of my free indicator, Volume Trio. The base engine is identical, so this page describes only what Pro adds. For the three layers the
CHoCH + BOS + Hacim Profili — Akıllı Piyasa Yapısı Göstergeleri Gerçek zamanlı piyasa yapısı dağılımı ve canlı hacim analiziyle birleştirilmiş bu gösterge sayesinde piyasa yapısı değişiklikleri (CHoCH) ve yapı kırılmaları (BOS) sinyallerini hem salınım hem de iç yapı üzerinde otomatik olarak tanımlar, emir bloklarını, eşit yüksek/düşük seviyeleri ve likidite hareketlerini işaretler ve alıcı ve bunların en aktif olduğu yerlerde tam olarak canlı bir Hacim Profili görüntüler. "The price will be u
Alexander The Great EA
Syed Jawad Hussain Naqvi
Alexander The Great EA is a premium Expert Advisor developed exclusively for MetaTrader 5. It is designed to automate disciplined trend-following strategies using intelligent market analysis, advanced risk management, and professional trade execution. Unlike traditional Expert Advisors that rely on basic indicator crossovers, Alexander The Great EA combines trend confirmation, execution filters, and structured money management into a reliable automated trading solution. Every component has been
Delta Profile Volume
Teresinha Moraes Correia
기술 설명 – MetaTrader 5용 Delta Profile Delta Profile 은 MetaTrader 5에서 정의된 캔들 범위 내의 거래량 흐름을 세부적으로 분석하기 위해 설계된 지표입니다. 이 도구는 각 가격 수준에서 양의 거래량(상승과 관련) 과 음의 거래량(하락과 관련) 간의 불균형을 구조화하고 시각화합니다. 이를 통해 사용자는 실제로 거래가 집중되는 가격 영역과 시장 불균형이 형성되는 구간을 명확하게 파악할 수 있습니다. 핵심 개념 지표는 가격 레벨 을 인식하고 이를 양의 거래량, 음의 거래량 및 순 델타(양-음 차이)로 분류합니다. 각 가격 레벨은 수평 막대 로 차트에 표시되며, 거래가 집중되는 구간을 직관적으로 보여줍니다. 사용자는 분석할 캔들의 개수 , 가격 반올림 정밀도 , 최대 표시 레벨 수 , 표시 옵션 등을 직접 설정할 수 있습니다. 주요 기능 가격 레벨 매핑 : 사용자가 지정한 자릿수에 맞게 가격을 반올림하여 거래량을 집계합니다. 순 델타 계산 : 양
Volume flow Profile
Israr Hussain Shah
Master Edition은 거래량과 자금 흐름의 관점을 통해 시장 구조를 시각화하도록 설계된 전문가급 분석 도구입니다. 표준 거래량 지표와 달리, 이 도구는 차트에 일일 거래량 프로필을 직접 표시하여 가격 발견이 발생한 위치와 "스마트 머니"가 위치한 곳을 정확하게 볼 수 있게 합니다. 이 Master Edition은 명확성과 속도를 위해 설계되었으며, 로드 시 차트 레이아웃을 즉시 아름답게 만드는 독특한 자동 테마 동기화 시스템을 특징으로 합니다. 주요 기능: 진정한 자금 흐름 계산: 표준 틱 거래량을 넘어섭니다. "Use Money Flow"를 활성화하면 거래량이 가격에 따라 가중치가 부여되어 특정 가격 수준에서의 실제 자본 투입을 드러냅니다. 가치 영역(VA) 시각화: 가치 영역(기본값: 거래량의 70%)을 자동으로 계산합니다. VA Fill: 통제 구역을 즉시 식별하기 위해 가치 영역 배경을 음영 처리합니다. 주요 수준: 통제점(POC), 가치 영역 고점(VAH), 가치 영
Reverse Strike
Antonio Gutemberg Frota
Reverse Strike – Professional Gold Reversal Indicator for MetaTrader 5 EXPERT:  Reverse Strike expert Reverse Strike is a professional MetaTrader 5 indicator designed to identify high-probability reversal opportunities on XAUUSD and other trading symbols. Built with ATR trailing stop logic, linear regression analysis, and multi-timeframe confirmation, it helps traders detect potential market turning points with clarity and precision. Instead of simply following the existing trend, Reverse Stri
VPDemandSupply
Xavier Gregory Yvon Remy Boussougant
Cet indicateur combine plusieurs outils d'analyse technique avancée sur un seul graphique. Il est conçu pour identifier les zones clés de prix, les niveaux de liquidité et les retracements potentiels. Double ZigZag Deux ZigZag superposés avec des sensibilités différentes. Le ZZ1 (argent, rapide) détecte la structure de marché à court terme, tandis que le ZZ2 (or, lent) identifie la tendance principale . Ensemble ils permettent de lire le marché sur deux niveaux simultanément. Zones Supply & Dem
https://www.mql5.com/tr/users/bilisimprofesoru/seller ProTrader Toolbox EA  Multi-Asset • Multi-Strategy Trading Toolkit ProTrader Toolbox EA is a flexible MetaTrader 5 Expert Advisor designed for traders who want to build and manage different trading approaches from a single system. With more than 100 configurable inputs, the EA combines entry timing, grid management, trend filters, risk controls, multiple take-profit methods, manual trade takeover, market analysis, mobile notifications, and l
Nspikes Sniper R2 Premium Edition for MT5 Nspikes Sniper R2 Premium Edition is a technical indicator designed for Boom 1000/500/900/600 and Crash 1000/500/900/600 indices. It integrates liquidity zone detection, session filters, and a 3-step recovery entry visual layout directly on MetaTrader 5 charts. Key Features: - Automatic Instrument Detection: Identifies whether the current chart is Boom or Crash and applies the corresponding logic. - Timeframe Optimization: Formatted for M1 and M5 time
HTF FVG Scanner – MT5용 페어밸류갭 인디케이터 상위 타임프레임(H1, H4, D1, 주봉)의 FVG(공정가격갭)를 M5 또는 M15 차트에 직접 표시합니다. 창을 전환하거나 수동으로 표시할 필요가 없습니다. 대부분의 FVG 인디케이터는 현재 타임프레임만 스캔합니다. 이 인디케이터는 다르게 작동합니다. 선택한 상위 타임프레임에서 갭을 읽어 실시간으로 현재 차트에 그려줍니다. M15 차트에 H4 갭, H1에 D1 갭, H4에 주봉 갭을 표시할 수 있습니다. 영역은 스크롤, 확대/축소, 심볼 변경 시에도 정렬된 상태를 유지합니다. 매 틱마다가 아니라 상위 타임프레임 봉이 마감될 때 업데이트됩니다. 각 영역 표시:   강세 FVG(BISI) 및 약세 FVG(SIBI), 50% CE 라인, 타임프레임 및 핍 단위 갭 크기 라벨, 완화 상태, 컨플루언스 마커, 반전 FVG(IFVG), 최근접 영역 하이라이트. 대화형 제어판   을 차트에 표시.   원클릭 프리셋:   스캘프(
No Chase Entry Filter
Mohamed Amr Mohamed Osama Abdelwahab
No Chase Entry Filter - 늦지 않는 진입 손실이 나는 거래의 상당수는 방향이 틀린 것이 아닙니다. 늦은 것입니다. 아이디어는 옳았지만 진입은 움직임이 이미 끝난 뒤에 이루어졌고, 더 나은 가격이었다면 견뎠을 평범한 되돌림에 손절이 걸립니다. No Chase Entry Filter 는 시장 구조를 기준으로 매수와 매도 진입을 표시하고, 나쁜 가격에 잡히는 진입은 걸러냅니다. 녹색 점은 여기서 매수하라는 뜻이고, 빨간 점은 여기서 매도하라는 뜻입니다. 색이 있는 수평선은 거래를 종료할 위치를 나타냅니다. 각 점 뒤에서는 다섯 가지 독립 검사가 진입 품질을 0 에서 100 으로 채점하며, 가격이 이미 과도하게 늘어난 상태에서 나온 신호는 표시하지 않고 억제합니다. 신호가 만들어지는 방식 방향은 시장 구조에서 나옵니다. 확정된 직전 구조 고점 위에서 봉이 마감하면 매수가, 확정된 직전 구조 저점 아래에서 봉이 마감하면 매도가 발생합니다. 전환점은 양쪽에 필요한 수
Floating DD Tracker — Free Risk Monitoring Indicator for MT5 Floating DD Tracker is a lightweight and professional MetaTrader 5 indicator designed to help traders monitor real-time floating drawdown directly on the chart. The indicator continuously tracks your current floating drawdown, records the highest drawdown reached, and displays the historical maximum DD with the exact date and time it occurred. Its compact neon-style dashboard is optimized for all chart sizes and provides instant visual
FREE
Apex Signal Engine 트렌드 클라우드, 리스크 관리 및 멀티 타임프레임 대시보드를 갖춘 고급 멀티 시그널 인디케이터 변화하는 시장 상황에서 신뢰할 수 있는 진입점을 찾으려면 단일 인디케이터 이상이 필요합니다. 대부분의 트레이더는 차트에 여러 도구를 겹쳐 놓고 모순되는 신호를 해석하느라 고군분투하며, 그 사이에 기회는 사라집니다. Apex Signal Engine은 추세 감지, 다중 유형 신호 생성, 풀백 진입, 동적 리스크 관리 및 멀티 타임프레임 분석을 MetaTrader 5용 하나의 강력한 인디케이터로 통합하여 이 문제를 해결합니다. 일봉 차트에서의 스윙 트레이딩, H1에서의 데이 트레이딩, M5에서의 스캘핑 등 어떤 스타일이든 Apex Signal Engine은 3가지 내장 프리셋과 5가지 조합 가능한 필터로 여러분의 트레이딩 스타일에 적응합니다. 자세히 보기: 상세 설정 가이드 (English) 한정 혜택: 처음 50회 다운로드는 무료입니다! 이후에는 유료 제품이
Optimized Trend Tracker OTT is an indicator that provides traders to find an existing trend or in another words to ser which side of the current trend we are on. We are under the effect of the uptrend in cases where the prices are above OTT , under the influence of a downward trend, when prices are below OTT it is possible to say that we are. The first parameter in the OTT indicator set by the two parameters is the period/length. OTT will be much sensitive to trend movements if it is sma
Apex Heikin Ashi Pro V1.0 (개발자: Brijesh Jaiswal)는 리페인트 없는(non-repaint) 매수/매도 화살표, SuperTrend 확인, 로열 캔들 컬러, 다크 차트 스타일링, 알림 기능 및 빠른 트렌드 읽기를 위한 전문적인 대시보드를 갖춘 MT5 전용 프리미엄 평균足(Heikin Ashi) 트렌드 지표입니다. Apex Heikin Ashi Pro 는 MetaTrader 5 차트에서 트렌드 방향, 트렌드 변화 및 강력한 매수/매도 기회를 더 깔끔하게 식별하고자 하는 트레이더를 위해 설계되었습니다. 화면을 혼란스러운 신호로 채우는 대신, 이 지표는 평균足 트렌드 구조와 SuperTrend 기반의 트렌드 확인을 사용하여 필터링된 고품질 시각적 확인에 집중합니다. 이 지표는 동일 트렌드 캔들 컬러링을 사용하여 차트가 시각적으로 차분하고 읽기 쉬운 상태를 유지합니다. 트렌드가 바뀔 때 특정 반전 캔들이 특수한 핑크색으로 강조 표시되어 트레이더가 시장 방
Market Projection Pro — MT5 Want to visualize how the price cycles in your chosen chart section could extend? Market Projection Pro analyzes a historical window you select, extracts cycle components and draws a composite projection to its right. You control the source window and forward horizon to compare the scenario with price structure and potential turning zones. What you see on the chart Interactive boundaries let you select a historical analysis window directly on the chart. Cycle componen
Eng Gold
Ely Alkrar Xshkaky
ENG-GOLD Scalper It is an auxiliary indicator that identifies potential targets and determines the place of entry with a stop loss that works on Heiken Ashi candles  The green lines are usually the targets, the red lines are the stop loss, and the yellow lines are the entry location.  This file is recognized on small and medium frames, usually less than the watch frame I highly recommend using XAUUSD Nasdaq100 Dow30 USOIL 
Forex Round Levels PRO
Hericlezia Andrade Assuncao
Take your Forex chart analysis to the next level with FOREX ROUND LEVELS PRO — a professional indicator designed exclusively for currency pairs. Identify important psychological round-number levels automatically and visualize Main, Intermediate, and Minor levels directly on your MT5 chart. KEY FEATURES Automatic Level Detection — automatically adapts the level system to the currency pair you are trading. Main Psychological Levels — highlights major round-number areas with strong visual emphasis.
Sinal IFR
Aurenice Barros De Abreu Carvalho
Sinal com base no indicador RSI, que indica compra marcando com uma seta verde quando o preco sai da região de sobrevendido, e sinaliza venda quando o preco sai da regiao de sobrecomprado. A sinalizacão é  feita com uma seta verde para compra e seta rosa para venda. Permite configurar o nível de sobrecompra e de sobrevenda, além do período do RSI. Funciona em qualquer período gráfico.
이 제품의 구매자들이 또한 구매함
Trend Sniper X
Sarvarbek Abduvoxobov
4.9 (42)
Trend Sniper X 는 트레이더가 추세 방향과 잠재적 반전 지점을 명확하고 정확하게 포착할 수 있도록 도와주는 MetaTrader 5용 멀티 타임프레임 추세 추종 지표입니다. MT4용: https://www.mql5.com/en/market/product/193245 가격 정보: 현재 가격은 프로모션 할인가이며, 향후 업데이트 및 새로운 기능이 출시됨에 따라 변동될 수 있습니다. 보너스 혜택: 본 지표 전용 무료 자동매매 Assistant EA를 받으시려면 구매 후 작성자에게 메시지를 보내주시기 바랍니다. Code2Profit 채널 멀티 타임프레임 분석으로 시장을 마스터하세요! Trend Sniper X로 승률을 극대화하는 방법: 핵심 규칙 및 세션 팁 기술 사양 플랫폼 MetaTrader 5 지표 유형 멀티 타임프레임 추세 지표 운용 타임프레임 모든 차트 타임프레임 지원, 독립적으로 선택 가능한 상위 타임프레임(M1–MN1) 주요 상품 외환, 금(XAUUSD) 및 기타 C
M1 Sniper MT5
Oleg Rodin
5 (7)
M1 SNIPER 는 사용하기 쉬운 거래 지표 시스템입니다. M1 시간대에 맞춰 설계된 화살표 지표입니다. 이 지표는 M1 시간대 스캘핑을 위한 단독 시스템으로 사용할 수 있으며, 기존 거래 시스템의 일부로도 사용할 수 있습니다. 이 거래 시스템은 M1 시간대 거래용으로 특별히 설계되었지만, 다른 시간대에도 사용할 수 있습니다. 원래는 XAUUSD와 BTCUSD 거래를 위해 이 방법을 설계했지만, 다른 시장 거래에도 유용하다는 것을 알게 되었습니다. 이 지표의 신호는 추세 방향과 반대로 거래될 수 있습니다. 저는 지표의 신호를 활용하여 양방향으로 거래할 수 있도록 돕는 특별한 거래 기법을 알려드립니다. 이 방법은 특별한 동적 지지선과 저항선 가격 영역을 활용하는 것을 기반으로 합니다. 구매하시면 M1 SNIPER 화살표 지표를 바로 다운로드하실 수 있습니다. 또한, 아래 스크린샷에 표시된 Apollo Dynamic SR 지표는 M1 SNIPER 도구를 사용하는 모든 사용자에게 무료로
Boba Analysis Suite
Trade Ready Solutions LLC
Boba Analysis Suite Boba Analysis Suite는 MetaTrader 5용 분석 지표입니다. 시장 구조, 주요 가격 영역, 전반적인 시장 상황을 하나의 차트 화면에 통합하여 표시합니다. 트레이더이자 트레이딩 코치로서의 실무 경험을 바탕으로 개발되었으며, 시장 방향 평가, 주요 가격 수준 식별, 여러 시간대의 종합적인 분석 등 체계적인 분석 과정을 지원합니다. 시장 맥락을 고려한 분석 개별 신호의 의미는 시장 상황에 따라 달라집니다. Boba Analysis Suite는 현재 차트 상황을 더 넓은 시장 구조와 연결하고, 사전에 정한 규칙에 따라 매매 아이디어를 검토할 수 있도록 돕습니다. 주요 분석 기능은 다음과 같습니다. 추세 및 시장 구조: 시장 방향과 관련 구조적 맥락을 평가합니다. 주요 가격 영역 및 수준: 추가 분석이 필요한 중요한 영역을 차트에 시각적으로 표시합니다. 여러 시간대: 서로 다른 시간대의 정보를 통합하여 전반적인 시장 상황을 평가합니다.
Entry Points Pro for MT5
Yury Orlov
4.52 (152)
전설이 돌아왔습니다: Entry Points Pro 10. MQL5 마켓 Top-3 자리를 3년간 지켜온 전설적인 지표의 재출시입니다. 수백 개의 호평 리뷰(두 버전 합산 589개), 매일 이 지표로 거래하는 수천 명의 트레이더, 31,000회 이상의 데모 다운로드   MT4+MT5 . 지난 5년간 여러분이 남긴 리뷰를 하나도 빠짐없이 읽었고, 약속 대신 그 답을 버전 10에 담았습니다. 1999년부터 시장에서 활동하며 정직함과 자신의 평판, 그리고 고객을 소중히 여기는 개발자가 만들었습니다. Entry Points Pro의 진입 시그널은 절대 리페인팅되지 않습니다. 그리고 이번에는 개발자의 말뿐이 아니라 검증 가능한 사실입니다: 확정 시그널은 캔들 종가에서만 표시되며, 자동화 테스트에서 리페인팅 0건 이 확인되었습니다(EURUSD, XAUUSD, BTCUSD에서 2,486,568회의 불변조건 검사 — 위반 0건). 검증 방법은 공개되어 있으니 전략 테스터에서 직접 재현해 보실 수
Auto Optimized SpeedAngle 은 지속적인 워크포워드 최적화(Walk-Forward Optimization, WFO)를 통해 곡선 적합(curve-fitting)을 제거한 기관 수준의 모멘텀 벡터화 시스템입니다. 시장 체제가 바뀔 때 성능이 떨어지는 정적 입력에 의존하는 대신, 이 지표는 표본 외(Out-of-Sample, OOS) 검증을 사용하여 매개변수를 동적으로 재보정하며, 표시되는 신호가 과거의 우연이 아닌 진정한 통계적 우위를 나타내도록 보장합니다. 핵심 기관용 프레임워크 워크포워드 최적화 엔진: 핵심 알고리즘은 수천 가지의 룩백(lookback) 및 임계값 조합을 지속적으로 스캔하며, 데이터를 인샘플(in-sample)과 표본 외(out-of-sample) 세트로 엄격하게 분리합니다. 미지의 데이터 환경에서 수학적 우수성이 증명된 경우에만 새로운 매개변수 구성을 채택합니다. 정량적 목적 함수: 순수한 총이익을 쫓는 대신, 최적화 엔진은 기관 수준의 안정성
Neuro Poseidon MT5
Daria Rezueva
4.75 (52)
Neuro Poseidon is a new indicator by Daria Rezueva. It combines precise trading signals with adaptive TP/SL levels - creating best possible trades as a result! Message me and get  Neuro Poseidon Assistant  as a gift to automize your trading process! What makes it stand out? 1. Proven profitability on all assets and timeframes 2. Only confirmed BUY and SELL signals present on the chart 3. Adaptive TP & SL levels generated by the software for each trade 4. Easy to understand - suitable for al
ARIPoint
Temirlan Kdyrkhan
1 (4)
ARIPoint is a powerful trading companion designed to generate high-probability entry signals with dynamic TP/SL/DP levels based on volatility. Built-in performance tracking shows win/loss stats, PP1/PP2 hits, and success rates all updated live. Key Features: Buy/Sell signals with adaptive volatility bands Real-time TP/SL/DP levels based on ATR Built-in MA Filter with optional ATR/StdDev volatility Performance stats panel (Success, Profit/Loss, PP1/PP2) Alerts via popup, sound, push, or email Cu
Adaptive Price Action Engine 지표를 구매하면 EA(자동매매 프로그램)가 무료 멀티 타임프레임 기반 자기 최적화 추세 & 캔들 패턴 분석 시스템 시장은 끊임없이 변화하며, 모든 Price Action 패턴이 모든 시장 환경에서 동일한 가치를 가지는 것은 아닙니다. Adaptive Price Action Engine 은 변화하는 시장 환경에 적응할 수 있도록 설계되었으며, 추세 구조, 멀티 타임프레임 분석, 캔들 패턴 및 통계적 최적화 를 하나의 분석 프레임워크로 결합합니다. 두 가지 적응형 모드 Dual Alpha Trend Mode 낮은 타임프레임과 높은 타임프레임에서 적합한 Alpha Trend 파라미터를 자동으로 탐색하여, 최근 시장 움직임에 맞춰 추세 분석을 조정합니다. Candlestick + Alpha Mode Alpha Trend를 통한 시장 국면 분석과 22개의 상승 및 하락 캔들 패턴 을 결합합니다. 모든 패턴을 동일하게 취급하는 대신, 다양
Gann Made Easy MT5
Oleg Rodin
5 (12)
Gann Made Easy 는 mr.의 이론을 사용하여 최고의 거래 원칙을 기반으로 하는 전문적이고 사용하기 쉬운 Forex 거래 시스템입니다. W.D. 간. 이 표시기는 Stop Loss 및 Take Profit Levels를 포함하여 정확한 BUY 및 SELL 신호를 제공합니다. PUSH 알림을 사용하여 이동 중에도 거래할 수 있습니다. 구매 후 거래 방법 안내 및 유용한 추가 지표를 무료로 받으시려면 저에게 연락주세요! 아마도 Gann 거래 방법에 대해 이미 여러 번 들었을 것입니다. 일반적으로 Gann의 이론은 초보자 거래자뿐만 아니라 이미 거래 경험이 있는 사람들에게도 매우 복잡한 것입니다. Gann의 거래 방식은 이론적으로 적용하기 쉽지 않기 때문입니다. 나는 그 지식을 연마하고 Forex 지표에 최고의 원칙을 적용하기 위해 몇 년을 보냈습니다. 표시기는 적용하기가 매우 쉽습니다. 차트에 첨부하고 간단한 거래 권장 사항을 따르기만 하면 됩니다. 지표는 지속적으로 시장 분석
Scalper Vault MT5
Oleg Rodin
5 (1)
Scalper Vault는 당일 매매(intraday trading)에서 일관된 성과를 내고자 하는 트레이더를 위해 설계된, 강력하고 모든 기능을 갖춘 트레이딩 시스템입니다. 이 고정밀 지표는 외환(Forex) 및 바이너리 옵션 트레이더 모두에게 기관급 분석을 제공하는 독립적인 종합 트레이딩 시스템 역할을 합니다. 구매 후 저에게 연락해 주시면, 트레이딩 팁과 함께 특별한 보너스를 제공해 드립니다! Scalper Vault는 추측에 의존하거나 복잡한 수동 분석을 할 필요를 없애주며, 사용하기 쉬운 트레이딩 기법을 통해 오직 매매 실행에만 집중할 수 있도록 돕습니다. 정확한 추세 추종 신호: 핵심 알고리즘이 시장 구조를 분석하여, 지배적인 시장 추세 방향과 일치하는 고확률 신호만을 제공함으로써 잘못된 진입을 획기적으로 줄여줍니다. 정밀한 고점 및 저점 탐지: 시장의 움직임이 소진되는 지점을 스캔하여 잠재적인 반전 구간을 식별합니다. 간(Gann) 이론 기반의 매수/매도 구간: 수학적
Divergence Bomber
Ihor Otkydach
4.89 (94)
이 지표를 구매하신 분께는 다음과 같은 혜택이 무료로 제공됩니다: 각 거래를 자동으로 관리하고, 손절/익절 수준을 설정하며, 전략 규칙에 따라 거래를 종료하는 전용 도우미 툴 "Bomber Utility" 다양한 자산에 맞게 지표를 설정할 수 있는 셋업 파일(Set Files) "최소 위험", "균형 잡힌 위험", "관망 전략" 모드로 설정 가능한 Bomber Utility의 셋업 파일 이 전략을 빠르게 설치, 설정, 시작할 수 있도록 돕는 단계별 영상 매뉴얼 주의: 위의 모든 보너스를 받기 위해서는 MQL5 개인 메시지 시스템을 통해 판매자에게 연락해 주세요. 독창적인 커스텀 지표인 “Divergence Bomber(다이버전스 봄버)”를 소개합니다. 이 지표는 MACD 다이버전스(괴리) 전략을 기반으로 한 올인원(All-in-One) 거래 시스템입니다. 이 기술 지표의 주요 목적은 가격과 MACD 지표 간의 다이버전스를 감지하고, **향후 가격이 어느 방향으로 움직일지를 알려주
PainX GainX Blue Spike Fusion AI Advanced Synthetic Index Spike Detection Indicator for MetaTrader 5 Discover potential spike setups with a clear, organized, and professional trading interface. PainX GainX Blue Spike Fusion AI is a specialized indicator designed for traders who monitor synthetic indices and want a structured way to observe potential price spike opportunities. The indicator combines signal monitoring, market-condition analysis, visual alerts, and event tracking in one convenient
Quantum TrendPulse
Bogdan Ion Puscasu
5 (26)
SuperTrend   ,   RSI   ,   Stochastic   의 힘을 하나의 포괄적인 지표로 결합하여 트레이딩 잠재력을 극대화하는 궁극의 트레이딩 도구   인 Quantum TrendPulse를   소개합니다. 정밀성과 효율성을 추구하는 트레이더를 위해 설계된 이 지표는 시장 추세, 모멘텀 변화, 최적의 진입 및 종료 지점을 자신 있게 식별하는 데 도움이 됩니다. 주요 특징: SuperTrend 통합:   주요 시장 추세를 쉽게 따라가고 수익성의 물결을 타세요. RSI 정밀도:   매수 과다 및 매도 과다 수준을 감지하여 시장 반전 시점을 파악하는 데 적합하며 SuperTrend 필터로 사용 가능 확률적 정확도:   변동성이 큰 시장에서 숨겨진 기회를 찾기 위해 확률적 진동   을 활용하고 SuperTrend의 필터로 사용 다중 시간대 분석:   M5부터 H1 또는 H4까지 다양한 시간대에 걸쳐 시장을 최신 상태로 유지하세요. 맞춤형 알림:   맞춤형 거래 조건이 충족되면
Advanced Supply Demand MT5
Bernhard Schweigert
4.53 (15)
현재 33% 할인! 초보자나 전문 트레이더를 위한 최고의 솔루션! 이 보조지표는 우리가 다수의 독창적 기능과 새로운 공식을 통합한 독특하고 고품질이며 저렴한 거래 도구입니다. 이 업데이트를 통해 이중 시간대를 표시할 수 있습니다. 더 높은 TF를 표시할 수 있을 뿐만 아니라 차트 TF와 더 높은 TF 모두를 표시할 수 있습니다: 중첩 영역 표시. 모든 Supply Demand 트레이더들이 좋아할 것입니다. :) 중요한 정보 공개 Advanced Supply Demand의 잠재력을 극대화하려면 다음을 방문하십시오. https://www.mql5.com/ko/blogs/post/720245   진입 또는 목표의 명확한 트리거 포인트를 정확히 찾아냄으로 해서 거래가 어떻게 개선될지 상상해 보십시오. 새로운 알고리즘을 기반으로 매수자와 매도자 간의 잠재적인 불균형을 훨씬 더 쉽게 분간할 수 있습니다. 왜냐하면 가장 강한 공급영역과 가장 강한 수요 영역과 과거에 어떻게 진행 되었는지를(이전
Btmm state engine pro
Garry James Goodchild
5 (4)
BTMM State Engine Pro by G-Labs — Beat The Market Maker indicator for MetaTrader 5. Asian session range, London and New York kill zones, level progression (L1/L2/L3), peak formation detection (PFH/PFL), entry signals, and a multi-pair scanner from one chart. Stop scanning charts one pair at a time. The State Engine tracks the BTMM daily cycle automatically — Asian box, room boundaries, level blocks, peak formations, and filtered entries — while the scanner dashboard shows level, peak status, d
PZ Divergence Trading MT5
PZ TRADING SLU
3.71 (7)
Unlock hidden profits: accurate divergence trading for all markets Tricky to find and scarce in frequency, divergences are one of the most reliable trading scenarios. This indicator finds and scans for regular and hidden divergences automatically using your favourite oscillator. [ Installation Guide | Update Guide | Troubleshooting | FAQ | All Products  ] Easy to trade Finds regular and hidden divergences Supports many well known oscillators Implements trading signals based on breakouts Displays
Gartley Hunter Multi
Siarhei Vashchylka
5 (12)
Gartley Hunter Multi - An indicator for searching for harmonic patterns simultaneously on dozens of trading instruments and on all possible timeframes. Manual (Be sure to read before purchasing) | Version for MT4 Advantages 1. Patterns: Gartley, Butterfly, Shark, Crab. Bat, Alternate Bat, Deep Crab, Cypher 2. Simultaneous search for patterns on dozens of trading instruments and on all possible timeframes 3. Search for patterns of all possible sizes. From the smallest to the largest 4. All fou
Volatility Master for MetaTrader is a real-time dashboard tool that scans up to  50 symbols  to identify high-volatility , trending markets instantly. With bullish/bearish signals, customizable alerts, and a user-friendly interface, it helps you avoid range-bound conditions and focus on high-probability trades. Clarity leads to confidence. Trade confidently and protect your capital effectively with this powerful dashboard. We don't offer free or bonus indicators in exchange of reviews from you.
Advanced Currency Strength28 MT5
Bernhard Schweigert
5 (3)
초보자 또는 전문가 트레이더를 위한 최고의 솔루션! 이 지표는 우리가 독점 기능과 새로운 공식을 통합했기 때문에 독특하고 고품질이며 저렴한 거래 도구입니다. 단 하나의 차트로 28 Forex 쌍의 통화 강도를 읽을 수 있습니다! 새로운 추세 또는 스캘핑 기회의 정확한 트리거 포인트를 정확히 찾아낼 수 있기 때문에 거래가 어떻게 개선될지 상상해 보십시오. 사용 설명서: 여기를 클릭  https://www.mql5.com/en/blogs/post/697384 그것이 첫 번째, 원본입니다! 쓸모없는 지망생 클론을 사지 마십시오. 더 스페셜  강력한 통화 모멘텀을 보여주는 하위 창의 화살표 GAP가 거래를 안내합니다! 기본 또는 호가 통화가 과매도/과매도 영역(외부 시장 피보나치 수준)에 있을 때 개별 차트의 기본 창에 경고 표시가 나타납니다. 통화 강도가 외부 범위에서 떨어질 때 풀백/반전 경고. 교차 패턴의 특별 경고 추세를 빠르게 볼 수 있는 다중 시간 프레임 선택이 가능합
초보자 또는 전문가 트레이더를 위한 최고의 솔루션! 이 지표는 우리가 독점 기능과 비밀 공식을 통합했기 때문에 독특하고 고품질이며 저렴한 거래 도구입니다. 단 하나의 차트로 28개 통화 쌍 모두에 대한 경고를 제공합니다. 새로운 추세 또는 스캘핑 기회의 정확한 트리거 포인트를 정확히 찾아낼 수 있기 때문에 거래가 어떻게 개선될지 상상해 보십시오! 새로운 기본 알고리즘을 기반으로 구축되어 잠재적인 거래를 훨씬 더 쉽게 식별하고 확인할 수 있습니다. 이는 통화의 강세 또는 약세가 가속되는지 여부를 그래픽으로 표시하고 가속 속도를 측정하기 때문입니다. 자동차의 속도계처럼 생각하면 됩니다. 가속화할 때 Forex 시장에서 동일한 일이 분명히 더 빠르게 발생합니다. 즉, 반대 방향으로 가속화되는 통화를 페어링하면 잠재적으로 수익성 있는 거래를 식별한 것입니다. 통화 모멘텀의 수직선과 화살표가 거래를 안내합니다! 역동적인 Market Fibonacci 23 레벨은 경고 트리거로 사용되며
Trend Lines PRO MT5
Roman Podpora
5 (1)
트렌드 라인즈 프로       이 지표는 시장이 실제로 어떤 방향으로 전환되는지 파악하는 데 도움이 됩니다. 실제 추세 반전 지점과 주요 시장 참여자들이 다시 진입하는 지점을 보여줍니다. 보시다시피       BOS 라인       복잡한 설정이나 불필요한 노이즈 없이 더 높은 시간대의 추세 변화와 주요 레벨을 확인할 수 있습니다. 신호는 차트에 다시 그려지지 않고 캔들이 마감된 후에도 계속 표시됩니다. VERSION MT 4   -   RFI LEVELS PRO   표시기   와 결합할 때 최대 잠재력을 발휘합니다. 지표가 보여주는 내용: 실제 변화       추세(BOS 라인) 한 번 신호가 나타나면 그 신호는 계속 유효합니다! 이는 신호를 발생시킨 후 변경될 수 있는 리페인팅 방식의 지표와 중요한 차이점입니다. 리페인팅 방식의 지표는 잠재적으로 자금 손실로 이어질 수 있습니다. 이제 더욱 높은 확률과 정확도로 시장에 진입할 수 있습니다. 또한 화살표가 나타난 후 목표가(익절)
Naked Forex Big Shadow indicator for MT5
Renaud Herve Francois Candel
5 (1)
Naked Forex Big Shadow Indicator Big Shadow Indicator is a pattern recognition indicator for Forex, Stocks, Indices, Futures, Commodities and Cryptos. When you have a Big Shadow on your chart then this is a strong signal meaning that you might be ahead of a reversal. You can take other elements (momentum, trend, volatility, price action, fundamentals) to build a complete strategy and confirm your entries. Beware that you might not make money just following the arrows generated by the pattern re
통화 강도 마법사는 성공적인 거래를 위한 올인원 솔루션을 제공하는 매우 강력한 지표입니다. 표시기는 여러 시간 프레임의 모든 통화 데이터를 사용하여 이 또는 해당 외환 쌍의 힘을 계산합니다. 이 데이터는 특정 통화의 힘을 확인하는 데 사용할 수 있는 사용하기 쉬운 통화 지수 및 통화 전력선의 형태로 표시됩니다. 필요한 것은 거래하려는 차트에 표시기를 부착하는 것뿐입니다. 표시기는 거래하는 통화의 실제 강세를 보여줍니다. 지표는 또한 추세와 거래할 때 유리하게 사용할 수 있는 구매 및 판매 거래량 압력의 극한값을 보여줍니다. 지표는 또한 피보나치에 기반한 가능한 대상을 보여줍니다. 표시기는 PUSH 알림을 포함한 모든 유형의 알림을 제공합니다. 구매 후 연락주세요. 나는 당신과 거래 팁을 공유하고 당신에게 무료로 훌륭한 보너스 지표를 줄 것입니다! 나는 당신에게 행복하고 유익한 거래를 기원합니다!
ICT PO3 (Power of 3) AMD Protocol Framework Indicator True Time & Structure Integration   |  Non-Repainting | Real-Time  | Multi-Asset  | MT4 Version Available Full Setup Guide & Strategy Playbook: https://www.mql5.com/en/blogs/post/768683 The ICT Power of Three (PO3): The Complete Guide to Accumulation, Manipulation, and Distribution https://www.mql5.com/en/blogs/post/771729 MT4 Version: https://www.mql5.com/en/market/product/171742 Indicator Overview The ICT PO3 AMD Protocol Framework i
RelicusRoad Pro MT5
Relicus LLC
4.96 (25)
거래를 더 이상 감으로 하지 마세요. 언제 진입할지, 어디서 청산할지, 시장이 어느 쪽으로 기울어 있는지를 한 차트에서 확인하세요. RelicusRoad Pro는 20개 가까운 도구를 인디케이터 하나에 담았고, 내 매매 방식에 맞는 도구만 켜서 쓰면 됩니다. 명확한 진입. 명확한 청산. 차트마다 확실한 계획. 이런 경험, 익숙하지 않으신가요? 매수하면 1분 뒤 가격이 반대로 돌아섭니다. 너무 일찍 청산하고, 그다음 움직임이 나 없이 이어지는 것을 지켜봅니다. 지표를 5개 띄우면 답도 5가지가 나옵니다. 손절(스톱로스)은 그냥 감입니다. 우리가 이걸 만든 이유 우리는 18년 동안 외환 거래를 해 왔습니다. RelicusRoad는 처음에 우리끼리 쓰려고, 전문 트레이더 모임을 위해 비공개로 만들었습니다. 이유는 개인적이었습니다. 같은 선을 손으로 계속 그리는 일에 지쳤고, 스스로 정한 규칙을 어기고, 차트에서 정말 중요한 한 가지를 놓치곤 했습니다. 우리에게 통한 것은 일관성입니다. 매
CGE Trading Suite
Carl Gustav Johan Ekstrom
5 (2)
Institutional-Grade Analytics for MT5 The full analytical edge of a professional trading desk, built into your MT5 chart. Standard retail platforms lack the depth required for professional market analysis. The CGE Trading Suite bridges this gap, transforming MetaTrader 5 into a comprehensive workspace. By integrating 22 proprietary modules into a single, unified chart interface, the suite eliminates fragmented analysis. It provides definitive clarity across market structure, timing, momentum,
Bill Williams Advanced
Siarhei Vashchylka
5 (11)
Bill Williams Advanced is designed for automatic chart analysis using Bill Williams' "Profitunity" system. The indicator analyzes four timeframes at once. Manual (Be sure to read before purchasing) Advantages 1. Analyzes the chart using Bill Williams' "Profitunity" system. Signals are displayed in a table in the corner of the screen and on the price chart. 2. Finds all known AO and AC signals, as well as zone signals. Equipped with a trend filter based on the Alligator. 3. Finds "Divergence Bar
안녕하세요, 트레이더 여러분! 많은 개인 투자자들이 느린 웹 스크립트에 의존하고 있습니다. 수익성 있는 거래를 위해서는 체계적인 프레임워크가 필수적입니다. Astro AI 지표는 단순한 차트 오버레이가 아닙니다. 터미널에서 직접 실행되는 두 개의 에이전트로 구성된 정교한 신경망입니다. 시스템 기술 상세 설명: 1. 에이전트 1: 분석가 (그래픽 신경망 – GNN) 시장은 개별 가격 막대로 이루어진 것이 아니라 상호 연결된 데이터 네트워크입니다. 기능: 에이전트 1은 그래픽 신경망을 사용하여 이러한 복잡하고 비선형적인 관계를 파악합니다. 장점: 기존 지표는 과거 이동 평균만을 고려하는 반면, 저희 GNN은 시장의 심층적인 구조적 관계를 실시간으로 처리하여 개별 트레이더의 거래량이 시장에 큰 영향을 미치기 전에 숨겨진 상관관계를 찾아냅니다. 2. 에이전트 2: 실행기 (근접 전략 최적화 – PPO) 패턴 인식은 절반의 성공일 뿐입니다. 현재 시장 변동에 기반하여 올바른
Superhero
Ihor Otkydach
5 (3)
SUPERHERO 지표는 “올인원” 방식으로 설계된 다중 통화 거래 시스템입니다. 이 지표는 시장을 독자적으로 분석하여 포지션을 개설하고 청산할 시점에 대한 신호를 제공합니다. 손절매(Stop Loss) 및 익절(Take Profit) 주문을 활용하며, 위험 대비 수익 비율(R:R)은 1:1입니다. 이 시스템은 스마트폰으로 푸시 알림을 전송할 수 있으므로, PC에 묶여 있을 필요 없이 “이동 중에도” 매매를 할 수 있습니다. 이는 자체 거래 전문 회사에 안성맞춤입니다. 모든 고객님께 드리는 특별 혜택: 이 지표를 구매하시는 모든 분께는 제가 특별히 준비한 유틸리티를 선물로 드릴 예정이며, 이 유틸리티는 다음과 같은 기능을 제공합니다: 손절매 및 익절 주문을 자동으로 설정합니다 가격이 목표 수준에 도달하면 자동으로 포지션을 청산합니다 미결제 주문 거래를 지원합니다 평균화 거래 모드를 지원합니다 이 훌륭하고 매우 편리한 유틸리티를 선물로 받고 싶으시다면, SUPERHERO 지표를 구매하
차세대 외환 거래 도구. Dynamic Forex28 Navigator 는 오랫동안 인기를 끌어온 저희 인디케이터의 진화형으로, 세 가지 제품의 강력한 기능을 하나로 통합했습니다: Advanced Currency Strength28 Indicator (700개 리뷰) Advanced Currency IMPULSE with ALERT (530개 리뷰) CS28 Combo Signals (최근 보너스) 이제 MetaTrader 5 용으로 완전히 재구축되었습니다 – 더 빠르고, 더 부드러우며, MT5의 네이티브 멀티 심볼 아키텍처를 활용하도록 설계되었습니다. 사용자 매뉴얼: https://www.mql5.com/en/blogs/post/758844 MT4 버전을 찾으시나요? 여기를 클릭하세요: https://www.mql5.com/en/market/product/122172 차세대 강도 인디케이터가 제공하는 것 원본에서 사랑받았던 모든 기능이 새로운 기능과 더 높은 정밀도로 강화되었습니다
제작자의 제품 더 보기
Smart Chandelier Exit EA Smart Chandelier Exit EA is the Expert Advisor for the Smart Chandelier Exit indicator. It runs the indicator's chandelier engine by itself, with the same formula, the same default settings and the same fake-flip confirmation, and turns the confirmed flips into trades. A flip is traded only when it agrees with the higher timeframe, and every position carries a stop on the broker's server that follows the chandelier line and is never loosened. By default there is no fixed
Smart Chandelier Exit
Bugra Kaan Yildirim
5 (3)
Smart Chandelier Exit  Smart Chandelier Exit is an adaptive trailing-stop and trend-direction indicator. It plots a multi-layer ratchet stop line that follows price: green below price in an uptrend, red above price in a downtrend. The line only ever ratchets in the trend's favor, never against it, so it doubles as a mechanical trailing stop and a clear trend-state signal. What makes it smart is the built-in Pearson R trend-quality filter. A raw stop line tells you where the stop is; the Pearson
FREE
Donchian Trend Engine
Bugra Kaan Yildirim
Donchian Trend Engine  Donchian Trend Engine is an institutional-grade dual-clock trend-following and channel breakout suite engineered for MetaTrader 5, combining Richard Donchian's breakthrough channels with the complete tactical rules of the legendary Turtle Trading experiment . The Two-Clock Architecture Unlike standard Donchian channel indicators that merely compute static highest highs and lowest lows, Donchian Trend Engine is built on a mathematically rigorous two-clock foundation : The P
FREE
Elder Force Zones
Bugra Kaan Yildirim
MetaTrader's built-in Force Index is not the formula Dr. Alexander Elder published. It multiplies the volume of a bar by the change of a 13-bar moving average of price. Elder defined the force of a bar as its volume times the change of its close, and smoothed that with an exponential moving average. Measured on gold over the last year, the two disagree about which side of zero the market is on roughly one bar in six (M15, H1 and H4). Elder Force Zones computes Elder's own definition and builds h
FREE
Refine OBV
Bugra Kaan Yildirim
Refine OBV  Refine OBV measures cumulative volume flow read against its own adaptive signal line with a color-coded spread and non-repainting divergence detection. Raw On Balance Volume answers one question: is volume being credited to the buyers or the sellers? While useful, raw OBV is a single wandering line with no reference point. Refine OBV adds an adaptive EMA of the flow itself as a reference line. The distance between the flow and its signal line (the spread) is rendered as a color-coded
FREE
Smart Exit EA
Bugra Kaan Yildirim
Smart Exit EA — Ride the Trend, Skip the Chop Smart Exit EA follows a trend with an adaptive ATR trailing line and stays in the move until the trend really turns. It is built for two problems every trend trader knows: getting shaken out of a good trade too early, and getting chopped up in a sideways market. Release notes, chart examples and new product announcements are posted on the TrendTower channel:   https://www.mql5.com/en/channels/trendtower What It Does Rides trends longer.   The trailin
FREE
Quant Trend Cloud
Bugra Kaan Yildirim
Quant Trend Cloud A cloud that is a regime, not a thread: the band between two slow adaptive lines. No arrows and no dots - the colour says which way the regime stands, and the brightness says whether the candle and the fast line stand clear of the band on that bar. Version 1.0. Release notes, chart examples and new product announcements are posted on the TrendTower channel: https://www.mql5.com/en/channels/trendtower What It Is The cloud is the band between Kaufman's adaptive average and VIDYA.
FREE
Trix Trend
Bugra Kaan Yildirim
Trix Trend algoteknik · MetaTrader 5 Indicator Manual Overview Trix Trend is a momentum oscillator based on TRIX — the rate of change of a triple-smoothed exponential moving average of price. Triple smoothing removes most of the short-term noise, so the oscillator reacts to the underlying momentum of the move rather than to every small wiggle, while staying more responsive than a simple long moving average. The indicator draws a slope-colored TRIX line, a weighted signal line, a zero line, and t
FREE
SVS Assistant
Bugra Kaan Yildirim
SVS Assistant SVS Assistant is the execution half of Smart Volatility Squeeze MT5. It carries out the orders you request from that indicator's 1-Click Trading Desk, applies your risk rules to them, and manages the resulting positions. It is published free of charge. Please read this before downloading: it does not analyse the market and it produces no signals of its own. Without the Smart Volatility Squeeze indicator running on the same chart there is nothing for it to listen to, and it will do
FREE
Smart Volatility Squeeze MT5 Smart Volatility Squeeze MT5 is a volatility compression and momentum expansion indicator for MetaTrader 5. It builds on John Carter's Volatility Squeeze framework and extends the usual single-tier squeeze into three compression tiers, so you can see not only whether the market is compressed but how tightly it is compressed before it expands. The indicator opens in a separate window and draws two elements: a linear regression momentum histogram and a row of coloured
Quant Desk Pro
Bugra Kaan Yildirim
Quant Desk Pro An R-native trade manager for MetaTrader 5.   It manages the trades you have already opened: it measures what each one is really risking, protects it, scales out of it on a plan you set, trails what is left, and stops the whole book when the day has gone far enough wrong. Read this first.   Quant Desk Pro does not open trades and has no signal. And it ships in   VIEW ONLY : it will not send a single order until you set   I understand the risks   to true in the inputs. Until you do
Trend Regime Line
Bugra Kaan Yildirim
Trend Regime Line Version 1.1 · algoteknik What This Indicator Is Trend Regime Line reads the trend through a triad: three Larry Williams tools that each answer their own question, and one line on the price chart that is coloured only when the answers fit together. Williams %R says which side price is thrusting to, the Ultimate Oscillator whether momentum confirms that side, and Williams Accumulation/Distribution whether buying or selling pressure still backs it. Green means the triad agrees on
필터:
리뷰 없음
리뷰 답변