Quant Key Levels
- Göstergeler
- Sürüm: 1.0
- Etkinleştirmeler: 20

Quant Key Levels, version 1.0. The reference levels a discretionary trader actually works from, on one chart and in one visual language. Eleven families, each on its own switch, and nothing on the chart that a level does not earn.
What separates it from a pivot pack is not the number of families. It is that the things most level tools assume, this one measures. How far your broker's clock sits from UTC, measured out of your own terminal rather than typed into a box. Where an exchange actually opens, to the minute, on that exchange's own daylight saving calendar. How wide a pivot range is, in the symbol's own average day rather than in points that mean nothing across instruments. And what it measures it shows you: the offset goes in the journal and optionally on the chart, the range width is written on its label, the distance to the nearest level is a number you can read.
Every level is defined from a period that has already closed, so once it is drawn it does not move. There is exactly one exception and it is marked as such, today's running high and low, which is a live range by definition. Where the numbers can be checked against something you already own, they are: the Camarilla family matches the Camarilla Channel that ships with MetaTrader 5, value for value, on the same chart.
Release notes, chart examples and new product announcements are posted on the TrendTower channel: https://www.mql5.com/en/channels/trendtower
The broker clock is measured, not typed in
Three families are built on one number. The true New York midnight open, the six session levels and both daylight saving calendars all run off the broker's distance from UTC. Most level indicators ask you for it, or take it from the server offset, and either way it is wrong twice a year and wrong again when you change broker.
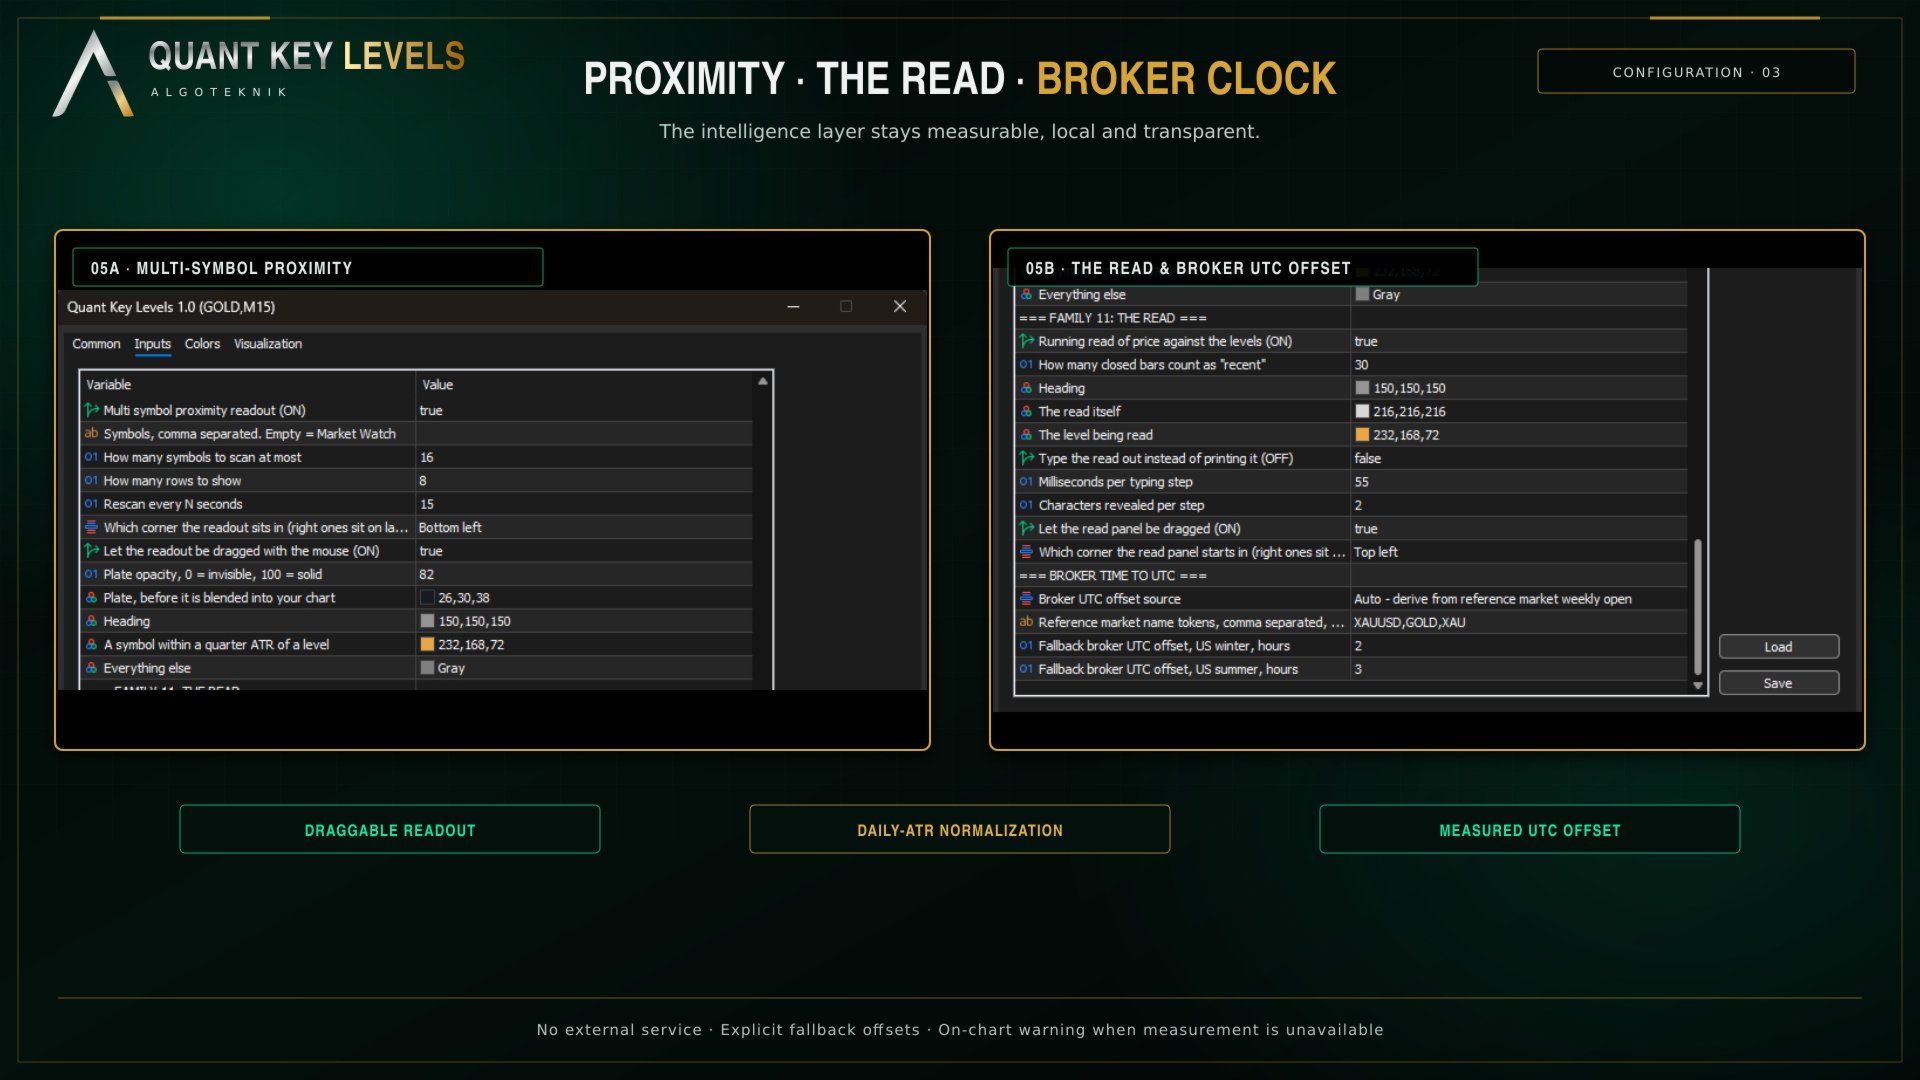
Here it is solved from data. The indicator reads the weekly opening bar of a reference market out of your own terminal and finds the single whole hour offset that puts that opening on Sunday at its known UTC time. There is no internet request, no external service and no library to install. The chart's own symbol is deliberately not used as the anchor: many brokers trim foreign exchange to broker midnight, and that silently produces an offset one hour wrong, so a continuously traded instrument is used and gold is the default. The name tokens searched for are an input.
The answer is reported in the journal at start-up and can be shown on the chart. When it cannot be measured a warning appears that cannot be switched off, because a wrong offset puts those levels on wrong prices while the chart still looks entirely reasonable. In the Strategy Tester, where only the tested symbol is loaded and the reference is usually missing, it says that too, and falls back to manual winter and summer offsets you can set.
Real exchange hours, and two daylight saving calendars
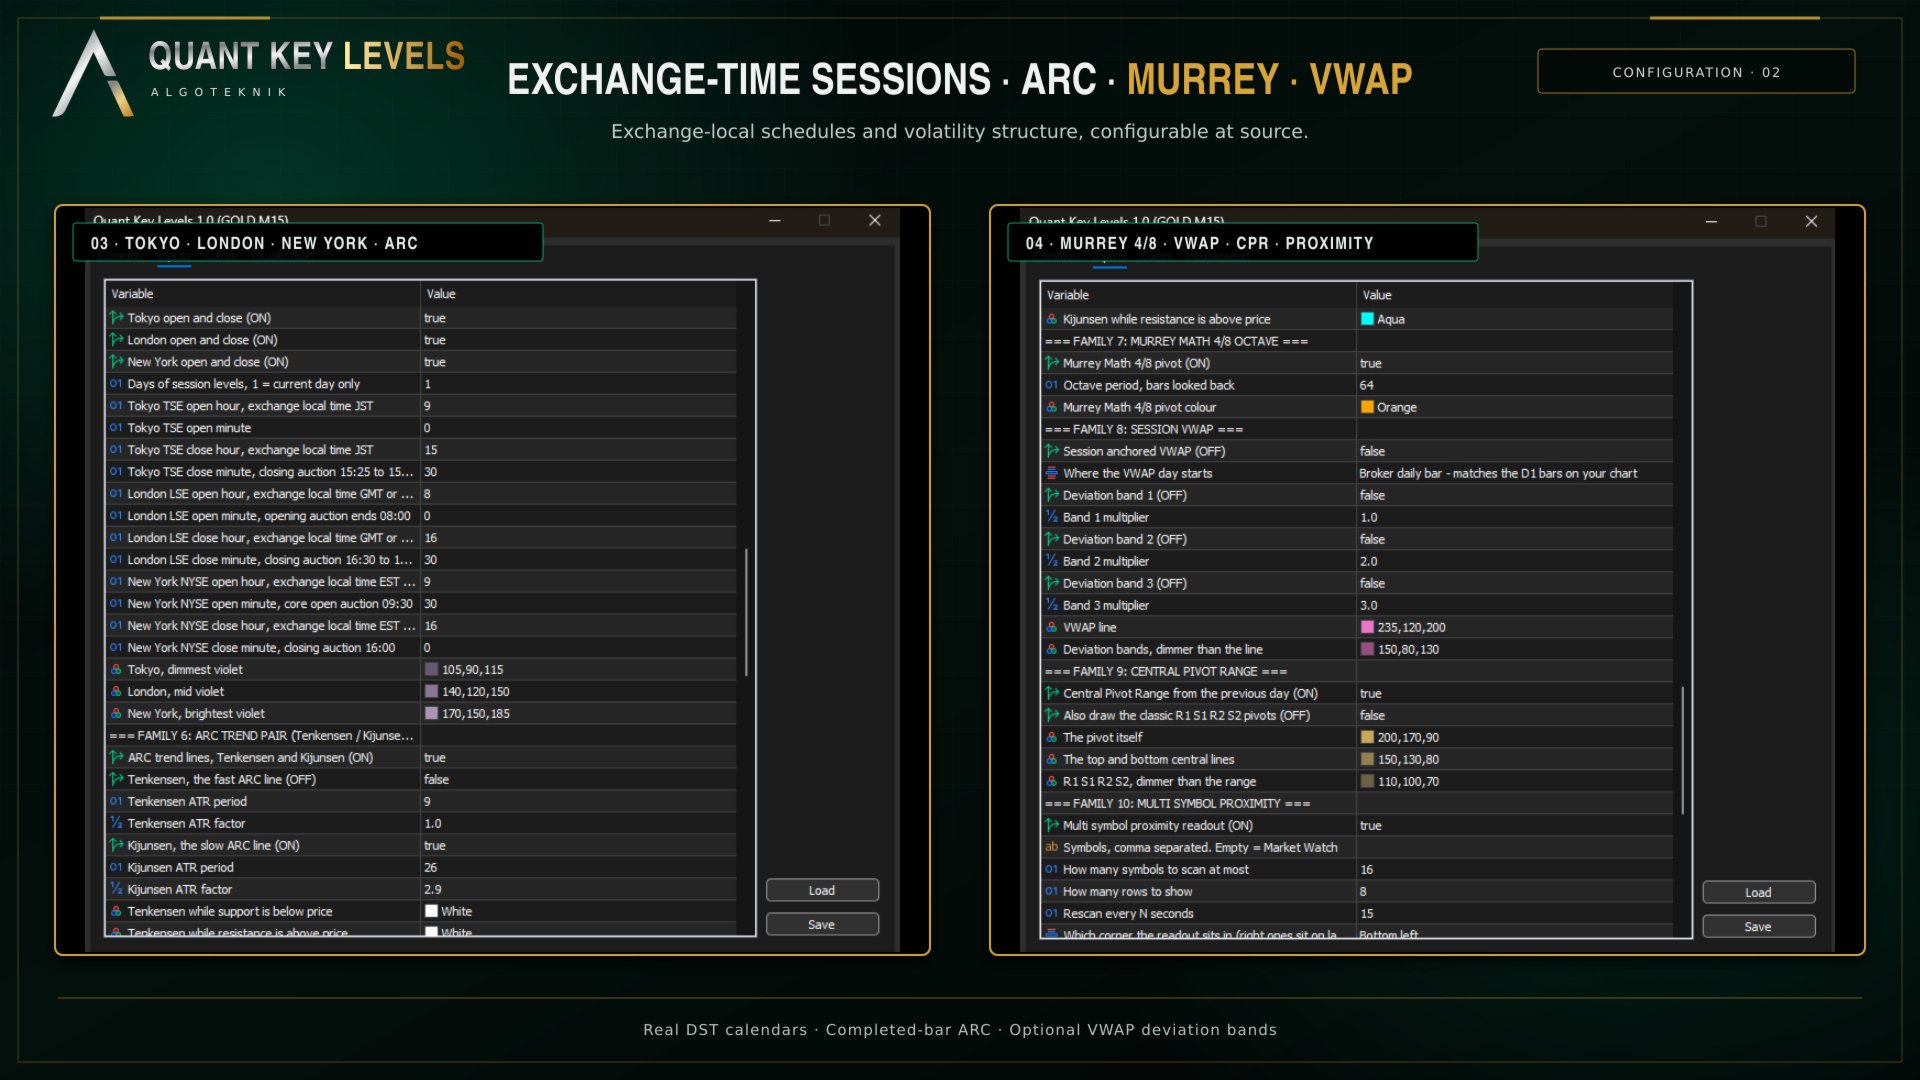
Six price levels, not shaded ranges: the open and the close of Tokyo, London and New York. These are not the rounded 08:00 to 17:00 blocks most session tools draw. They are the published trading hours of the three exchanges, to the minute. Tokyo runs 09:00 to 15:30 JST, with a closing auction from 15:25 that sets the official close, a 15:30 close that has been in force since November 2024, and no daylight saving anywhere in Japan, so it is 00:00 to 06:30 UTC every day of the year. London runs 08:00 to 16:30 London, with an opening auction ending at 08:00 and a closing auction from 16:30, which is 07:00 to 15:30 UTC on British Summer Time and 08:00 to 16:30 UTC on Greenwich Mean Time. New York runs 09:30 to 16:00 Eastern, the core open auction at 09:30 rather than 09:00, which is 13:30 to 20:00 UTC on Eastern Daylight Time and 14:30 to 21:00 UTC on Eastern Standard Time.
Every one of those times is entered as the exchange's own local time, hour and minute, exactly as that exchange publishes it. You never type a UTC number and you never type a summer variant and a winter variant: the conversion and the changeover are done for you, so nothing has to be re-entered twice a year. Change the local times if your working definition of a session differs and the UTC placement and the daylight saving shift stay correct on their own. Each level's tooltip shows both clocks, the UTC instant and the exchange local time with the zone in force that day, so you can check the placement without doing the arithmetic.
The two zones do not switch on the same weekend. In late October the United Kingdom has already fallen back while the United States has not, and for that week London and New York shift on different days. Each zone follows its own calendar here, so that week is handled correctly rather than smoothed over with one shared offset. Open is drawn solid and close dash dot in one violet family, so you can tell an open from a close by pattern alone. A boundary that has not happened yet draws nothing at all, and the close level appears only once the session has actually closed.
One unit: the symbol's own daily ATR
Distance in points does not travel. Forty points is nothing on gold and most of a day on EURUSD, so a number that is supposed to tell you how close price is to a level has to be normalised before it means anything. Everything in this product that reports a distance reports it in that symbol's own daily average true range, and that one decision is what lets a gold row and a EURUSD row sit in the same table and be read against each other.
The same unit measures the Central Pivot Range. P, TC and BC come from yesterday's daily bar, and the reading is the width between TC and BC rather than the lines themselves: narrow says yesterday closed near its own midpoint and the market did not decide, wide says it trended. That width is written on the label as a number, as in “TC 0.42 ATR wide”, so a narrow day is a measurement rather than an impression. TC is not always above BC. When yesterday closed below its own midpoint the pair inverts, and that flip is information, so both are drawn where they fall rather than sorted into a fixed order. The classic R1 S1 R2 S2 ride on the same pivot and ship off, because this family exists for the range.
A running read of the chart, in the language a desk would use
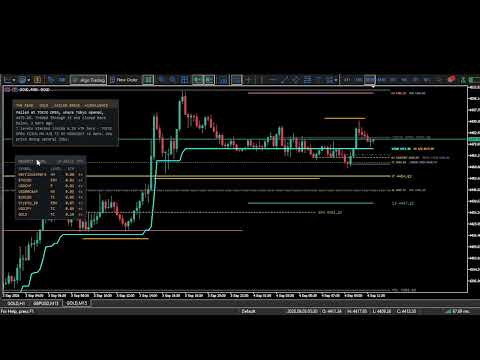
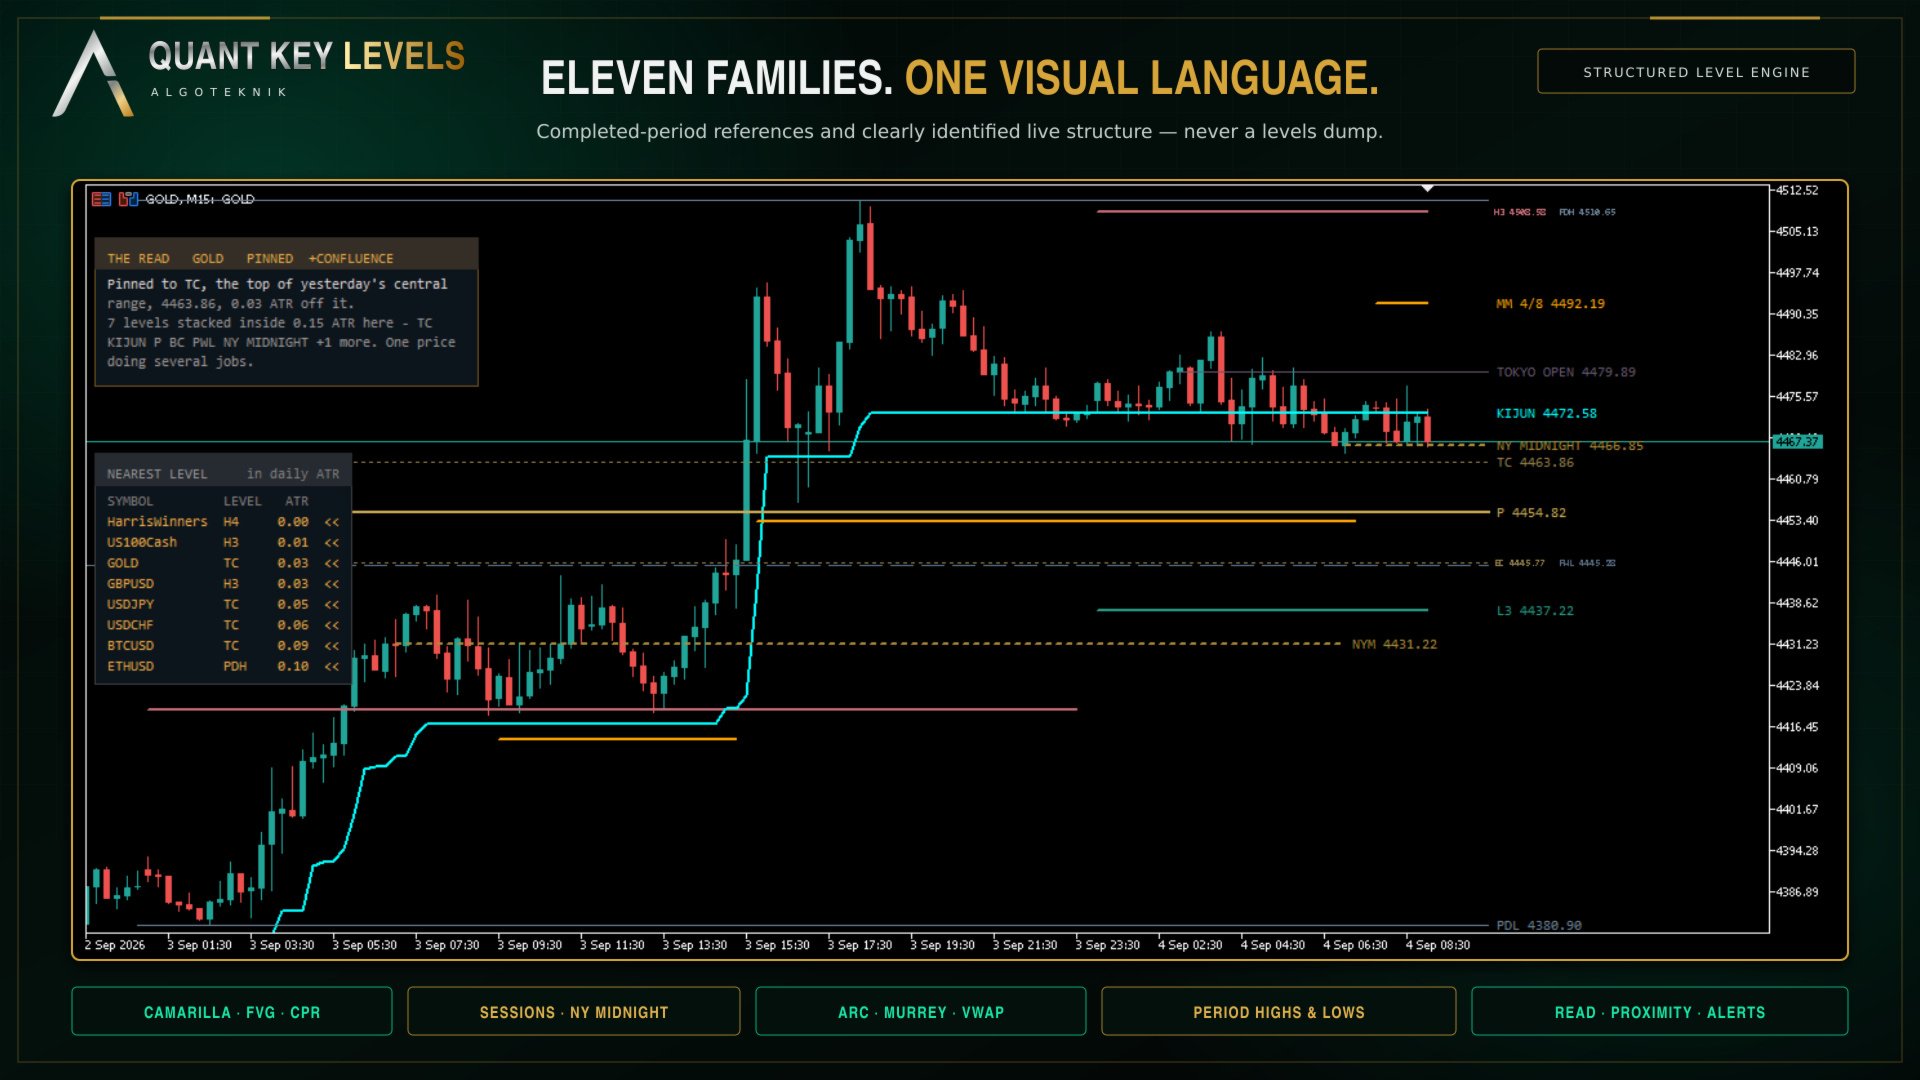
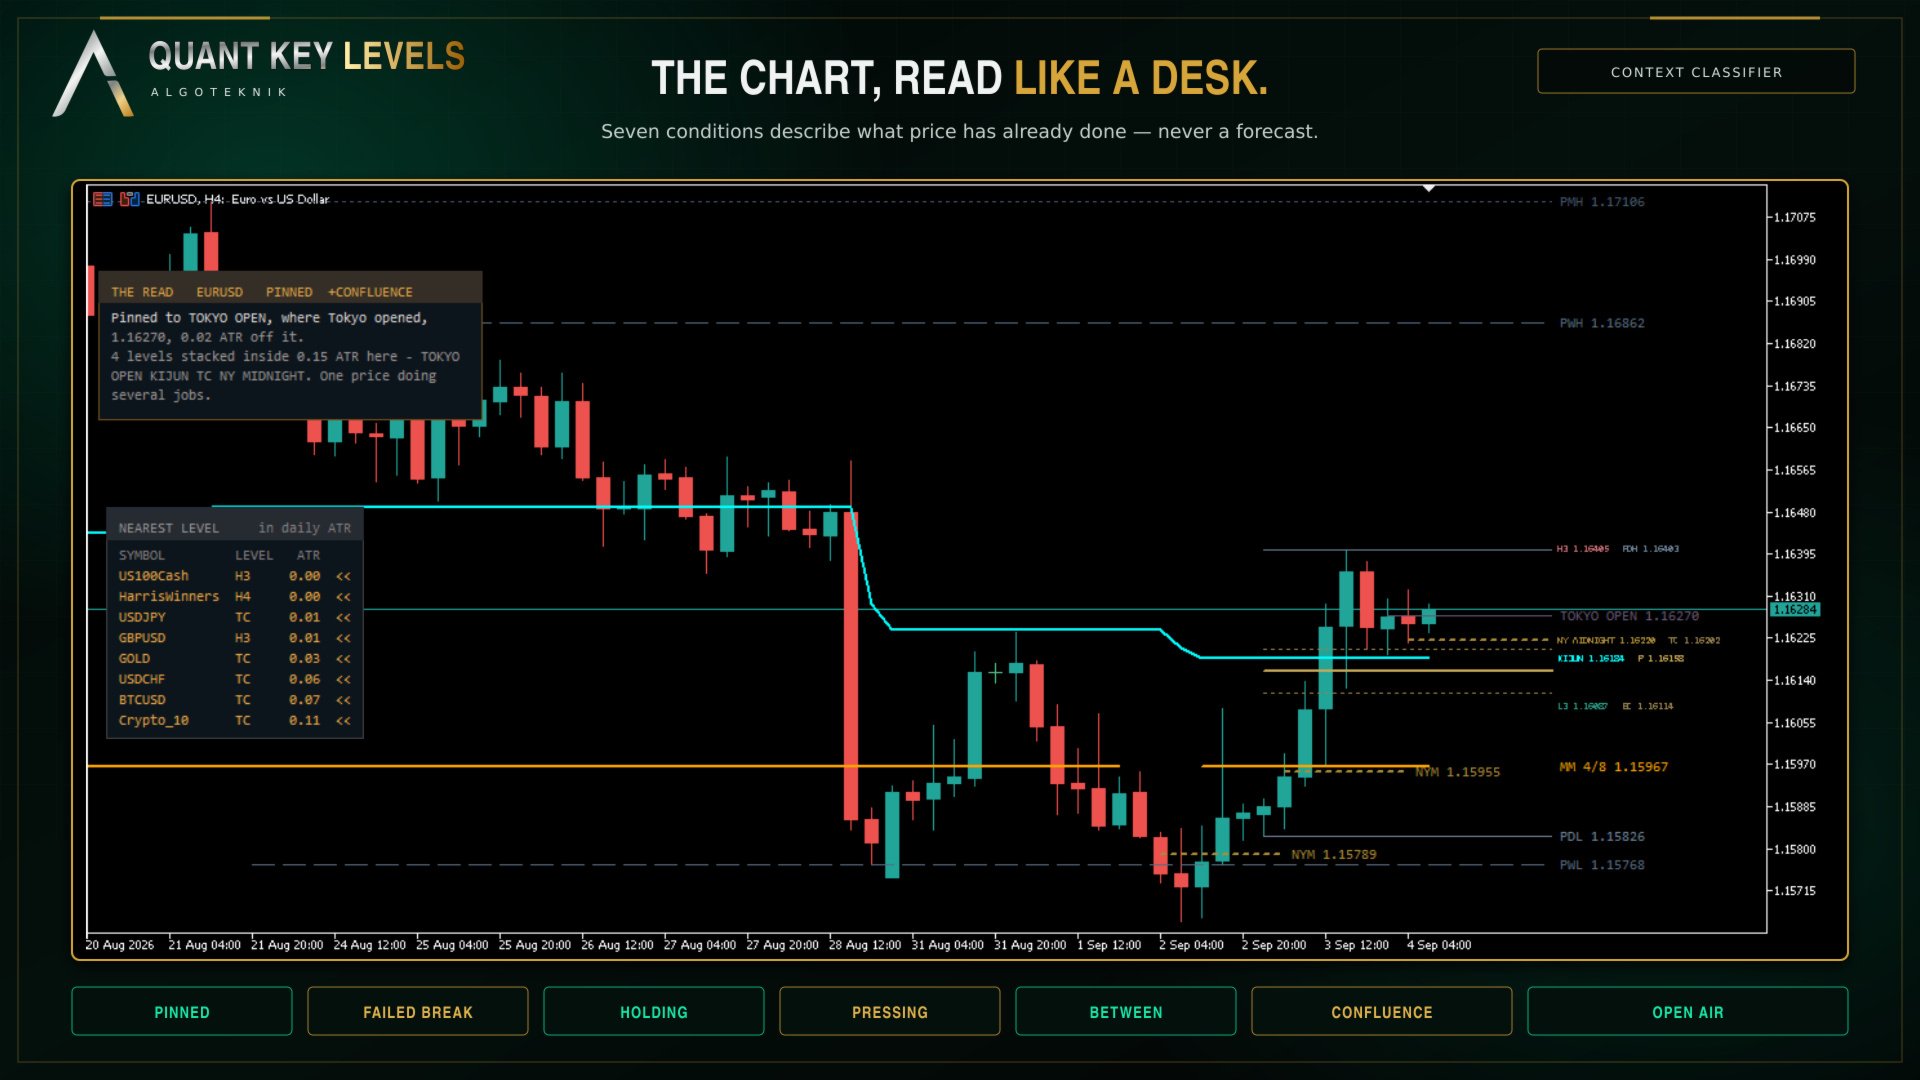
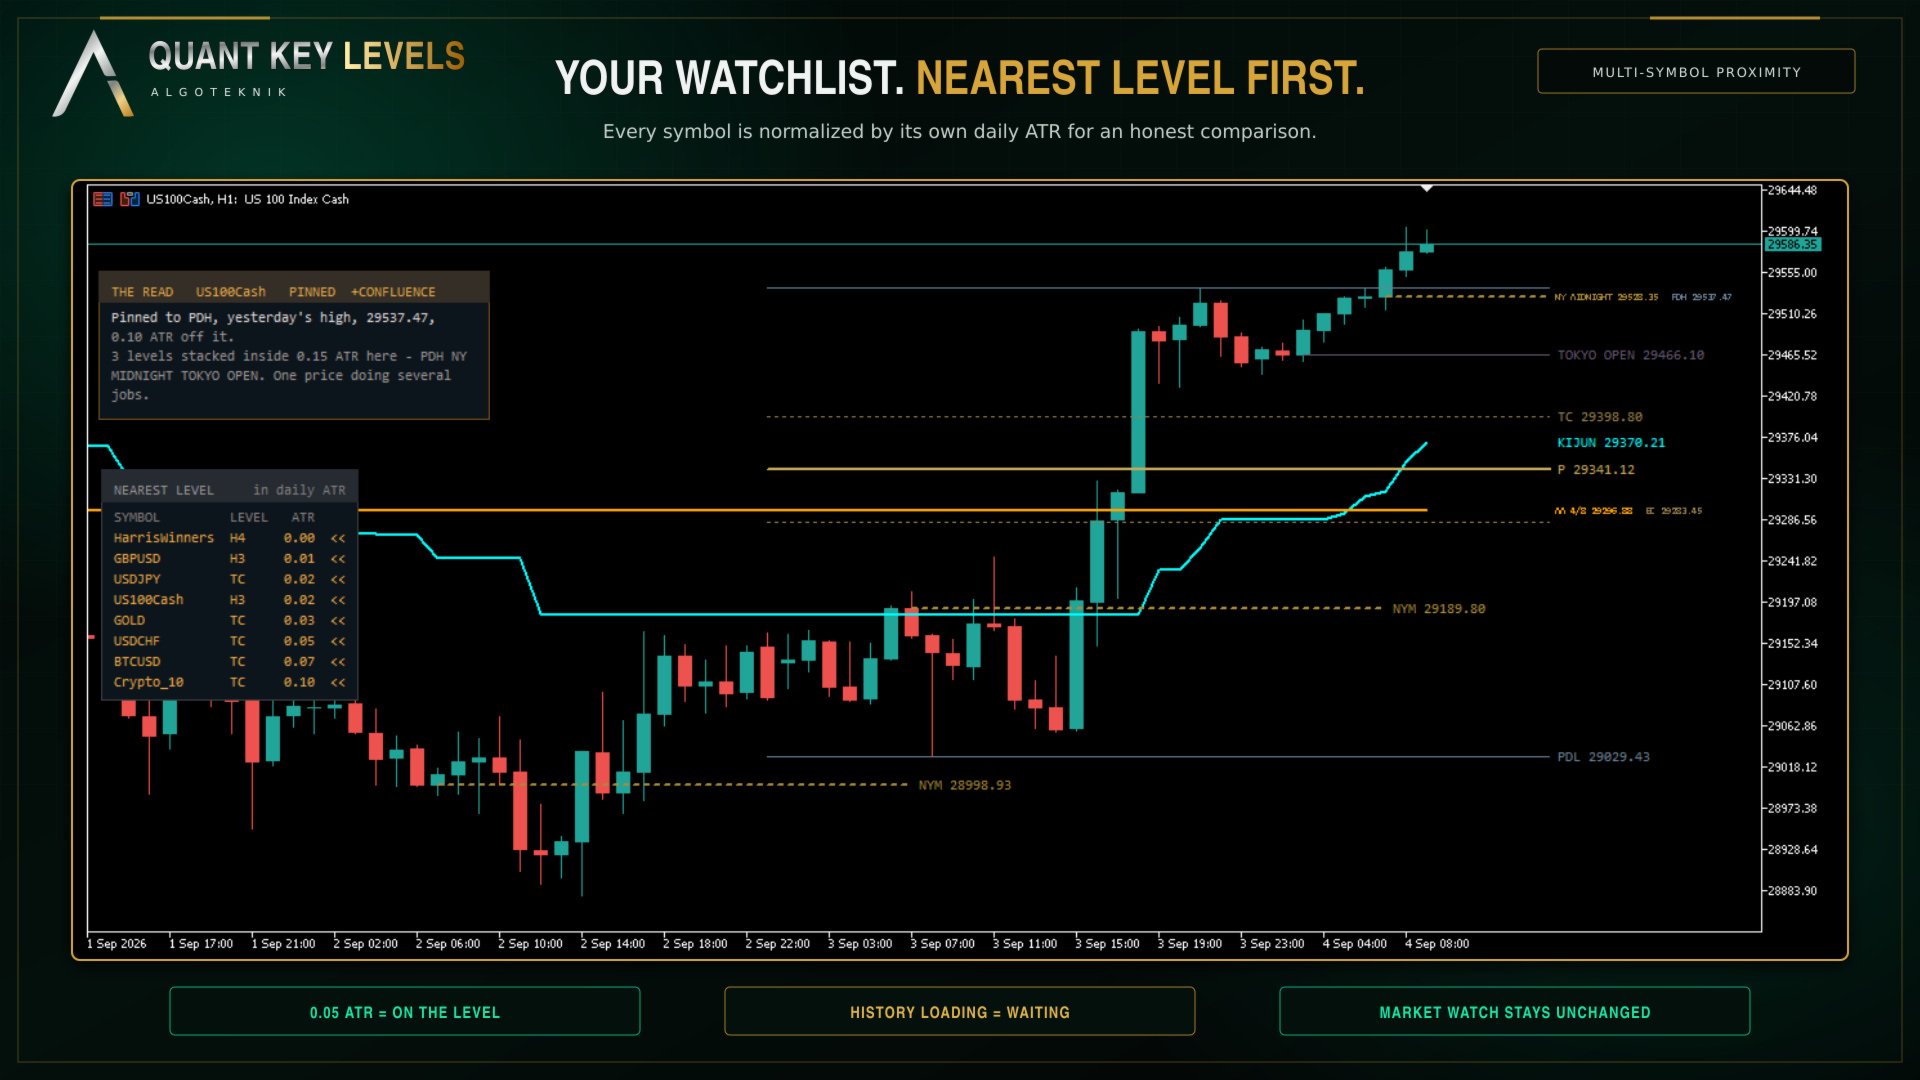
“Pinned to L3 4412.80, 0.04 ATR off it. Four touches in the last thirty bars and no close through.” The read measures the distance from price to every level on the chart in daily ATR, decides which of seven situations that is — pinned, failed break, holding, pressing, between, confluence, open air — and prints the sentence for it with the real numbers in. The panel holds eight lines; on the rare read that fills them the last line ends in three dots, which is the panel saying it ran out of room rather than the read stopping there.
It is a classifier, not a crystal ball, and the distinction is the point: there is no model, no forecast and no network anywhere in this product. Nothing on that panel says where price is going or what to do about it. Every sentence is a statement about what has already happened, which is the only thing a chart can honestly tell you. The same inputs produce the same sentence every time, and it holds its level through the small moves that would otherwise make it flicker between two neighbours.
The question a single chart cannot answer
Which of the things you trade is on a level right now. The multi symbol proximity readout scans your Market Watch, or a list you give it, and reports each symbol's distance to its nearest key level in that symbol's own daily ATR. 0.05 means price is on the level; 1.00 means a full average day away; anything inside a quarter of an ATR is called out. Nine levels per symbol, all from its previous completed daily bar. It never adds anything to Market Watch to fill the list out, and a symbol still downloading its history is shown as waiting rather than reported as a zero. In the Strategy Tester only the tested symbol is loaded, so the readout shows one row there and says so on the plate; that is the tester, not the product. When a symbol has no live quote, because the market is closed or it has not ticked since the terminal opened, its last daily close stands in for the price.
Nothing repaints, and the one thing that moves says so
Every level here is defined from a period that has already closed. The daily average true range that the read, the proximity readout and the pivot range width are measured in is built from closed daily bars only and never touches today's forming bar, so those numbers do not drift through the session. The Murrey octave is computed from the bars before the current one, so it is fixed the moment its bar opens. The ARC pair draws the level as it stood after the previous bar closed. The VWAP value on a closed bar was measured against its own recomputation and never changed afterwards. The single exception is today's running high and low, which is a live range by definition and carries a tilde in its name so it can never be mistaken for a settled level.
Levels that stay readable
A level that is flat for a day and jumps at the boundary is two shelves, not one sloping line. Drawing it as a single continuous line paints a vertical through prices that were never a level, and that is what turns a pivot chart into a staircase. Every family here that steps — the Camarilla set, the Murrey octave, the ARC pair at a side change — is drawn as separate flats with the joining bar left blank.
With everything switched on, eleven families put their levels on the chart and their labels all want the same strip of screen at the right edge. Rather than let them print on top of each other, the labels go into one queue and a single pass lays out the whole column at once. Labels that land within one text height of each other belong to one row, and a shared row is written side by side: they are not merged and nothing is thrown away, so each label keeps its own text, its own price and its own colour. A shared row is set 25 percent smaller than a label that has its row to itself, which is what buys the horizontal space back, and the widths are measured with the real font metrics rather than guessed from a character count. Grouping runs in order of importance and the rows come out correctly spaced on their own, so no label is nudged off its own price and none is hidden. A row holds at most six labels by default; past that the last one carries a “+N” so the count stays honest. Crowding is measured in pixels, so the column is recomputed as you zoom.
The two panels are drawn as framed plates whose colour is blended with your chart background rather than painted over it, so the candles behind them stay readable. Both can be dragged anywhere and both remember where you put them, per symbol.
The eleven families
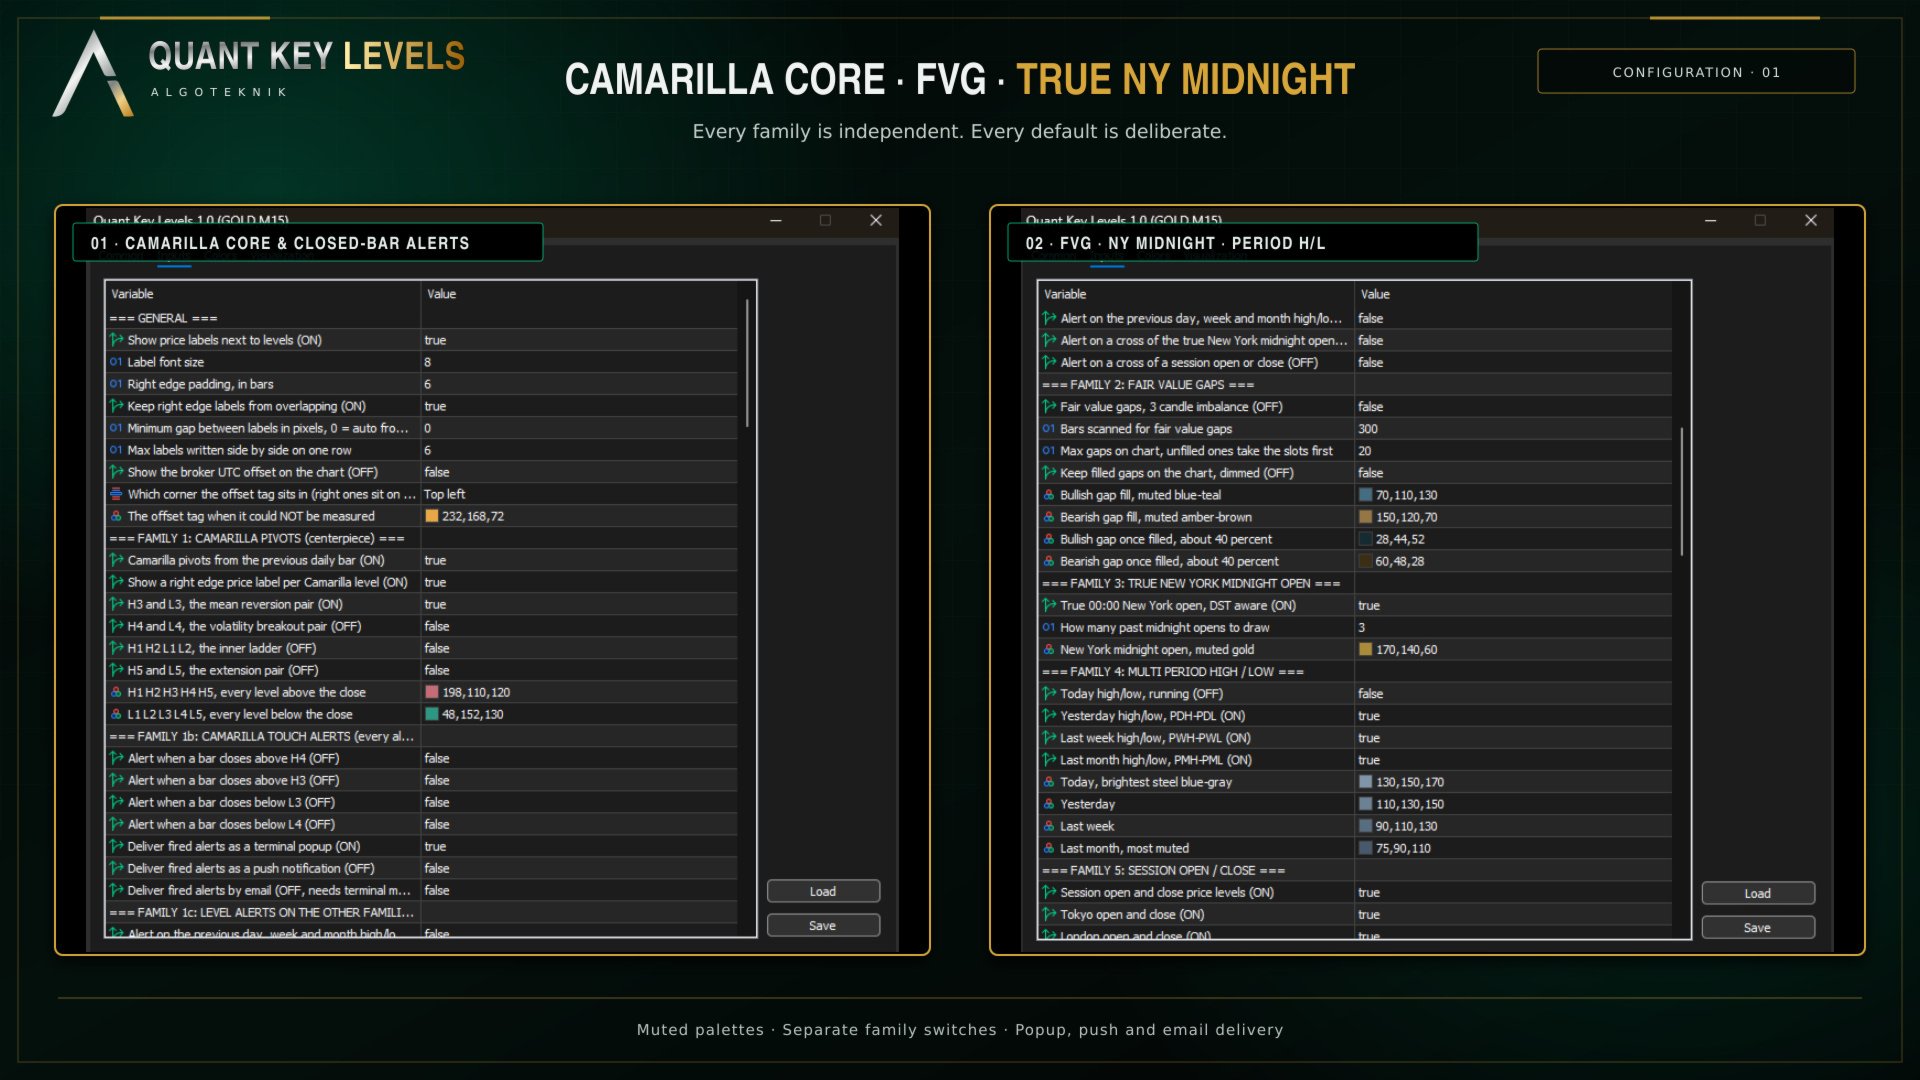
Camarilla pivots. Calculated from the previous completed daily bar, with R as the previous high minus the previous low. H4 and L4 sit at Close plus or minus R times 1.1 divided by 2, H3 and L3 at 1.1 divided by 4, H2 and L2 at 1.1 divided by 6, H1 and L1 at 1.1 divided by 12. H5 is the previous high divided by the previous low, multiplied by Close, and L5 is H5 mirrored around Close. This is the Camarilla Channel that ships with MetaTrader 5, drawn the way it draws it: all ten lines on every bar, solid, with H3 and L3 heavy and the other eight thin. The colours are this product's own, rose above the close and teal below it, measured for contrast rather than picked by eye. Switch all four pairs on, put the stock Camarilla Channel on the same chart, and every value sits exactly on top of its own. That is the only kind of proof worth offering.
What ships on is the mean reversion pair alone, H3 and L3. Ten lines at once is a wall and those are the two a trader actually works from. The other three pairs are one switch each, because a level and its mirror are read together, and turning a pair off removes its line, its right edge label and its touch alert together. The arithmetic is untouched: every level is still computed, so turning a pair back on shows the numbers that were always there.
What this module adds to the stock version is correctness, never a different picture. The stock indicator builds its object prefix from the clock, so it changes on every restart and leftover labels can never be swept away; here the prefix is fixed and a sweep runs before anything is drawn. The stock indicator can stall permanently when the previous daily bar is missing, and not only for that bar but for the whole rest of the chart; here the history is actively requested, the affected bar is left blank and the levels repair themselves when the data arrives. The stock indicator divides by the previous Low without checking it; here H5 and L5 are left out rather than invented when that division is not safe. The stock indicator refuses to start at all above D1; here Camarilla simply stops drawing above D1 while the other families carry on. Several vendors publish different H5 and L5 conventions; the one used here is the MetaQuotes published extension, and it is written on the tooltip of the level itself, so a number that differs from another package is a convention difference rather than an error.
Fair value gaps. The classic three candle imbalance, scanned over the last 300 bars by default and drawn as a shaded block extended to the right for as long as the gap stays open. A gap counts as filled the moment price trades through its far edge, the bottom of a bullish gap or the top of a bearish one, because reaching that edge means the whole imbalance has been traded back through. The box is cut at the candle that fills it and is never drawn past that candle. A filled gap is not deleted: it is dimmed and its right edge is frozen there, so the record of where imbalance was resolved stays on the chart. At most twenty gaps are kept, open ones claim the slots first, and the first thing dropped is always the oldest already resolved gap.
True New York midnight open. The daily open at midnight New York time, which is 05:00 UTC in winter and 04:00 UTC in summer, switching on the real United States daylight saving dates rather than on a broker server offset that someone typed in once. It is placed with the measured clock described above.
Multi period high and low. Four periods, each with its own switch. Yesterday, last week and last month ship on; today running ships off because it is the one level that moves all day. Every value is read from a completed daily, weekly or monthly bar rather than assembled by scanning intraday bars across a boundary, which is what makes weekend and holiday gaps a non issue. On a Monday the previous day is simply the previous daily bar, which is Friday. Style carries recency rather than colour: all four use one steel blue family, and you read the age of a level from how it is drawn.
- Today, solid and brightest
- Yesterday, solid and slightly muted
- Last week, dashed
- Last month, dotted and most muted
Session open and close. The six exchange levels described above, drawn from the published hours of Tokyo, London and New York on their own daylight saving calendars.
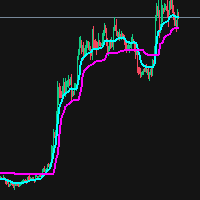
ARC trend pair. ARC stands for Average Range times Constant, from Welles Wilder Jr, 1978. A constant times the Average True Range is measured off price to give a level that trails the market, and the rule is short: if close minus factor times ATR is above the level the level moves up to it, if close plus factor times ATR is below the level it moves down to it, and otherwise the level does not move at all. The level is therefore dragged along only when price gets further than one ARC away from it. Inside that band nothing happens, which is why the line sits on long flat shelves and why price can cross it without moving it a single tick. The ATR used is the plain average of true range, not Wilder smoothing.
Two lines are drawn, used the way an Ichimoku uses its two fast lines but built from Average True Range instead of fixed period highs and lows: the Tenkensen on a nine period ATR with factor one, drawn thin, and the Kijunsen on a twenty six period ATR with factor 2.9, drawn heavy. Both period and factor are inputs. Each line has two colour inputs, one for while it sits below price and one for while it sits above, on separate plots so the handover at a side change is flat rather than a jump. They ship set to the same value per line, white for the Tenkensen and aqua for the Kijunsen, so each line reads as one colour unless you choose to have the side called out. The value drawn on a bar is the level as it stood after the previous bar closed, so nothing on the current bar can change it.
Murrey Math 4/8. Murrey Math takes the range of the last sixty four bars by default, snaps it onto a base eight octave grid and cuts that octave into eight equal eighths. The 4/8 line is the middle one, the main pivot, where price is treated as being in balance. Only the 4/8 is drawn here: the other twelve lines of a full Murrey set would turn the chart into a grid, and the 4/8 is the one that behaves like a key level. The calculation is a line for line port of the Murrey Math indicator that is already in the terminal, quirks included rather than tidied up, so the two agree to the last digit and can be checked against each other on the same chart.
Session VWAP. The volume weighted average price, accumulated from the start of the session: each bar contributes its typical price weighted by that bar's activity, and the line is the running average of the two. By default the session starts at the open of the broker's own daily bar, the same boundary the Camarilla levels use and the same one your daily chart draws, so the two never disagree about where the day began; the alternative anchor is true midnight New York.
Where the feed supplies real traded volume it is used. No retail foreign exchange or CFD feed does, so on those instruments the weight is the tick count, the number of price changes in the bar. That was measured rather than assumed, and so was what it tracks: tick count correlates 0.74 with the bar's range, which means it follows activity and volatility rather than traded size, while its shape through the day does match the real liquidity curve. On foreign exchange this line is honestly a volatility weighted mean price, and knowing that is worth more than a footnote. It is timeframe dependent, and so is every other VWAP: each bar contributes a single typical price, so a coarser chart folds more of the movement inside each bar into one number. Three optional band pairs sit at plus and minus a multiple of the weighted standard deviation of price around the line, using the same weights; all three ship switched off, because six lines that move together crowd out everything else.
Central Pivot Range, described above with its width tag. Multi symbol proximity and the read are the tenth and eleventh, and both are panels rather than lines; both ship on, because a feature nobody finds is a feature nobody bought.
Alerts
Camarilla H3, H4, L3 and L4 raise a close alert; so do the previous day, week and month highs and lows, the true New York midnight open, and the session opens and closes. Every one of them judges the last closed bar and never the forming one, none fires for the history that was already on the chart when the indicator loaded, and each level fires at most once a day. Direction is per family: a previous high is broken upward and a previous low downward, so those fire on a close past the level, while a midnight open or a session open has no side to break and fires on a cross in either direction. Delivery is popup, push notification or email, each on its own switch. Every alert ships off.
The Data Window
Every level that is drawn as a chart object is also published to the Data Window under its own name: previous day, week and month high and low, today's running high and low, the New York midnight open, the pivot range, and the six session levels. Hover a bar and read the exact number instead of taking it off a label that shortens when the right edge is crowded. A level is only reported from the bar that defined it onward, so hovering last month does not report today's previous day high, and a family you switch off leaves the Data Window rather than freezing its last value there.
Colours, settings and the full reference
A small set of muted hue families, each distinguished inside itself by line style and weight rather than by adding more colours. Nothing is neon and nothing is a pure red or green, and the shipped values are chosen to stay readable across a long session on a dark chart. Every colour is an input, so the whole palette can be retuned to your own theme without losing the structure.
Colour, line style and width come from the Inputs tab and are re-applied every time the indicator starts, so edits made in the Colors tab do not stick. That is deliberate. A chart stores the plot settings of every indicator attached to it and pushes them back over what the indicator asks for, so a chart that once held a different version of this tool can force that version's settings onto this one, and when the two disagree about how a line is drawn the line does not appear at all. Rather than let a stale chart setting silently blank out a level, the indicator puts its own definition back.
The complete input reference, including every default, every allowed range and the behaviour that has no switch, is in the Manual.txt file, published on the channel linked at the foot of this page. A Market product carries one file, so the manual is not packed with the EX5.
Questions, bug reports and feature requests are welcome on the TrendTower channel: https://www.mql5.com/en/channels/trendtower
This is an indicator for analysis and decision support. It does not place trades. Always test thoroughly before using any tool in live trading. Trading involves risk.
algoteknik
Support, updates and every other product: mql5.com/en/users/bugraky123
Product channel: mql5.com/en/channels/trendtower
Quant Key Levels version 1.0