
Smart Chandelier Exit
- 指标
- 版本: 1.5
- 更新: 15 九月 2026

Smart Chandelier Exit
Smart Chandelier Exit is an adaptive trailing-stop and trend-direction indicator. It plots a multi-layer ratchet stop line that follows price: green below price in an uptrend, red above price in a downtrend. The line only ever ratchets in the trend's favor, never against it, so it doubles as a mechanical trailing stop and a clear trend-state signal.
What makes it smart is the built-in Pearson R trend-quality filter. A raw stop line tells you where the stop is; the Pearson R engine tells you how strong the current trend actually is (strong, moderate, weak, or ranging noise). Both are shown together on a compact on-chart panel, along with rolling statistics that separate genuine trend flips from short-lived fake flips.
The indicator is non-repainting: the stop line is computed on closed bars with a one-directional ratchet, alerts fire only on a closed bar, and flip arrows are confirmed after a fixed number of bars so an arrow never appears and then disappears. What you see in history is what you would have seen live.
Release notes, chart examples and new product announcements are posted on the TrendTower channel: https://www.mql5.com/en/channels/trendtower
What You See on the Chart
Layered Glow Stop Lines
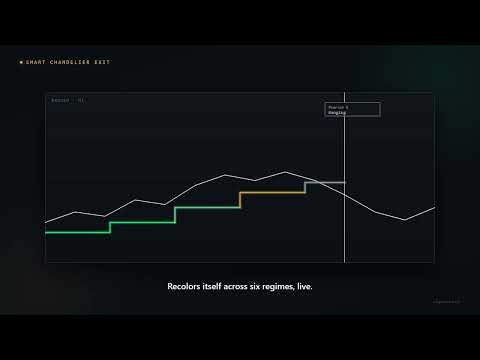
The active stop direction is rendered using layered glow rendering consisting of an outer background halo, an inner mid corona, and a sharp core line marking the precise stop level. Line colors shift automatically across six market regimes based on Pearson R trend quality: Bright Emerald for Strong UP, Soft Green for Moderate UP, Amber for Weak trends, Cool Gray for RANGING markets, Soft Red for Moderate DOWN, and Bright Crimson for Strong DOWN. Only the active stop direction is drawn, leaving the inactive side hidden to keep the chart clean.
Fill Band Shadow Zone
A subtle shaded volatility band approximately 0.4 × ATR wide hugs the active stop line. A dark green shadow appears below the bullish stop line and a dark red shadow appears above the bearish stop line, providing an instant visual cue of the danger zone relative to price.
Stop With a Buffer
A thin dotted line runs behind the active stop line, Buffer behind the line (ATR) further away from price (1.0 ATR by default). It marks where a stop sits outside the ordinary noise around the line, and like the line it only ever moves toward price while the direction holds. Measured on GOLD, EURUSD and US100 H1 over three years, with a trade taken at every confirmed arrow and the stop on the dotted line, 1.0 ATR gave the best result of the distances tested (0 to 1.0 ATR) on all three markets. The differences were modest, and the last year alone did not repeat the order on GOLD, which is why the distance is a setting.
Why the Halo Starts One Bar Late
The two glow layers and the fill band begin on the second bar of a direction run, while the sharp core line is drawn from the first bar. This is deliberate. Price sometimes closes a hair past the stop and recovers on the very next bar: that is a genuine one-bar stop-out, and the core line still marks it. Without this rule the same single bar would also paint a wide halo and a band of the opposite colour across the chart, which reads as a rendering glitch rather than as information. The test looks only one bar backwards, so no closed bar ever changes afterwards and the non-repainting guarantee is unaffected. On a normal trend the only visible effect is that the halo begins one bar after the core line.
Confirmed Flip Arrows
Confirmed direction flips are marked with green up-arrows below bullish bars and red down-arrows above bearish bars. Since version 1.5 the arrow stands on the bar where the flip was confirmed - the first bar on which a trader could act - and a small dimmed dot marks the earlier bar where the new direction began. Before 1.5 the arrow stood on that earlier bar, which made past signals look earlier than anyone could have taken them: measured on GOLD, EURUSD and US100 H1 over three years, price had already moved a median of 0.24 to 0.49 ATR between the two bars, and more than 1 ATR in about a third of the flips. Arrows are rendered only after a flip maintains its direction continuously for the fake-flip window (A flip held <= this many bars is tagged FAKE), so they never repaint. Arrow width encodes trend quality at the flip moment, with a small numerical Pearson R label printed next to each arrow.
Arrows always alternate between bullish and bearish. When an opposite flip in between was tagged FAKE and therefore never drawn, the confirmed direction never visibly left the previous side, so the next same-way flip is a duplicate rather than a new signal and no second arrow appears. Nothing is lost by this: the flip remains in the Direction buffer that EAs read, and it still counts towards the Fake Flips percentage on the panel.
Info Dashboard Panel
An optional Bloomberg-style on-chart panel is displayed in the selected chart corner. It provides section header accents, a two-column grid layout, and a live calculation indicator.
Placing the Panel
Pick a starting corner with Panel corner position and nudge it with the Panel offset X / Y inputs. All four corners render the same layout; the panel keeps itself inside the chart and follows its corner when the window is resized.
You can also drag it. Press the left mouse button anywhere on the panel body and move: the whole panel follows the cursor and the chart does not scroll while you drag. The position you release it at is remembered per symbol and timeframe, so it survives removing and re-adding the indicator and restarting the terminal. To send the panel back to a corner, change Panel corner position; that clears the stored manual position. Set Allow dragging the panel with the mouse to false to lock it in place. The panel is never selectable, so it cannot be nudged with the arrow keys or deleted from the object list by accident.
Panel and Indicator Readouts
Setup Section
Pearson R measures the correlation coefficient between price and time over the last Correlation lookback (price vs time) bars on a scale of −1.0 to +1.0. Strength Bar displays absolute correlation magnitude across 10 segments. Regime converts correlation into plain-language classifications (Strong, Moderate, Weak, RANGING). ATR Base echoes the active ATR period and multiplier settings.
Execution Section
Direction shows current active status (BULLISH or BEARISH). Stop Level shows the exact price of the active stop line at full symbol precision. Distance displays the gap between price and stop in price units and ATR multiples. Stop+Buffer shows the dotted stop and its distance setting. The higher timeframe row (H4 Trend by default) shows the chandelier direction of the last closed bar of that timeframe and whether it agrees with the chart. Measured on H1 charts, confirmed flips that agreed with H4 did clearly better on GOLD, but not on EURUSD or US100; the row is information, and the matching alert filter is off by default.
Insights Section
Fake Flips shows the share of recent flips that reversed within the confirmation window over a 50-flip sample. Risk Thermometer converts this percentage into a 10-segment risk gauge (LOW below 20%, MED 20–40%, HIGH above 40%). Bars Since tracks how many bars have passed since the active direction began.
Panel Footer
The bottom line of the panel prints the running version and brand, currently "v1.5 • algoteknik". Use it to confirm at a glance which build is attached to the chart.
Calculation Mechanics & EA Integration
Long stops sit at highest-high minus ATR multiplied by the ATR multiplier, while short stops sit at lowest-low plus ATR multiplied by the ATR multiplier. Data buffers for EA developers via iCustom: Buffer 10 returns direction (+1 for Bullish, −1 for Bearish), Buffer 11 the raw Pearson R correlation coefficient, Buffers 12 and 13 the dotted long and short stop (each holds a value only while its side is active and is empty otherwise), Buffer 14 the confirmed signal (+1 or -1 on the bar where a flip is confirmed, 0 otherwise, whether or not arrows are shown), Buffer 15 the higher timeframe direction (0 while it loads or when it is off) and Buffer 16 the dotted stop of the active side on every bar. Buffers 12, 13 and 16 are filled even when the dotted line is hidden. Buffers 10 and 11 keep the numbers they had before 1.5, and the 1.5 settings come after all earlier ones, so an EA that passes the earlier settings to iCustom in order still sets the same inputs.
Input Parameters Reference
CE Parameters
ATR period (stop distance sizing): Default 22. ATR period used to size the stop distance.
Highest/Lowest lookback (bars): Default 22. Bars used for the highest-high / lowest-low calculation.
ATR multiplier (larger = wider stop): Default 3.0. ATR multiplier; larger values produce wider stops and fewer flips.
Pearson R (Trend Quality)
Correlation lookback (price vs time): Default 22. Lookback period for the price-versus-time correlation.
|R| >= this = Strong regime: Default 0.7. Correlation threshold at or above which the regime reads Strong.
|R| >= this = Moderate regime: Default 0.5. Correlation threshold at or above which the regime reads Moderate.
Fake Flip Detection
A flip held <= this many bars is tagged FAKE: Default 5. Window length in bars within which a flip reversal is tagged fake. A flip that holds longer is confirmed, and its arrow is drawn on the bar where the window ends.
Performance & Limits
Max calculation bars (0 = All history): Default 5000. Maximum historical bars processed (0 = all history).
Max flip arrows on chart (0 = All): Default 100. Maximum flip arrows retained on the chart (0 = unlimited).
Visual
Show info panel: Default true. Toggles the info dashboard.
Show confirmed flip arrows: Default true. Toggles the confirmed flip arrows.
Allow dragging the panel with the mouse: Default true. Allows the panel to be dragged with the mouse and remembers where you drop it. Set to false to lock the panel to its corner.
Panel corner position: Default Top Left. Starting corner for the info panel. Changing it also clears any manually dragged position.
Panel color theme: Default Dark Obsidian (Gold / Emerald). Visual color theme of the panel.
Panel offset X from corner (px): Default 20. Panel pixel offset from the selected corner, horizontally (0 or more).
Panel offset Y from corner (px): Default 20. Panel pixel offset from the selected corner, vertically (0 or more).
Distance Unit
Panel distance: auto / pip / point: Default Auto. Units for the Distance readout. Auto uses pips on Forex symbols and the raw price difference on indices, crypto and shares, because MT5 points are misleading on those instruments. Can be forced to Pip or Point.
Raw Flip Alerts
These fire on the raw direction flip, on the close of the bar where direction changed. They do not wait for the fake-flip confirmation, so an alert can arrive for a flip that is later tagged FAKE. Treat them as an early warning, and read the Regime row and Fake Flips gauge before acting.
Pop-up alert on raw flip: Default false. Terminal pop-up alert on a raw flip.
Push notification on raw flip: Default false. Mobile push notification on a raw flip. Requires a MetaQuotes ID configured in the terminal (Tools > Options > Notifications).
Email alert on raw flip: Default false. Email alert on a raw flip. Requires SMTP settings configured in the terminal (Tools > Options > Email).
Confirmed Arrow Alerts
These fire at the moment a confirmed arrow is drawn: the flip has held its direction for the fake-flip window and it alternates with the previous arrow. They arrive later than the raw flip alerts but carry no FAKE flips, and the message says whether the higher timeframe agrees with the arrow or is against it (left out while the higher timeframe is off or still loading). The two sets are independent. Nothing fires while history is being drawn, so adding the indicator to a chart is silent no matter how many past arrows appear.
Pop-up alert when a confirmed arrow is drawn: Default false. Terminal pop-up when a confirmed arrow is drawn.
Push notification when a confirmed arrow is drawn: Default false. Mobile push notification on a confirmed arrow.
Email alert when a confirmed arrow is drawn: Default false. Email alert on a confirmed arrow.
Stop Buffer
Show the stop with a buffer behind the line: Default true. Draws a thin dotted line this far behind the chandelier line: the stop outside the line's ordinary noise. It only moves toward price while the direction holds. The values stay in the EA buffers when the line is hidden.
Buffer behind the line (ATR): Default 1.0. Distance of the dotted stop behind the line, in ATR, from 0 to 10.
Higher Timeframe
Higher timeframe shown on the panel: Default H4. The timeframe whose chandelier direction the panel shows next to the chart's own. On a chart at or above this timeframe the row reads off.
Confirmed arrow alerts only when the higher timeframe agrees: Default false. When true, a confirmed arrow alert is sent only when the higher timeframe points the same way as the arrow; while the higher timeframe is still loading, none is sent. On a chart at or above the higher timeframe the row is off and this filter does nothing. Arrows are drawn either way.
Flip Dot
Mark the bar where a confirmed flip began with a dot: Default true. Draws a small dimmed dot on the bar where a confirmed flip began, next to the arrow on the bar where it was confirmed.
Suggested Use & Disclaimer
- Trade in the direction of the active glow line: green for longs, red for shorts.
- Confirm signal quality when the panel displays Strong or Moderate regime status.
- Place the stop on the dotted buffered line rather than on the line itself; it never loosens either.
- Evaluate Fake Flips risk gauge before entering fresh flips.
Questions, bug reports and feature requests are welcome on the TrendTower channel: https://www.mql5.com/en/channels/trendtower
This is an indicator for analysis and decision support. It does not place trades. Always test thoroughly before using any tool in live trading. Trading involves risk.
algoteknik
Support, updates and every other product: mql5.com/en/users/bugraky123
Product channel: mql5.com/en/channels/trendtower
Smart Chandelier Exit version 1.5







































Really liking this MT5 indicator so far. It’s clean, easy to read, and gives a lot of useful information without making the chart too cluttered. The trend direction, fake flips, ATR, and execution levels are especially helpful. The recent panel positioning fix is also a nice improvement. Overall, a really solid indicator!