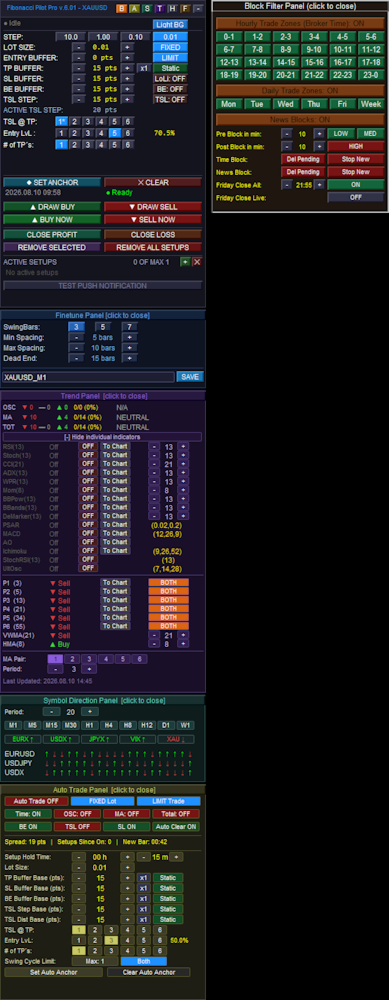
Fibonacci Pilot Pro
- 专家
- 版本: 6.6
- 激活: 10

Fibonacci Pilot Pro Overview
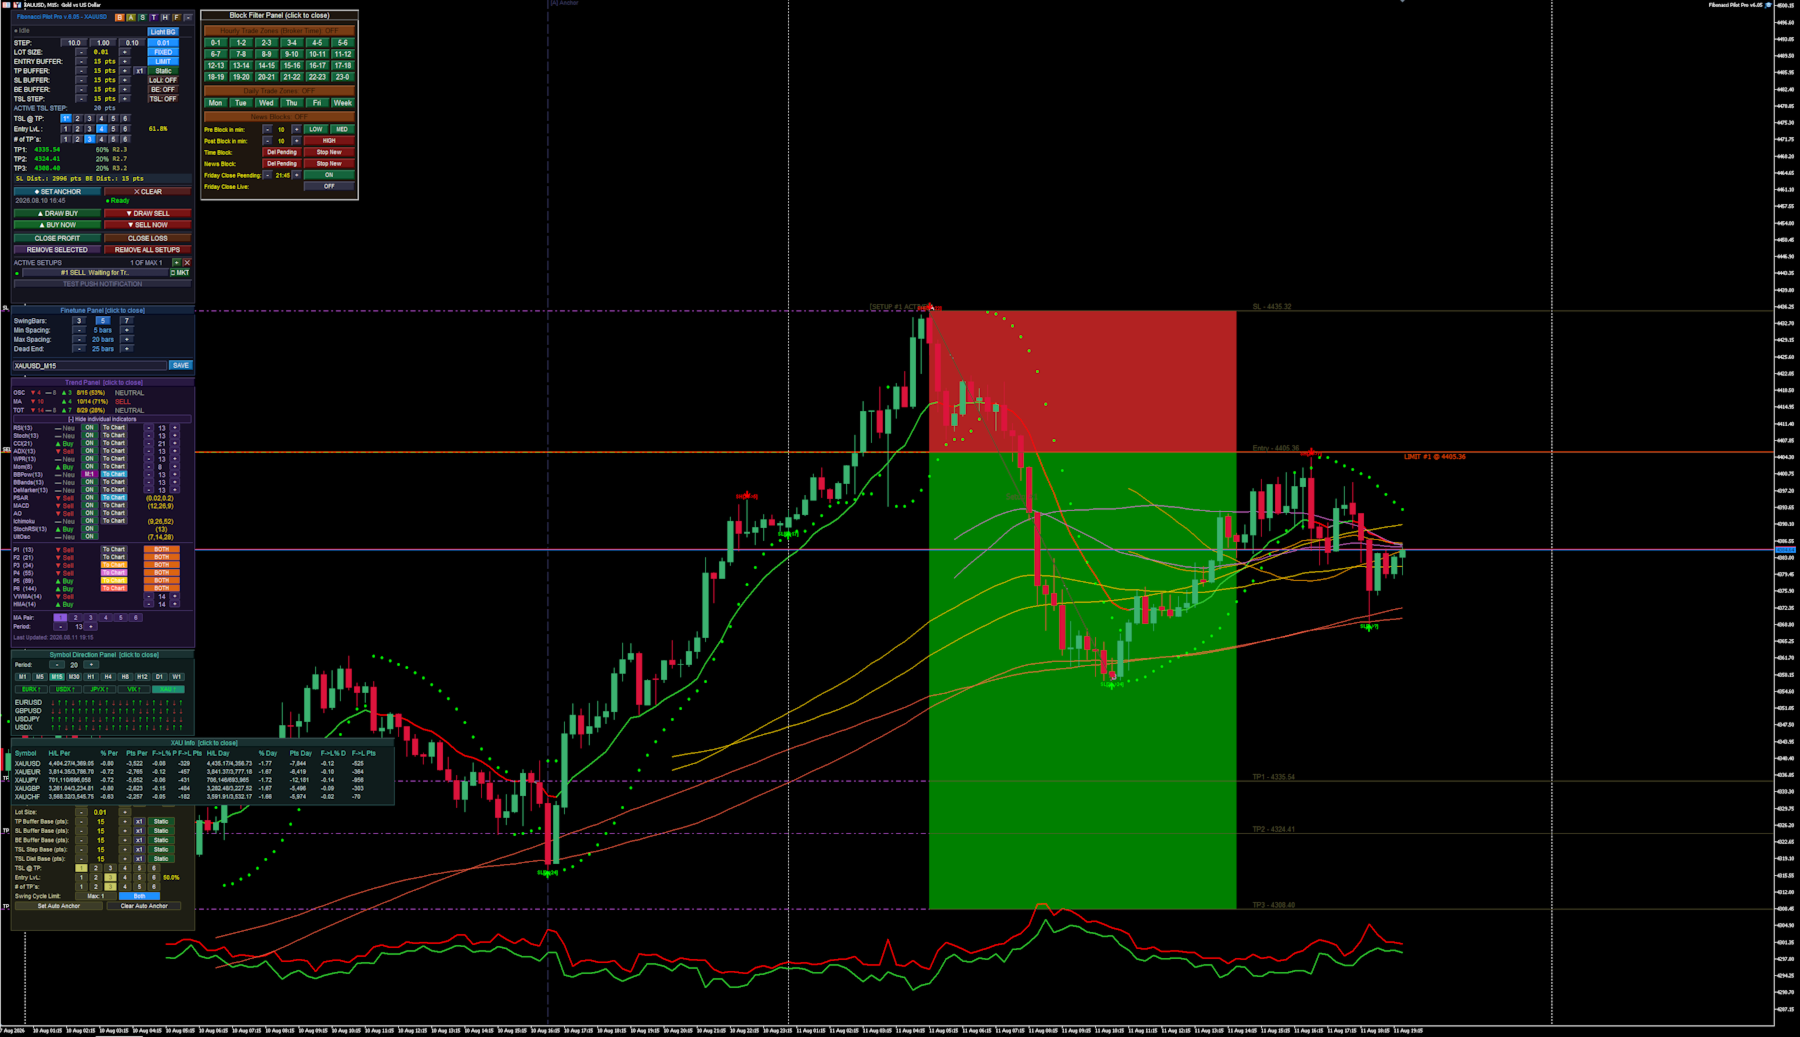
The EA functions as a comprehensive, panel-driven Fibonacci trading ecosystem designed to bridge the gap between manual chart analysis and fully automated algorithmic execution.
- Dual Execution Modes: It operates as both a visual trade assistant for manual trading and a fully autonomous robot. In manual mode, you plot Point A and Point B on the chart to instantly visualize risk/reward zones and limit entries before executing. In auto mode, it scans for market structure shifts to place trades without intervention.
- Algorithmic Swing Detection: The engine identifies market swing highs and lows using an adjustable N-bar fractal logic, complete with gap filtering and "dead-end" resets to ensure it only anchors to valid market impulses.
- Advanced Trade Management: Once a setup is live, the EA takes over position management. It scales out of positions across up to 6 custom Take Profit (TP) extension levels, automatically moves the Stop Loss to Break Even, and deploys Trailing Stops.
- Dynamic Volatility Buffers: Instead of relying solely on static point distances, all entry, stop-loss, and trailing buffers can dynamically expand or contract based on live market Spread or Average True Range (ATR).
- Multi-Indicator Trend Filtering: The EA houses an internal scoring engine that polls up to 15 different oscillators (like RSI, MACD, and Bollinger Bands) and 8 moving averages (including VWMA and HMA). It aggregates these into a master "Trend Score" to permit or block automated trades.
- Environmental & Time Blocking: It features a built-in economic calendar and time matrix. You can program the EA to sit out during specific hours, days, high-impact news spikes, or force a total square-off before the Friday market close.
- Modular Graphical Interface: Everything is controlled directly on the chart via a network of interactive, floating UI panels (Main, Trend, Auto, Block, Symbol, and Finetune). You rarely need to open the native MT5 input dialog to make adjustments.
- It is a highly flexible EA, fit to run many different strategies and on various assets. The panel driven mode makes it easy to adjust strategies on the fly, while also including a built in "Backtest" mode, that automatically disables most of the visuals when running test, speeding up the test´s.
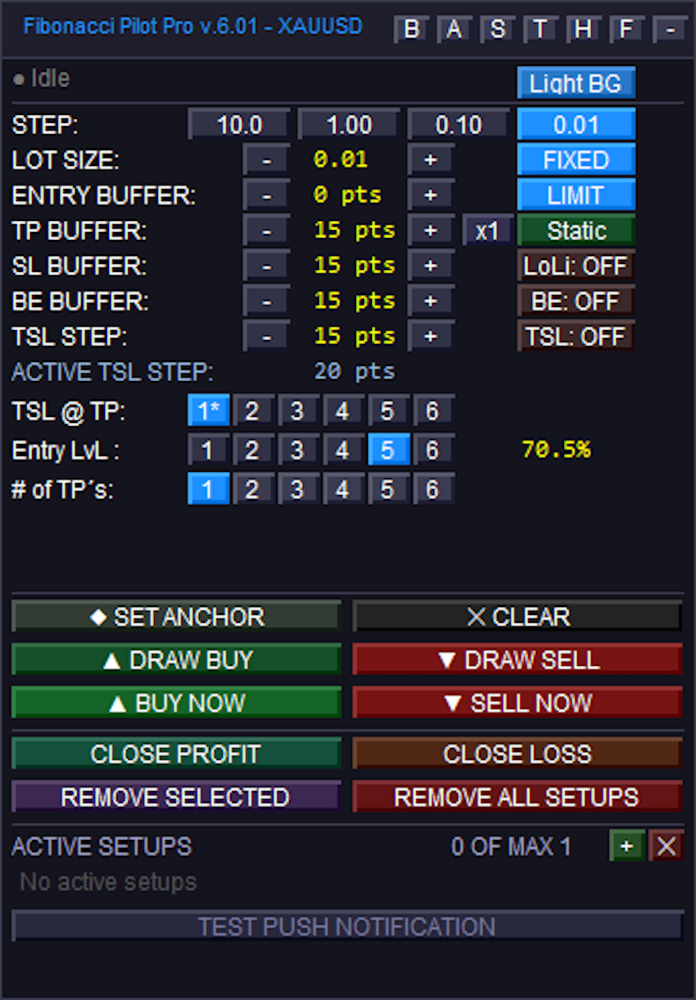
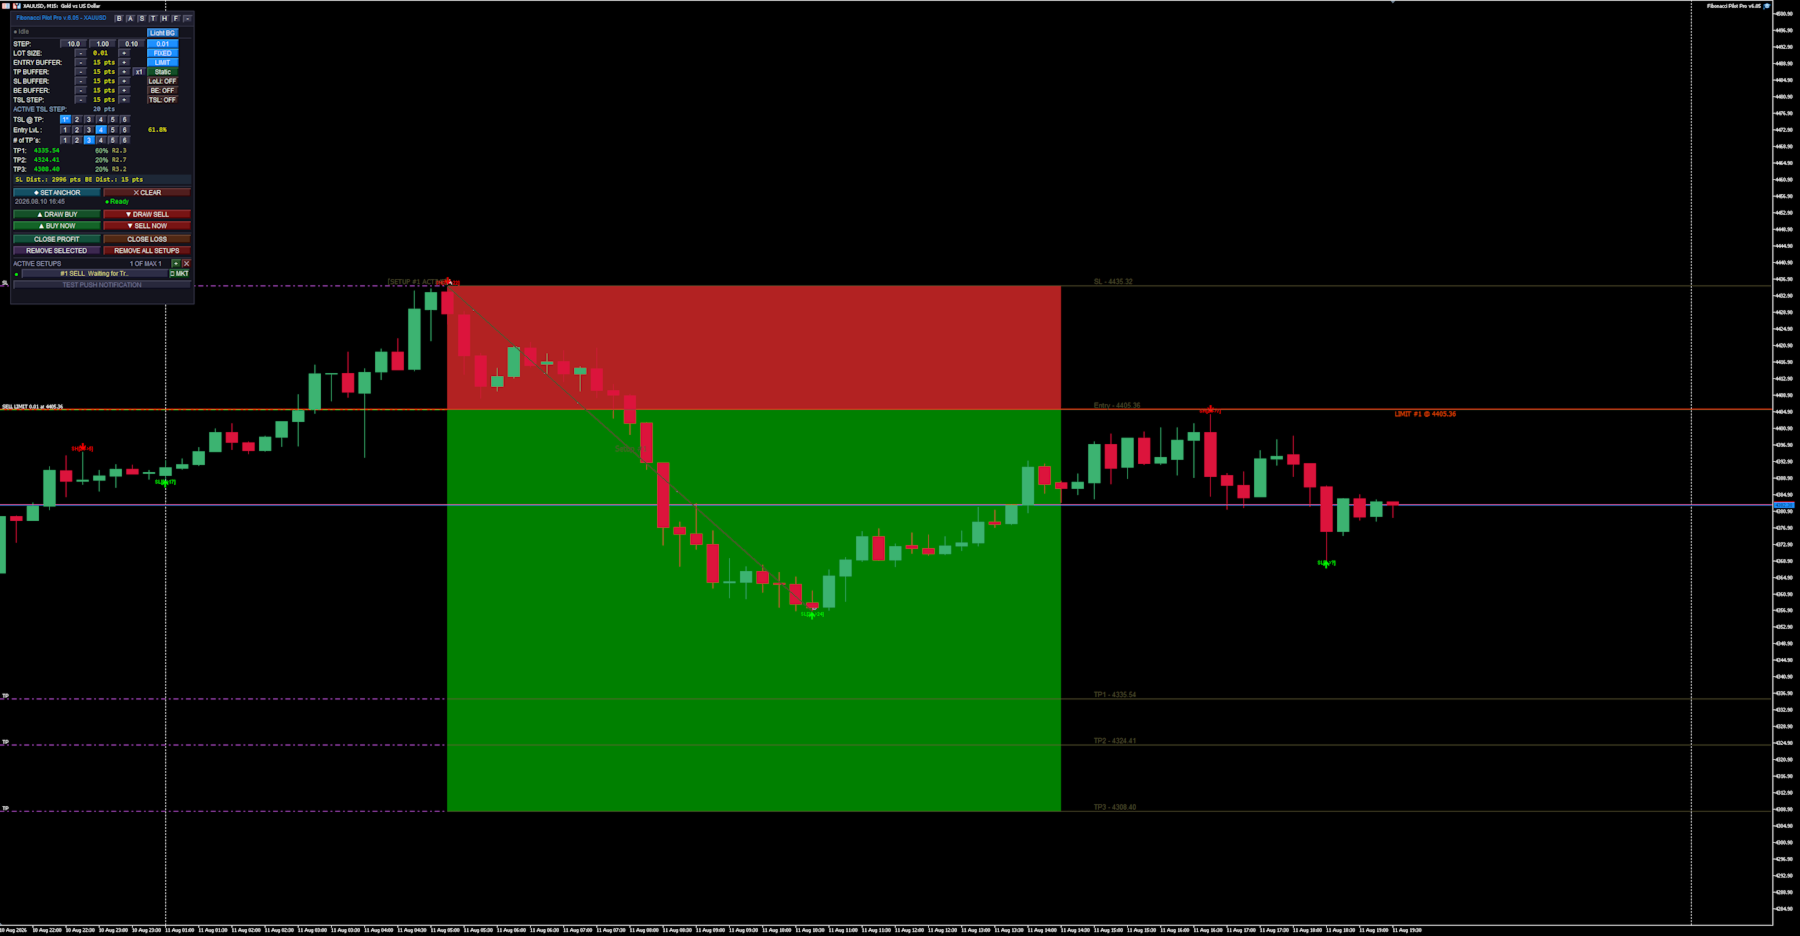
Main panel:
### Top Navigation & General Settings
Sub-Panel Toggles: The top right features small buttons to open or close specific sub-panels and modes. These toggle the Block Panel (`B`), Auto Panel (`A`), Symbol Panel (`S`), Trend Panel (`T`), Hover Info (`H`), Finetune (`F`), and Minimize (`-`).
Color Schema: Toggles the panel's visual theme. Its states alternate between "Light BG" and "Dark BG".
STEP: Four buttons used to set the increment amount for the `+` and `-` adjustments below. The states represent the point values: "10.0", "1.00", "0.10", and "0.01".
### Trade Parameters (Modifiers and Toggles)
LOT SIZE: Uses `+` and `-` to adjust volume. The adjacent toggle button switches the calculation mode, transitioning between "FIXED" lots and "Risk%".
ENTRY BUFFER: Uses `+` and `-` to adjust entry buffer distance. The adjacent toggle switches the execution mode between "LIMIT" and "INSTANT".
TP BUFFER: Uses `+` and `-` to adjust the Take Profit buffer distance. It includes a multiplier button (cycling from `x1` to `x5`) and a mode toggle that switches between "Static", "Spread", and "ATR".
SL BUFFER: Uses `+` and `-` to adjust Stop Loss distance. The adjacent toggle button controls the line extensions drawn to the left on the chart, switching between "LoLi: ON" and "LoLi: OFF".
BE BUFFER: Uses `+` and `-` to adjust Break Even locking distance. The adjacent toggle button enables or disables Break Even logic, switching between "BE: ON" and "BE: OFF".
TSL STEP: Uses `+` and `-` to adjust the Trailing Stop Loss step amount. The adjacent toggle button activates the trailing stop, switching between "TSL: ON" and "TSL: OFF".
### Fibonacci Targeting Rows
TSL @ TP: Six buttons numbered "1" to "6" used to designate which Take Profit target milestone will activate the trailing stop. The active selection will append an asterisk (e.g., `1*`) if the TSL toggle is currently active.
Entry LvL: Six buttons numbered "1" to "6" used to select which Fibonacci retracement level will dictate the entry price.
# of TP's: Six buttons numbered "1" to "6" used to select the total number of Take Profit extension levels to deploy for the setup.
### Drawing, Action, and Execution
Anchor Buttons: The "◆ SET ANCHOR" button activates manual anchor placement, changing its text to "● Click Chart..." while awaiting the user's chart click. The "✕ CLEAR" button deletes the manual anchor.
Drawing Buttons: The "▲ DRAW BUY" and "▼ DRAW SELL" buttons begin a manual drawing sequence. During the drawing process, they combine into a single button that changes states to indicate the current step: "— Awaiting Point A — CANCEL", "— Awaiting Point B — CANCEL", or "↺ RESET" (if the setup is fully drawn but unplaced).
Execution Buttons: When idle, these function as instant execution triggers, reading "▲ BUY NOW" and "▼ SELL NOW". If a limit setup has been successfully drawn on the chart, they transition to "▲ PLACE BUY" and "▼ PLACE SELL" to arm the pending limits.
Close Conditions: The "CLOSE PROFIT" and "CLOSE LOSS" buttons are used to force-close the currently selected active setup, provided the market is in the corresponding profit or loss state.
Removal Actions: "REMOVE SELECTED" deletes the highlighted setup, while "REMOVE ALL SETUPS" wipes all active setups from the chart.
### Setup Management List
List Controls: The green `+` button initializes a new blank setup slot, and the red `✕` button clears away all closed, cancelled, or inactive setups from the list.
Active Setup Rows: Clickable rows that select a specific setup and display its state (e.g., "Idle", "Limit Active", "Running"). If the setup is currently a pending limit order, an inline execution button appears reading "▶ MKT", which allows the user to immediately force the limit to execute at market price.
Test Push: The "TEST PUSH NOTIFICATION" button manually triggers a test alert to confirm mobile terminal notifications are configured correctly.
Finetune Panel:
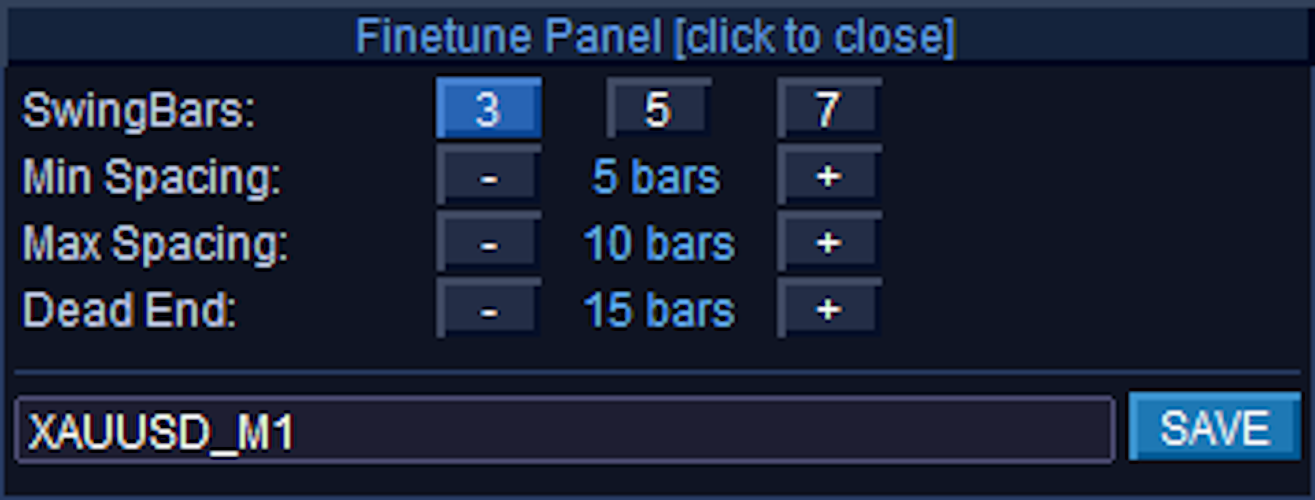
### Finetune Panel Controls
Finetune Panel [click to close]: The entire top header bar functions as a button to minimize/hide the panel from the chart.
SwingBars: Three toggle buttons labeled "3", "5", and "7" that determine the fractal sensitivity (N-bar dominance) for detecting swing highs and lows. The currently selected mode is highlighted in bright blue, while the inactive options remain dark.
Min Spacing: Uses the `-` and `+` buttons to adjust the minimum number of chart bars required between opposite swings (e.g., from a Swing High to a Swing Low). The middle label displays the current value in bars, and changes to read "off" if the value is reduced to 0.
Max Spacing: Uses the `-` and `+` buttons to adjust the preferred maximum gap between opposite swings. Like Min Spacing, the label displays the value in bars and shifts to "off" if set to 0.
Dead End: Uses the `-` and `+` buttons to set the maximum allowed distance before a "dead end" warning is triggered, which reinstates the nearest suppressed swing if a gap gets too large. The label displays the current value in bars and shifts to "off" if set to 0.
Preset Name (Text Box): This is an editable text input field (showing "XAUUSD_M1" in your image) rather than a standard button. It automatically defaults to the current chart symbol and timeframe, but allows you to type in a custom filename.
SAVE: Clicking this button takes the current SwingBars, Min Spacing, Max Spacing, and Dead End values and writes them to a `.set` file in your terminal's `Presets\` folder, using the exact name typed in the text box next to it.
Trend Panel:
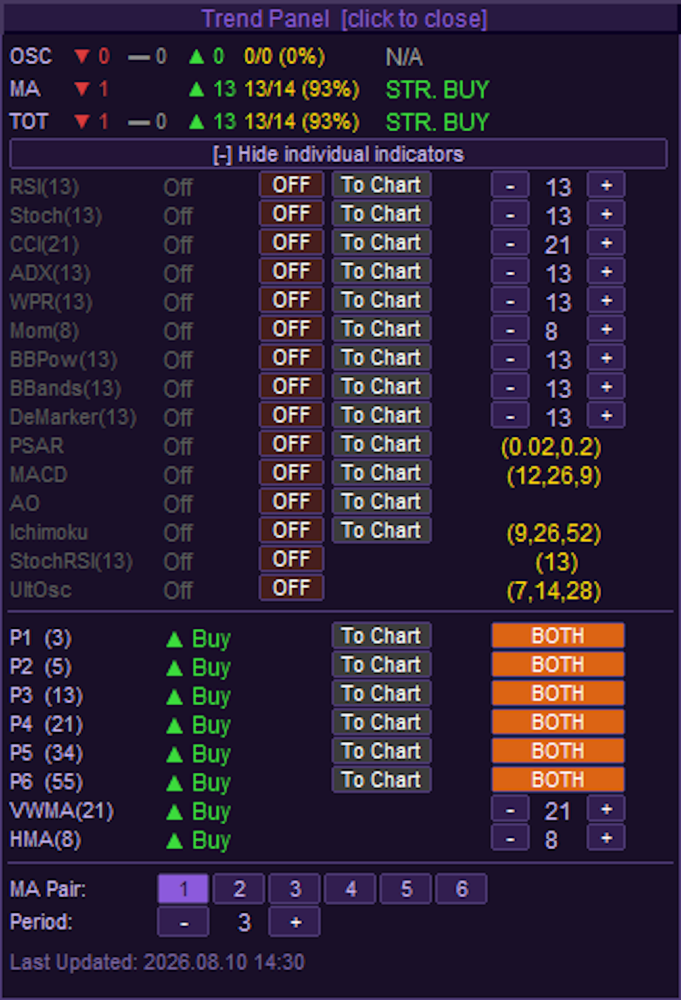
### Header & Layout Controls
Trend Panel [click to close]: The top header bar acts as a button to completely hide the Trend Panel from the chart.
Expand / Collapse Toggle: The full-width button just below the score summary toggles the expanded view. It switches states between "[-] Hide individual indicators" and "[+] Show individual indicators".
### Individual Oscillator Controls
ON/OFF State Toggles: The column of buttons currently displaying "OFF" in brown/dark red controls whether that specific indicator contributes to the overall Trend score. When clicked, they switch to an active "ON" state (green).
Note on BBPow: The Bull/Bear Power indicator has a special 3-state toggle instead of a standard ON/OFF. It cycles between "OFF" (red), "M:1" (purple), and "M:2" (magenta) to dictate different visual color modes when plotted.
To Chart: Injects the indicator visually onto your main chart or into a sub-window. When inactive, the button is grey; when active, it highlights in bright blue. *(Note: StochRSI and UltOsc do not have "To Chart" buttons)*.
Period Steppers (`-` and `+`): For the top 9 basic oscillators (RSI through DeMarker), these buttons dynamically adjust the lookback period, which updates the number in the middle. The bottom 6 complex oscillators (PSAR through UltOsc) use fixed parameters configured in the EA settings, represented by the static gold text instead of buttons.
### Moving Average (MA) Grid Controls
MA Mode Toggles: The column of buttons on the far right of the MA list (currently showing "BOTH" in orange) cycles the specific moving average calculation type for slots P1 through P6. Clicking them rotates the state between "OFF" (dark red), "EMA" (green), "SMA" (blue), and "BOTH" (orange).
To Chart: Renders the active MA pair directly onto the price chart. When activated, the button color changes from grey to explicitly match the color of the corresponding lines drawn on the chart (e.g., DeepSkyBlue, LimeGreen, Orange, etc.).
VWMA & HMA Steppers (`-` and `+`): These buttons adjust the lookback periods specifically for the Volume Weighted MA and Hull MA.
### Bottom Configuration Panel
MA Pair (1 through 6): These six buttons select which specific MA Pair slot (P1-P6) you want to configure. The currently selected slot is highlighted in bright purple/blue, while the others remain dark.
Period (`-` and `+`): These steppers directly alter the lookback period for whichever MA Pair is currently highlighted in the row above it.
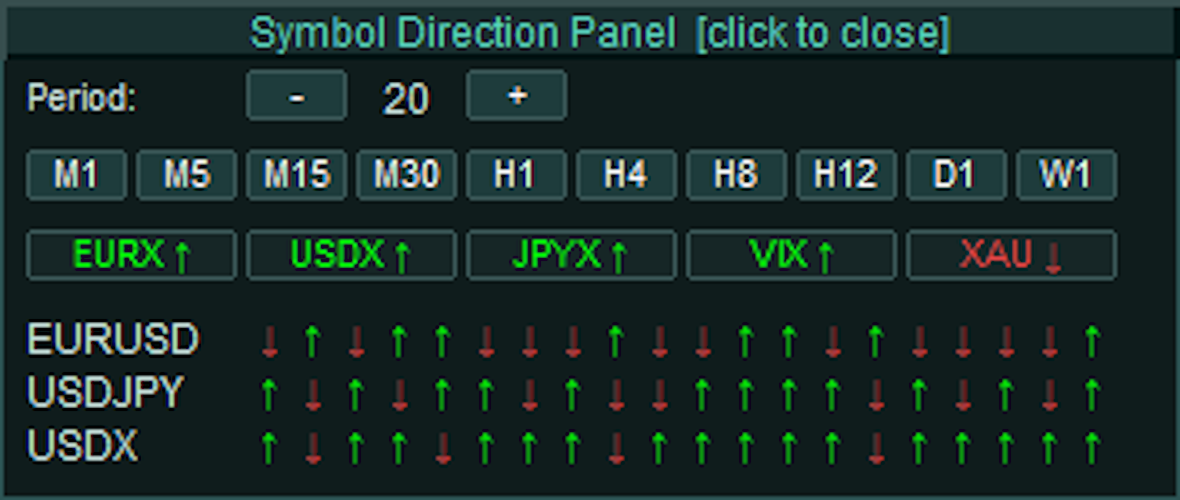
Symbol Direction Panel:
### Header & Layout Controls
Symbol Direction Panel [click to close]: The top header bar acts as a single, full-width button to completely hide the Symbol Panel from the chart.
### Timeframe & Period Controls
Period (`-` and `+`): These stepper buttons adjust the number of historical bars evaluated for the directional arrows. Clicking them increases or decreases the value displayed in the center, ranging from a minimum of 3 up to a maximum of 20 bars.
Timeframe Quick-Select (M1 to W1): A row of ten buttons used to select the active timeframe for the panel's data calculation, operating completely independently of your main chart's timeframe.
State: The currently selected timeframe (e.g., "M30" in your image) highlights with a brighter teal background, while inactive timeframes remain a darker muted teal.
### Highlight Basket Slots
Basket Buttons (e.g., EURX, USDX, XAU): A dynamic row of interactive buttons representing user-defined individual indices or multi-symbol baskets parsed from the EA's settings. Clicking one of these buttons opens a secondary "Highlight Info HUD" to provide a detailed statistical breakdown of its internal components.
Text & Arrow State: The text and directional arrow on the button dynamically change color to reflect the aggregate momentum of the basket's members over the selected period. Green with an up arrow (↑) indicates bullish dominance, Red with a down arrow (↓) indicates bearish dominance, and Grey with a right arrow (→) indicates a neutral or invalid state.
Background State: When actively clicked to display its Info HUD, the button's background highlights in bright teal. When closed/inactive, it remains a dark slate color.
(Note: The bottom section displaying specific symbols like EURUSD, USDJPY, and USDX alongside their respective red and green arrows are non-interactive informational text labels, not clickable buttons. They visually map the close-versus-open direction of the most recent bars based on your specific Period and Timeframe settings).
Symbol Direction Panel - Highlight Info HUD:
The data is split into two halves: **Period** statistics and **Day** statistics.
### Period Statistics (Per)
These calculations are dynamically based on the exact Timeframe and Period limit you set on the main Symbol Panel (e.g., the last 20 bars on the M30 chart).
Symbol: The individual asset within the basket (e.g., XAUUSD, XAUEUR).
H/L Per: The absolute highest price and lowest price reached during your defined period.
% Per & Pts Per: The total range of movement between that period's High and Low, measured in both percentage and raw points.
F->L% P & F->L Pts: Stands for "First to Last". This measures the net momentum by comparing the opening price of the *first* bar in your period to the closing price of the *last* bar, displayed in percentages and points.
### Daily Statistics (Day)
These calculations completely ignore your panel settings and look strictly at the current daily candle (`PERIOD_D1`) to give you a macro perspective of today's price action.
H/L Day: The absolute highest and lowest prices reached today.
% Day & Pts Day: The total range of movement between today's High and Low, measured in percentages and points.
F->L% D & F->L Pts: The "First to Last" net change for the current day. This directly compares today's Daily Open price against the current live price, telling you exactly how far the asset is up or down on the day in both percentages and points.
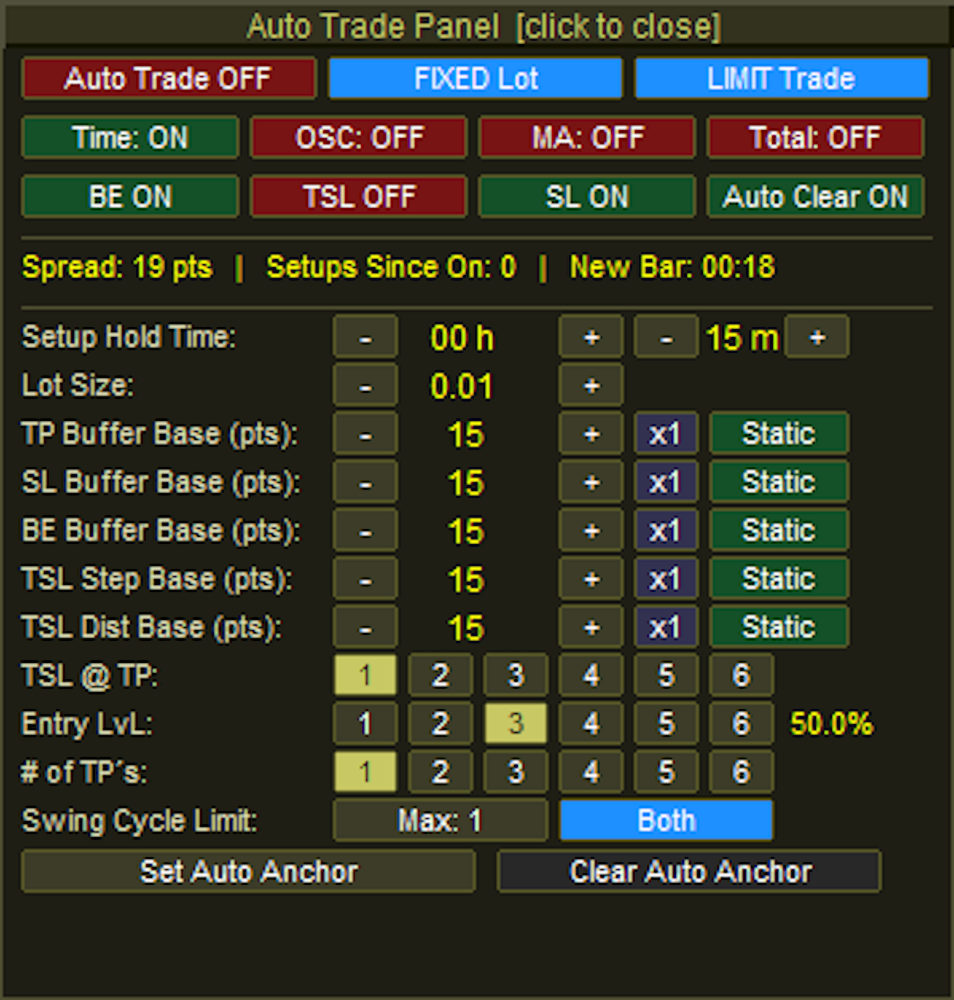
Auto Trade Panel:
### Header & Top Execution Controls
Auto Trade Panel [click to close]: The top header bar acts as a full-width button to minimize and hide the Auto Panel from the chart.
Auto Trade Master Toggle: Enables or disables the entire automated trading engine. The button switches between "Auto Trade OFF" (Red) and "Auto Trade ON" (Green).
Lot Type Toggle: Switches the volume calculation method between "FIXED Lot" (Blue) and "RISK %" (Orange).
Order Mode Toggle: Cycles through the execution methods the EA will use when a setup is detected. It rotates between "LIMIT Trade" (Blue), "INSTANT Trade" (Orange), and "BREAKOUT" (Purple).
### Filter & Management Toggles
Filters Row (Time, OSC, MA, Total): Four independent toggle buttons that enforce specific entry conditions before an auto-trade is allowed. Each button flips between an active "ON" state (Green) and an inactive "OFF" state (Red).
Management Row (BE, TSL, SL, Auto Clear): Four independent toggles managing the lifecycle of the auto-trade. They control whether Break Even, Trailing Stops, and Master Stop Losses are applied, as well as if closed setups are automatically removed from the screen. Like the filters, they alternate between Green ("ON") and Red ("OFF").
### Inputs, Steppers, & Dynamic Buffers
Setup Hold Time: Two pairs of `-` and `+` stepper buttons. The first pair adjusts the expiration hours (e.g., `00 h`), and the second pair adjusts the expiration minutes (e.g., `15 m`). If a pending limit order is not triggered within this window, the EA cancels it.
Lot Size / Risk %: Uses `-` and `+` buttons to adjust the trading volume. The text label dynamically changes based on the Lot Type toggle in the top row.
Buffer Base Rows (TP, SL, BE, TSL Step, TSL Dist):
Base Steppers (`-` and `+`): Adjusts the raw point value for the respective buffer.
Multiplier Button: A clickable button (e.g., `x1`) that cycles from `x1` up to `x5`. This multiplies the dynamic volatility value if a dynamic mode is selected.
Mode Toggle: Cycles the calculation method for the buffer. It rotates between "Static" (Green), "Spread" (Red), and "ATR" (Blue). *(Note: The TP Buffer has a fourth option: "TP+Sprd")*.
### Targeting Matrices
TSL @ TP: Six buttons numbered "1" to "6" used to designate which Take Profit target milestone must be reached to activate the trailing stop. The active selection is highlighted in khaki/yellow, while inactive slots are dark grey.
Entry LvL: Six buttons numbered "1" to "6" that dictate which Fibonacci retracement level the pending order will be placed at. A text label to the right automatically displays the corresponding percentage (e.g., `50.0%`).
# of TP's: Six buttons numbered "1" to "6" that determine the total number of Take Profit extension levels to deploy for the auto-setup.
### Cycle Limit, Direction, & Anchors
Swing Cycle Limit: A button that increments the maximum allowed consecutive setups the EA will trade off the same Point A anchor. It increments up to your global `MaxSetups` limit before resetting to 1.
Direction Toggle: Cycles the permitted market direction for automated entries. It rotates between "Both" (Blue), "Bullish" (Green), and "Bearish" (Red).
Anchor Buttons:
Set Auto Anchor: Initiates the manual selection of the auto-trade starting point. When clicked, the button turns a muted gold and the text changes to "Click Chart..." while awaiting the user's input.
Clear Auto Anchor: Wipes the active automated anchor line from the chart and halts the auto-scanning engine.
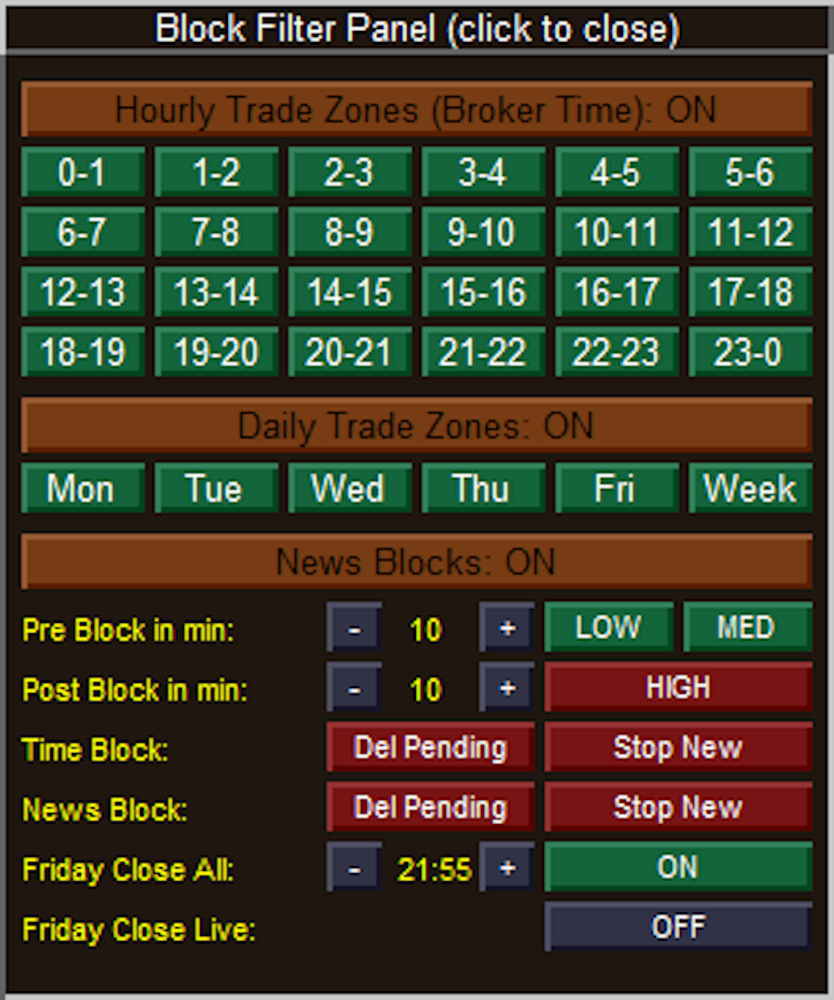
Block Filter Panel:
### Header & Master Toggles
Block Filter Panel (click to close): The topmost header bar acts as a full-width button to minimize and completely hide the Block Filter Panel from the chart.
Hourly Trade Zones (Broker Time): A master toggle header that enables or disables the entire 24-hour time-blocking matrix below it. The text dynamically updates between "ON" and "OFF".
Daily Trade Zones: A master toggle header that enables or disables the specific days-of-the-week blocking matrix below it.
News Blocks: A master toggle header that enables or disables the entire economic calendar filtering engine.
### Matrix Controls (Hourly & Daily)
24-Hour Matrix (0-1 through 23-0): Individual toggle buttons for every hour of the day.
State: Green indicates trading is Allowed during that hour. Red indicates trading is Blocked.
Daily Matrix (Mon through Week): Individual toggle buttons for specific trading days, where "Week" represents the weekend (Saturday/Sunday).
State: Green indicates trading is Allowed on that day. Red indicates trading is Blocked.
### News & Safety Filter Settings
Pre & Post Block in min: Uses `-` and `+` stepper buttons to define the safety window (in minutes) surrounding an economic news event.
Impact Toggles (LOW, MED, HIGH): Three separate buttons to determine which levels of economic news impact will trigger a trading suspension.
State: Green means the block is inactive (the EA will ignore news of this impact level). Red means the block is active (trading will be suspended for these events).
Time Block Actions: Two action toggles dictating what the EA should do when a scheduled Hourly or Daily block begins.
Del Pending: If Red (ON), un-triggered pending limit orders will be deleted. If Green (OFF), pending orders are left alone.
Stop New: If Red (ON), the EA is forbidden from calculating and placing new trades. If Green (OFF), new trades are permitted.
News Block Actions: Two action toggles dictating what the EA should do when an active News event hits its pre- or post-block window. They function exactly the same as the Time Block Actions, turning Red when active and Green when inactive.
### Friday Close Options
Friday Close All: Enables the failsafe to halt Friday trading based on a specific cutoff time.
Time Steppers: The `-` and `+` buttons adjust the cutoff time (displayed in the center) in 15-minute increments.
Toggle State: The rightmost button switches the feature between "ON" (Green) and "OFF" (Dark Grey).
Friday Close Live: Dictates whether the EA should aggressively force-close actively running, live trades when the Friday cutoff time is reached. The button switches between "ON" (Green) and "OFF" (Dark Grey).
Hover Panel:
SH 2026.08.10 10:24:** Identifies the type of swing and its exact timestamp. **SH** stands for **S**wing **H**igh (a market peak), whereas a trough would display **SL** for **S**wing **L**ow. The red color corresponds to your bearish/high settings.
Price: The exact price level of that specific swing point (the absolute high of that candle's wick). If this swing point was currently being used as Point A or Point B for an active setup, an extra tag would appear here to let you know.
Left spacing: Shows there are 10 bars between this swing high and the previous swing point recorded on the chart. The text is green because 10 bars passes your EA's minimum spacing filter.
Right spacing: Shows there are 7 bars between this swing high and the *next* swing point that formed after it.
Status (Confirmed): This means the swing has fully passed your "SwingBars" fractal requirement (e.g., if set to 5 bars, it successfully formed the required lower highs on both the left and right sides). If a swing was still forming on the live edge of the market, this would read "Pending", and if it was brought back by your Dead End filter, it would read "Rescued*".
▲ 2463 pts from current: This is a live distance tracker. It tells you that this specific swing high is exactly 2,463 points *above* (indicated by the up arrow) the current live market price.
Symbol Direction Panel - Highlight Info HUD:
The data is split into two halves: **Period** statistics and **Day** statistics.
### Period Statistics (Per)
These calculations are dynamically based on the exact Timeframe and Period limit you set on the main Symbol Panel (e.g., the last 20 bars on the M30 chart).
Symbol: The individual asset within the basket (e.g., XAUUSD, XAUEUR).
H/L Per: The absolute highest price and lowest price reached during your defined period.
% Per & Pts Per: The total range of movement between that period's High and Low, measured in both percentage and raw points.
F->L% P & F->L Pts: Stands for "First to Last". This measures the net momentum by comparing the opening price of the *first* bar in your period to the closing price of the *last* bar, displayed in percentages and points.
### Daily Statistics (Day)
These calculations completely ignore your panel settings and look strictly at the current daily candle (`PERIOD_D1`) to give you a macro perspective of today's price action.
H/L Day: The absolute highest and lowest prices reached today.
% Day & Pts Day: The total range of movement between today's High and Low, measured in percentages and points.
F->L% D & F->L Pts: The "First to Last" net change for the current day. This directly compares today's Daily Open price against the current live price, telling you exactly how far the asset is up or down on the day in both percentages and points.