Market Evolution Tree

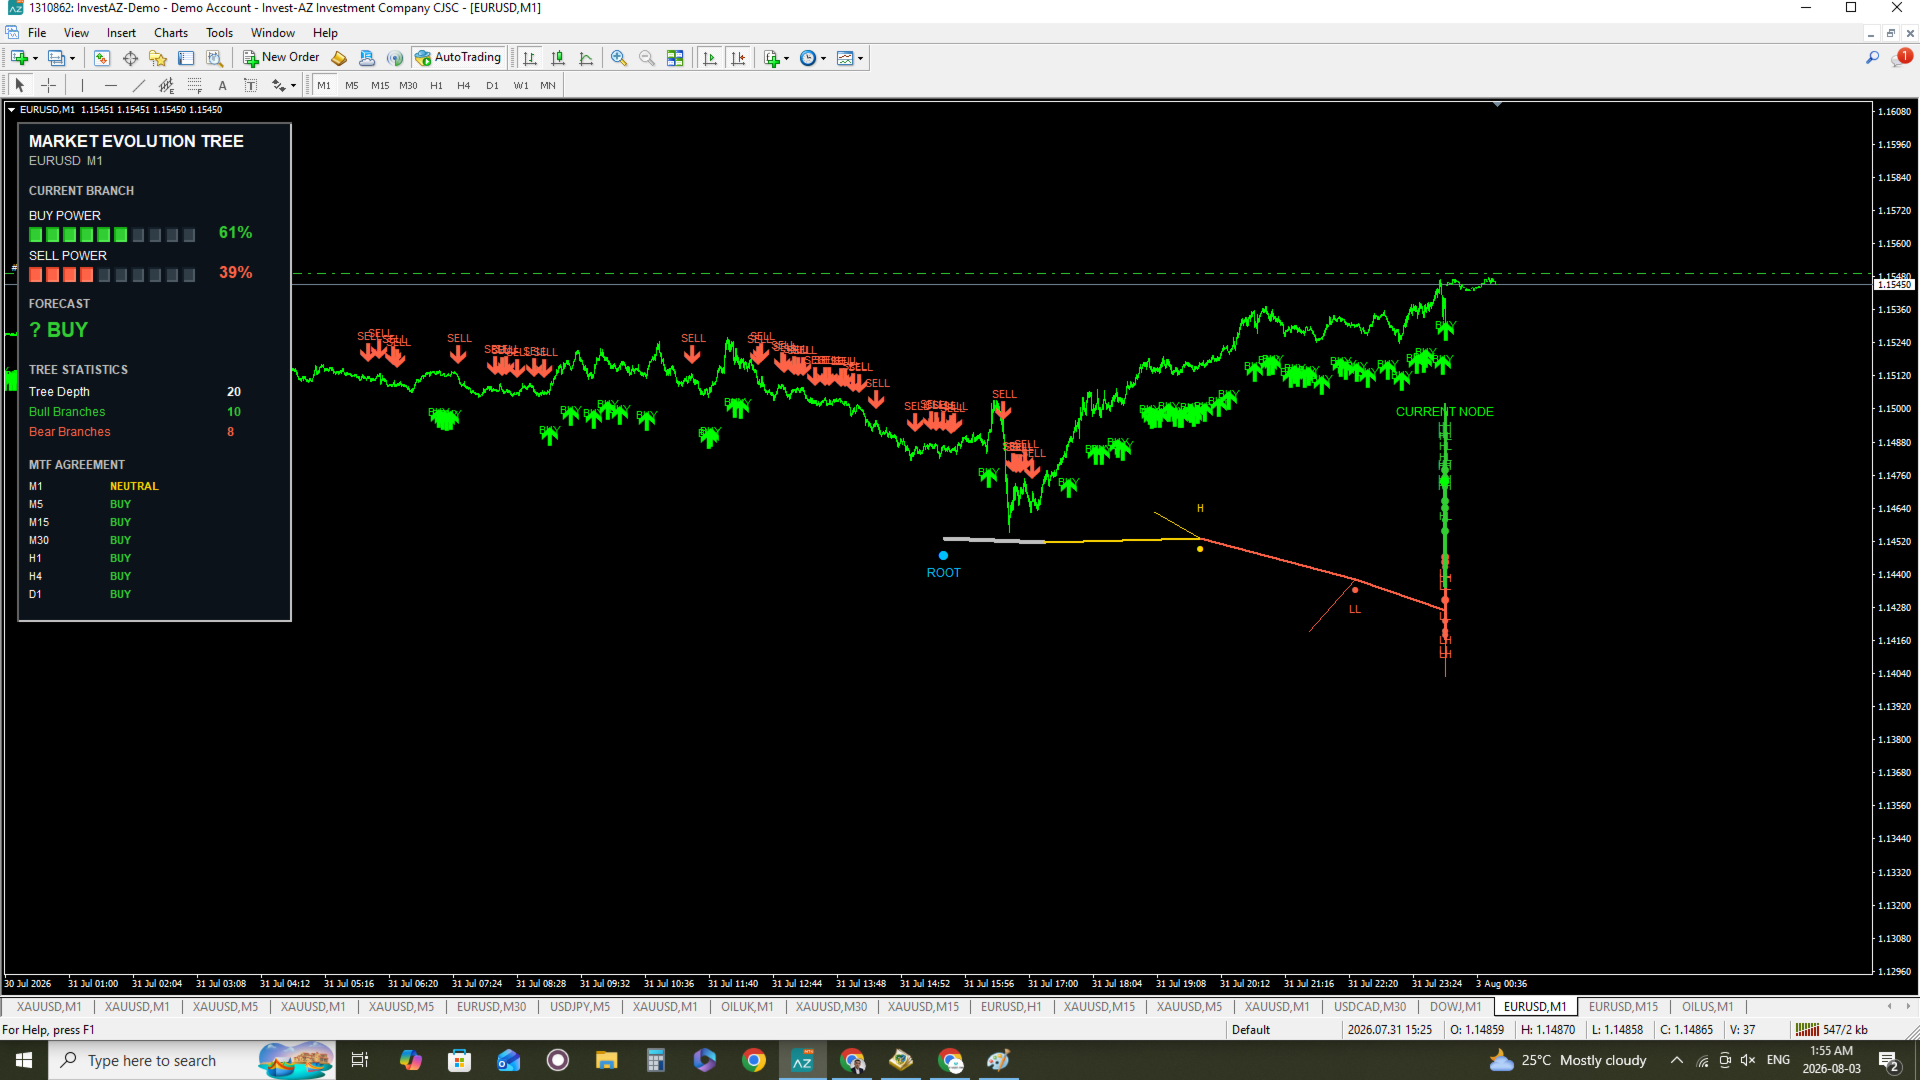
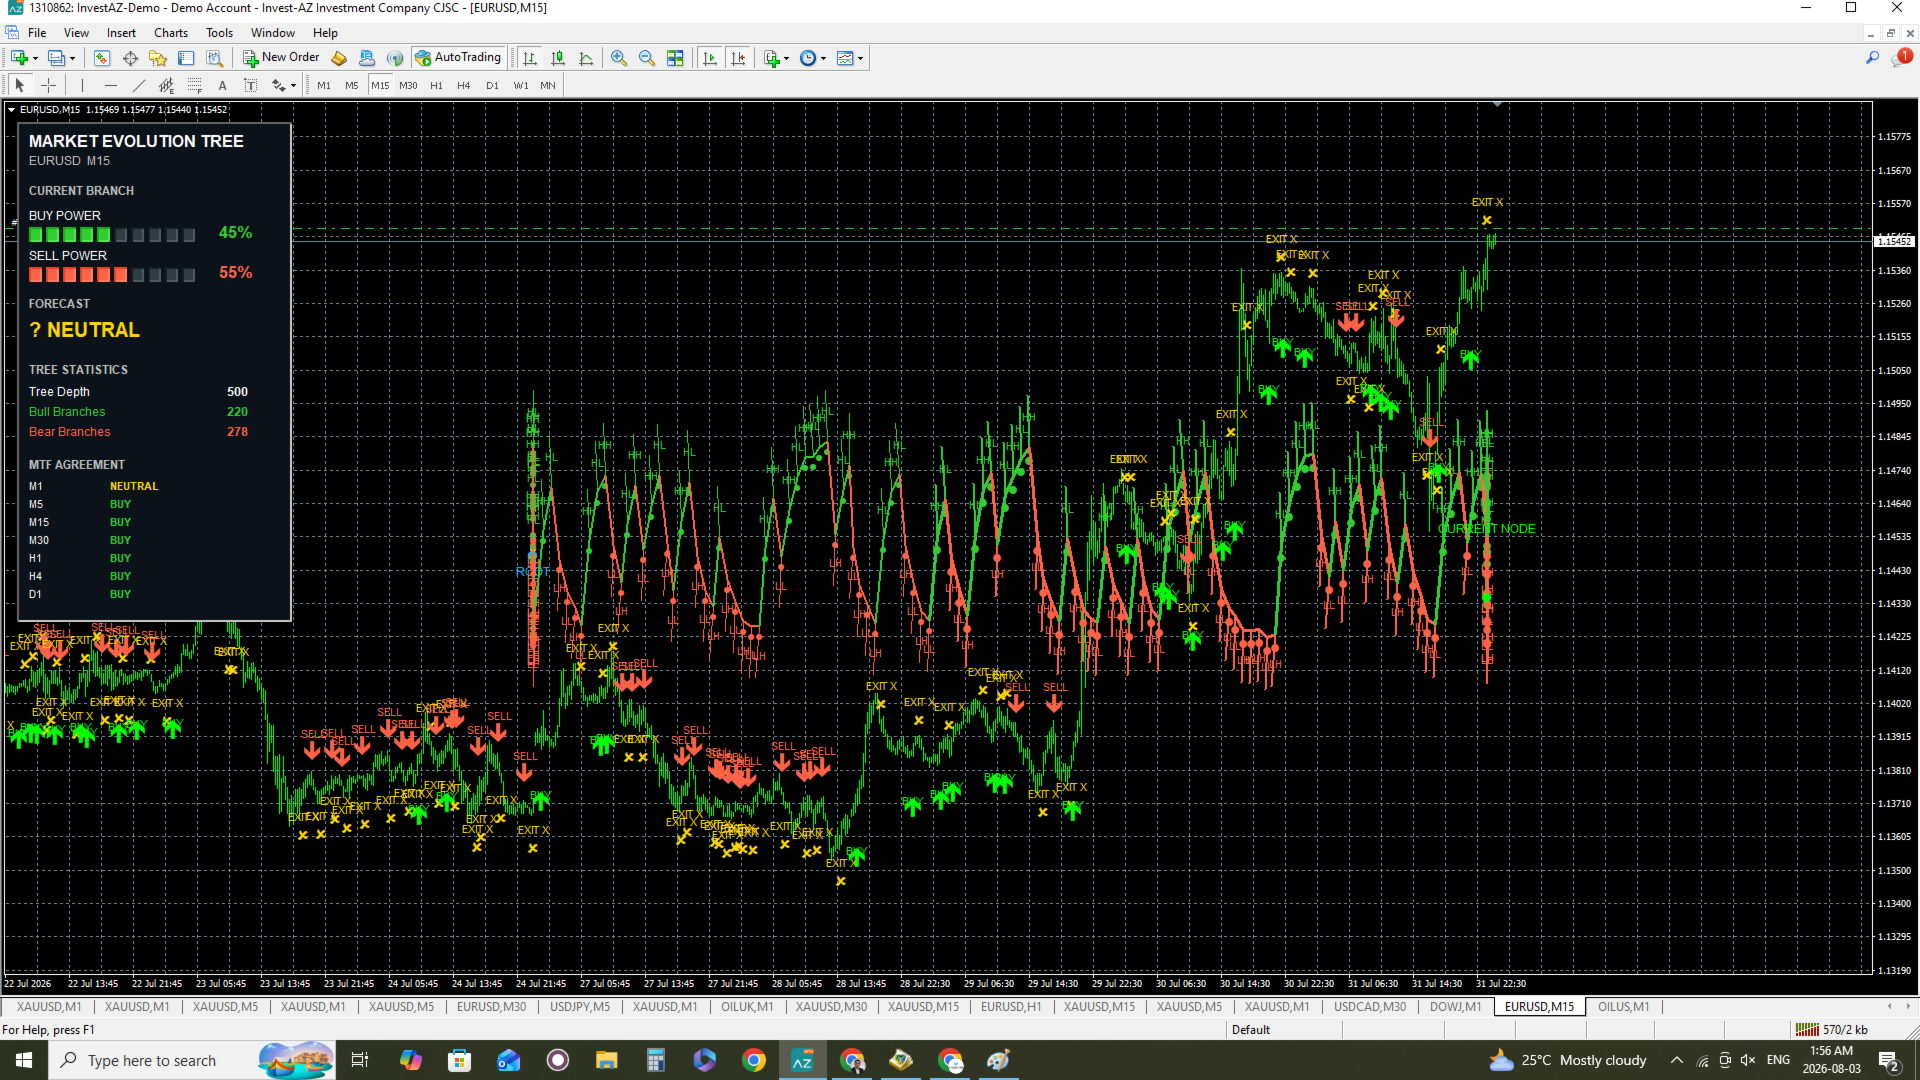
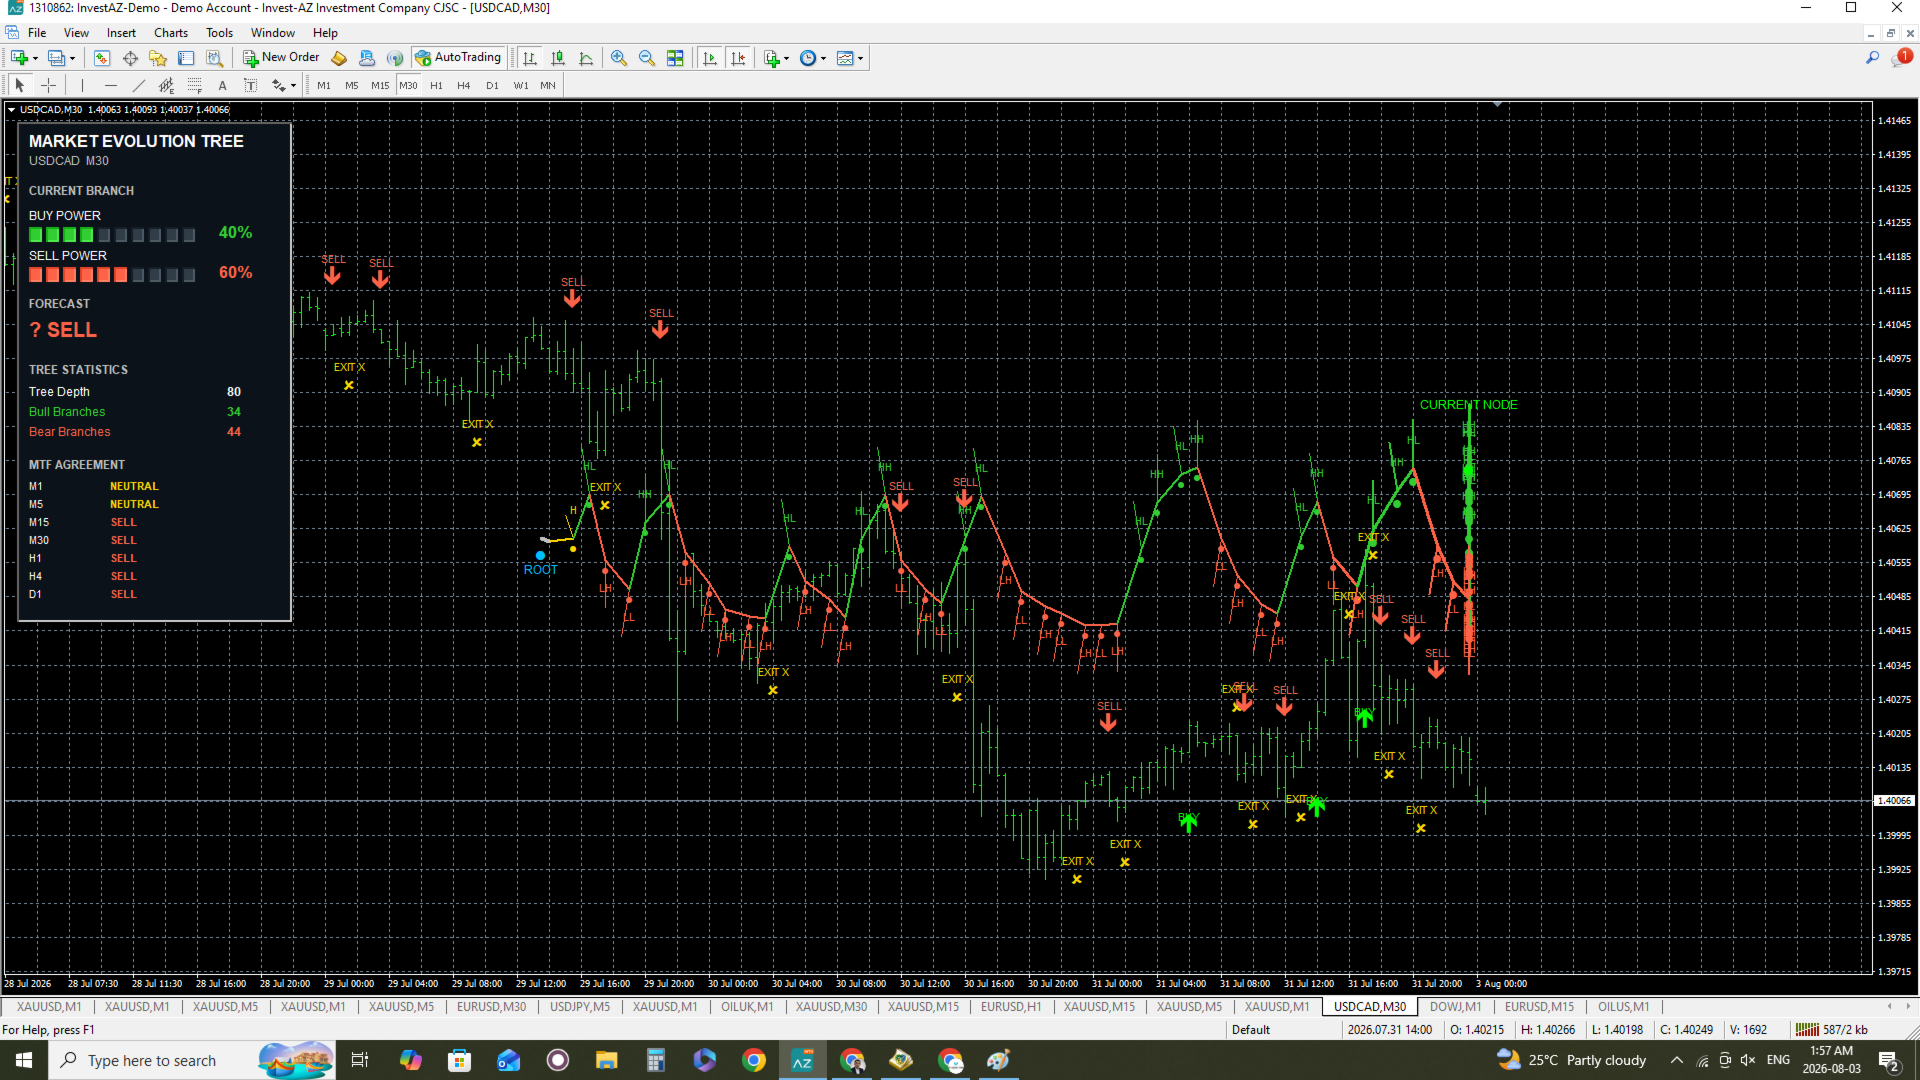
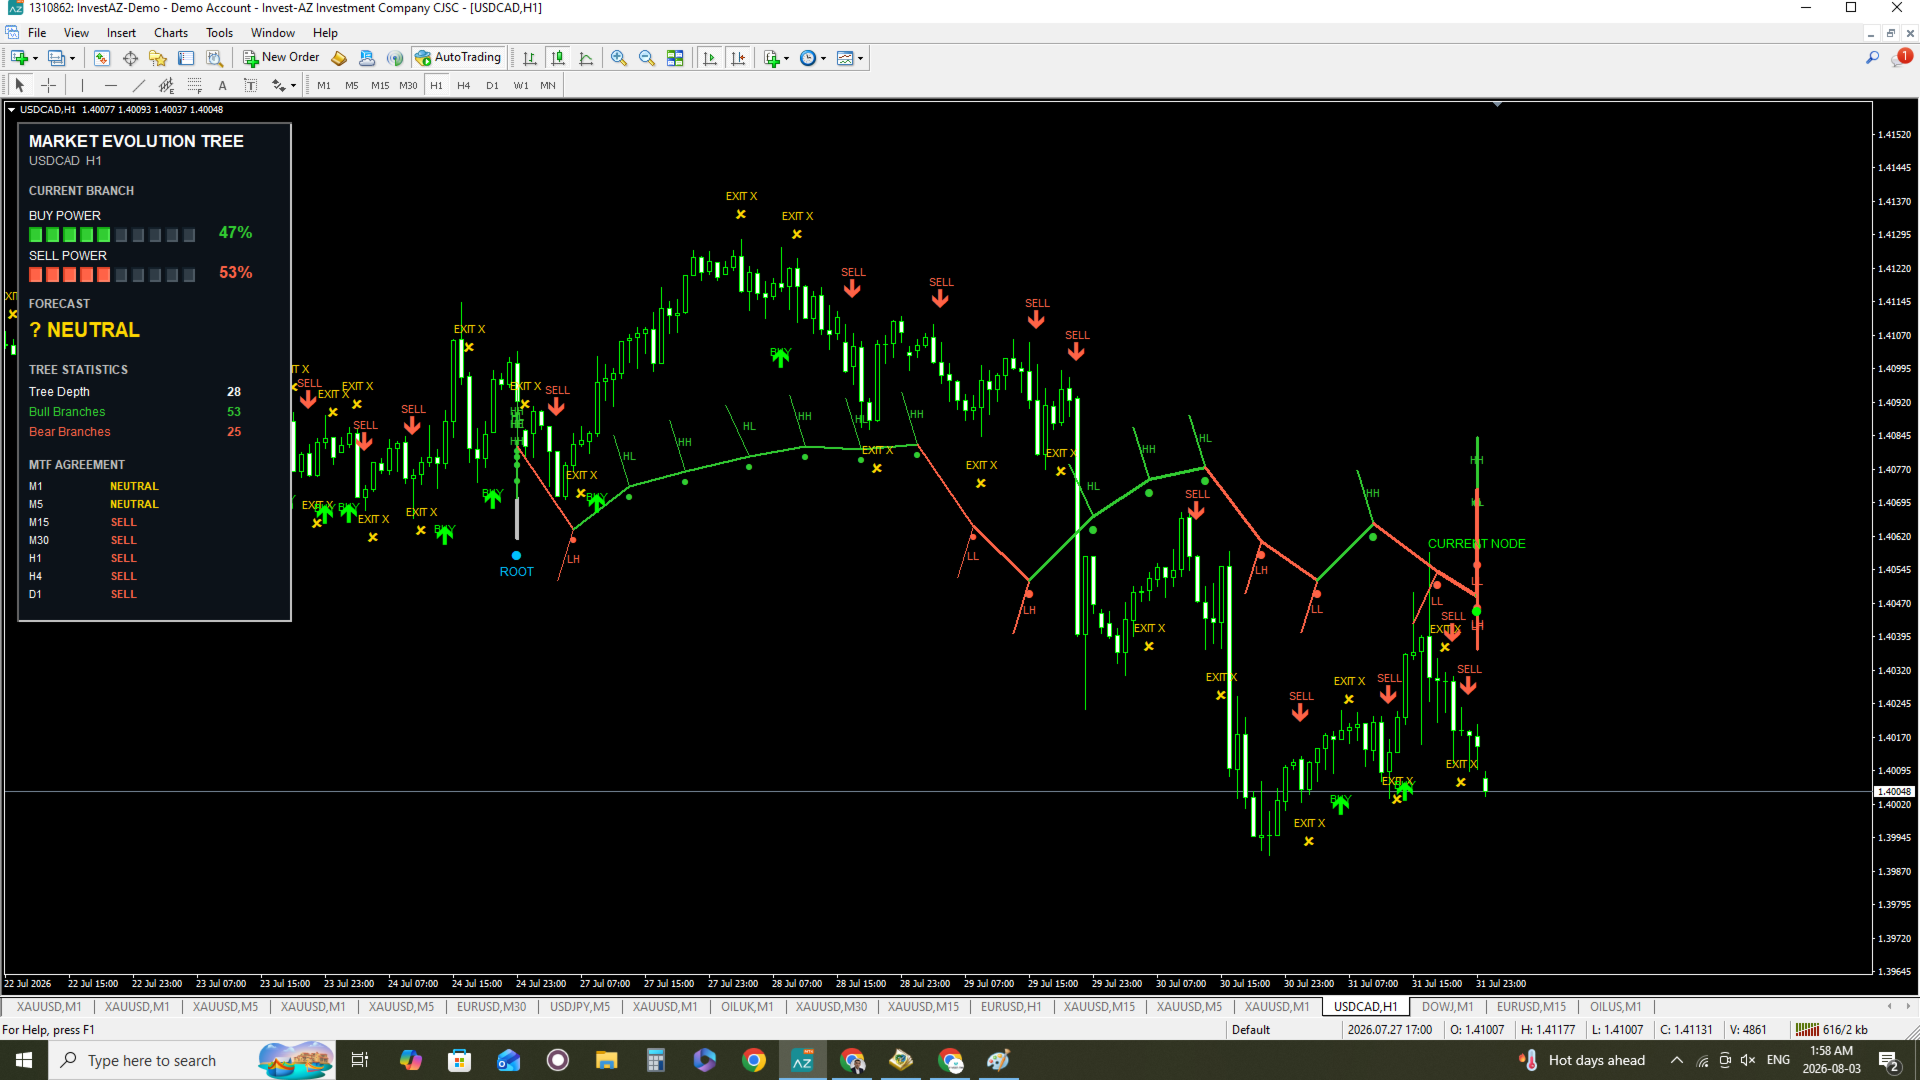
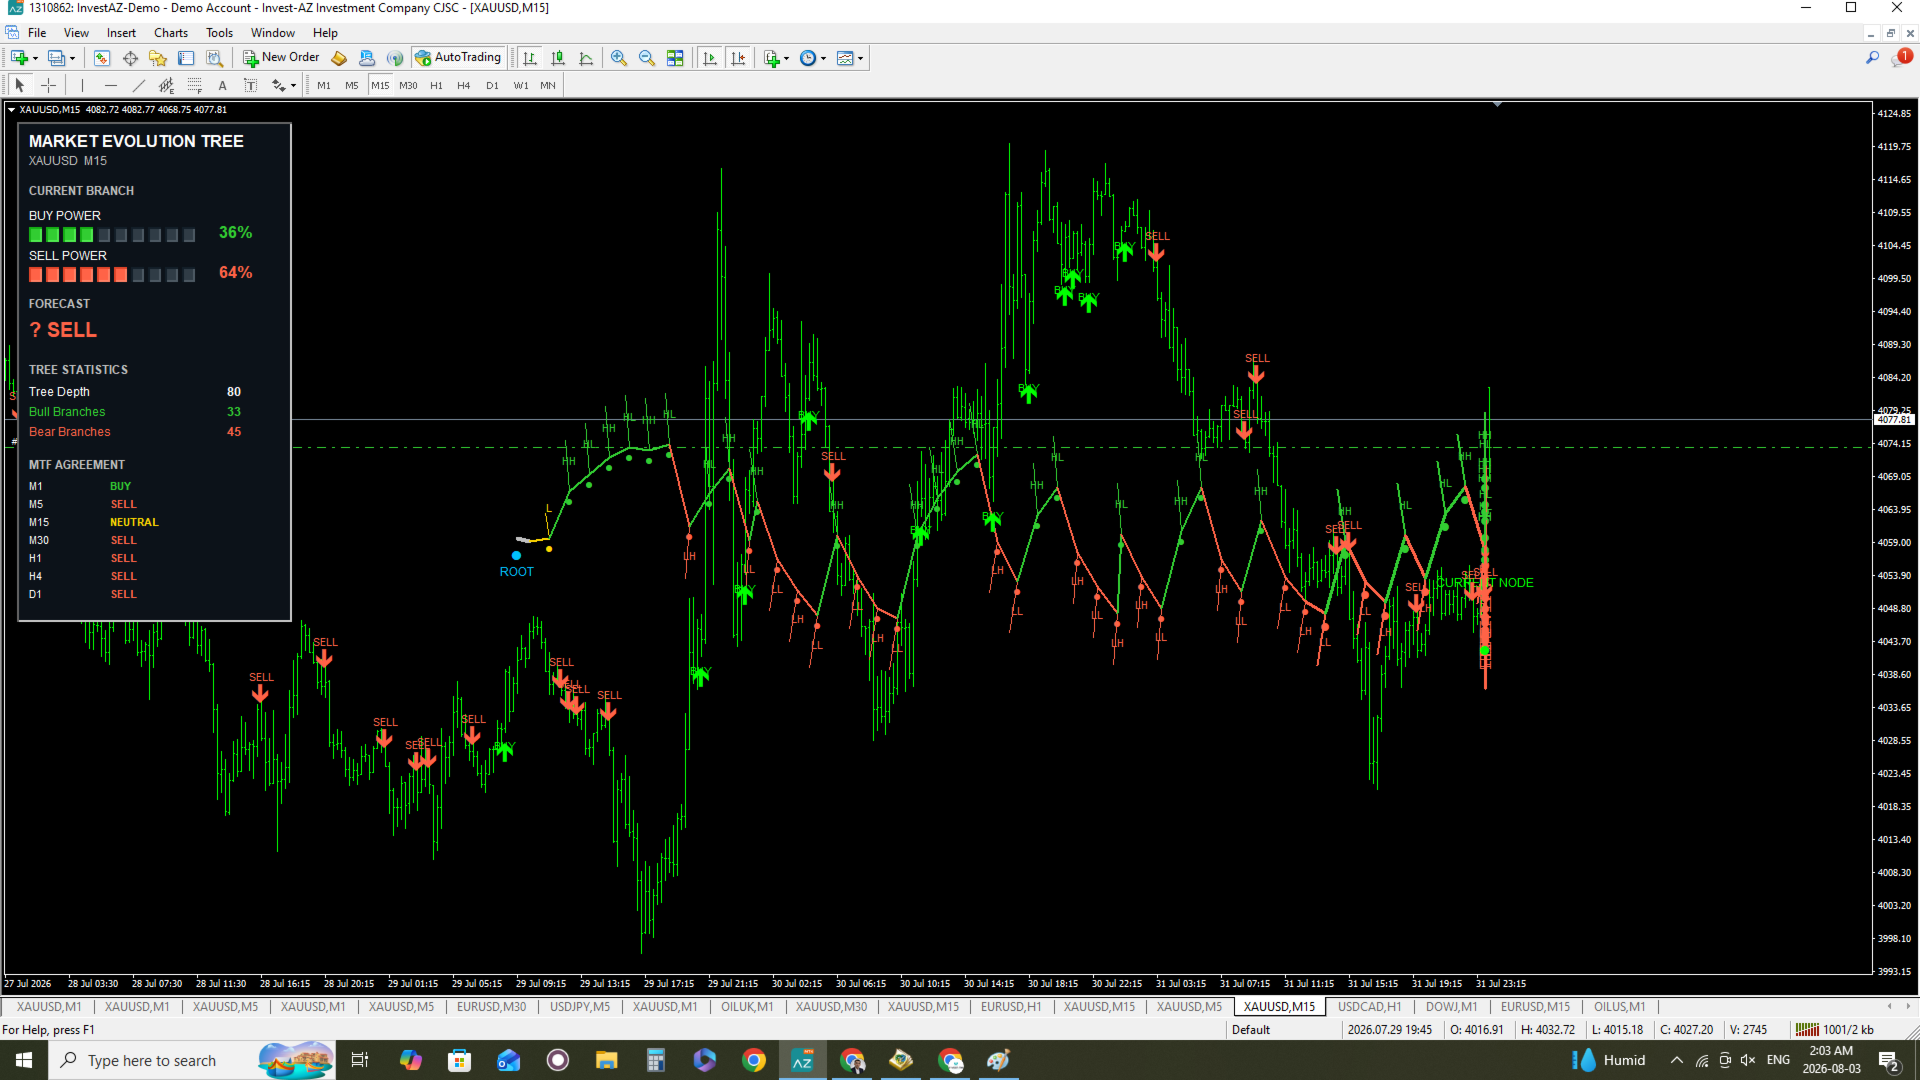
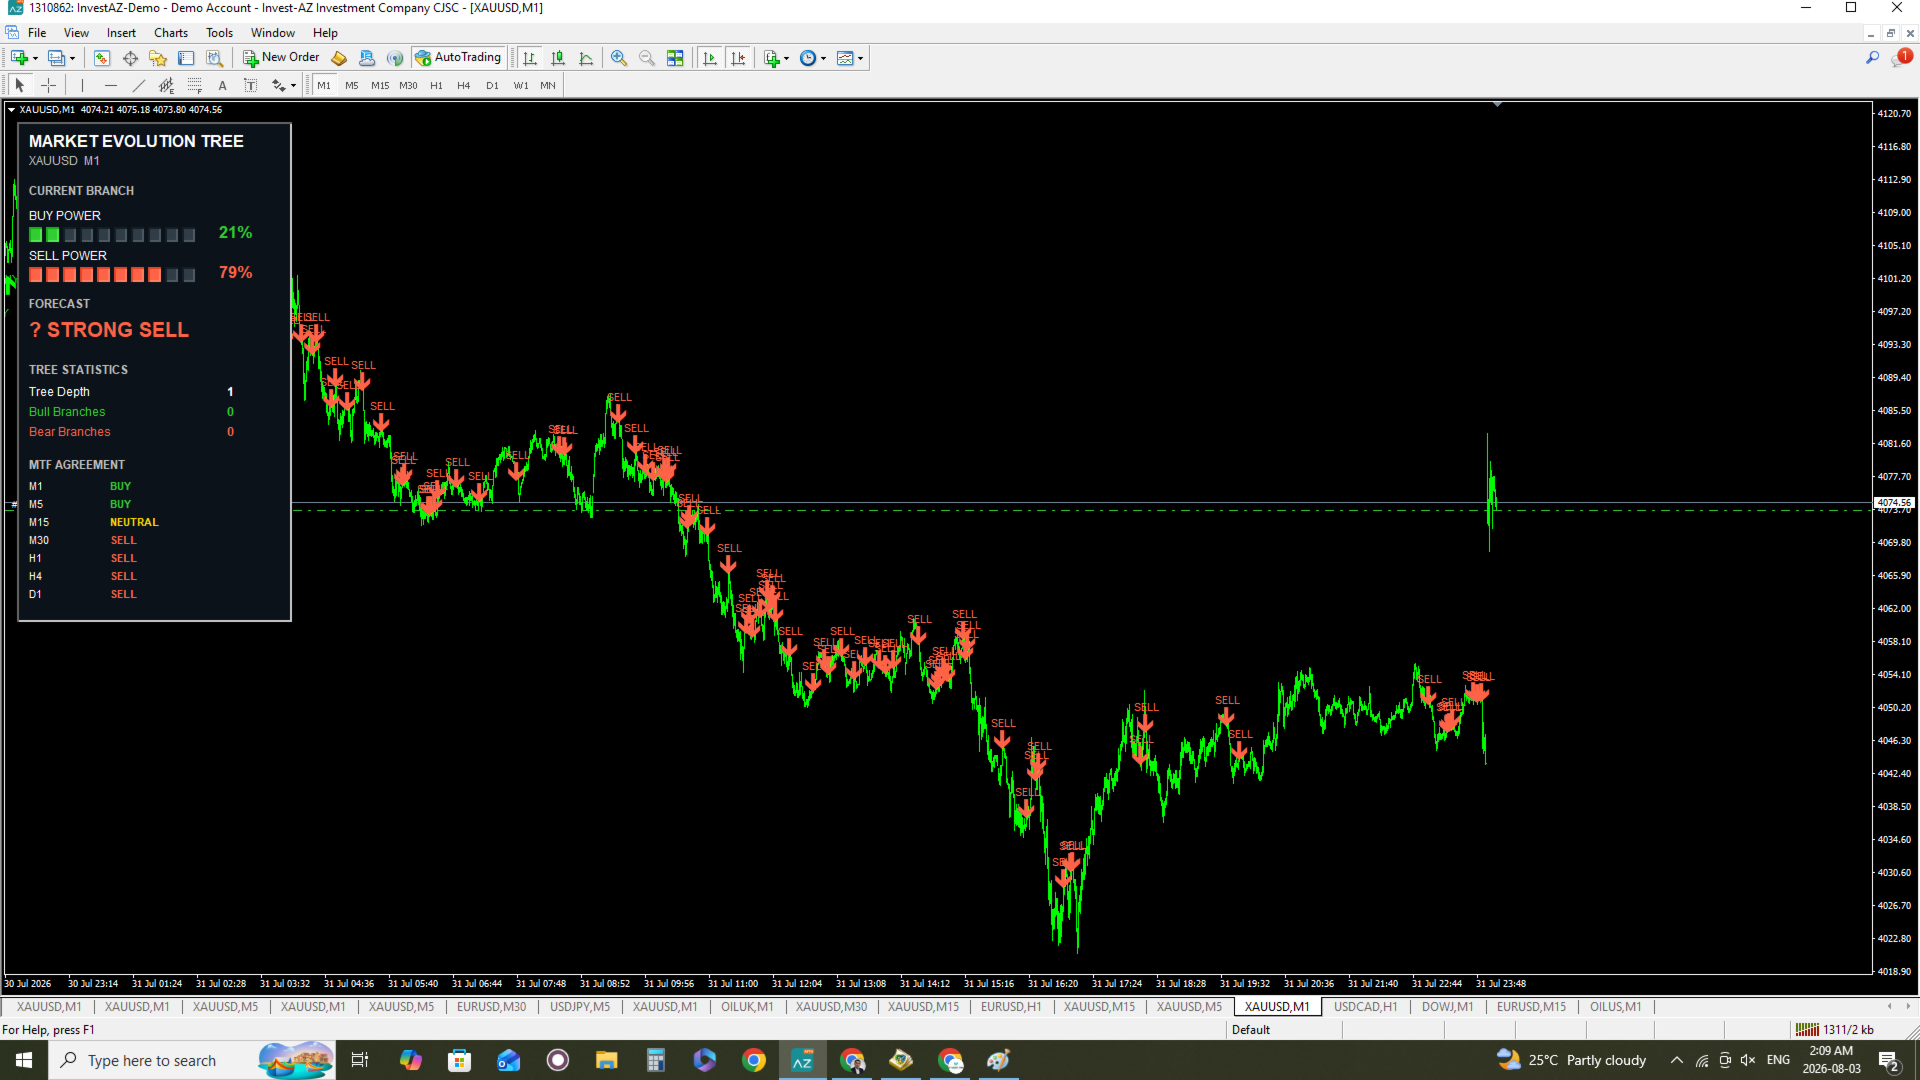
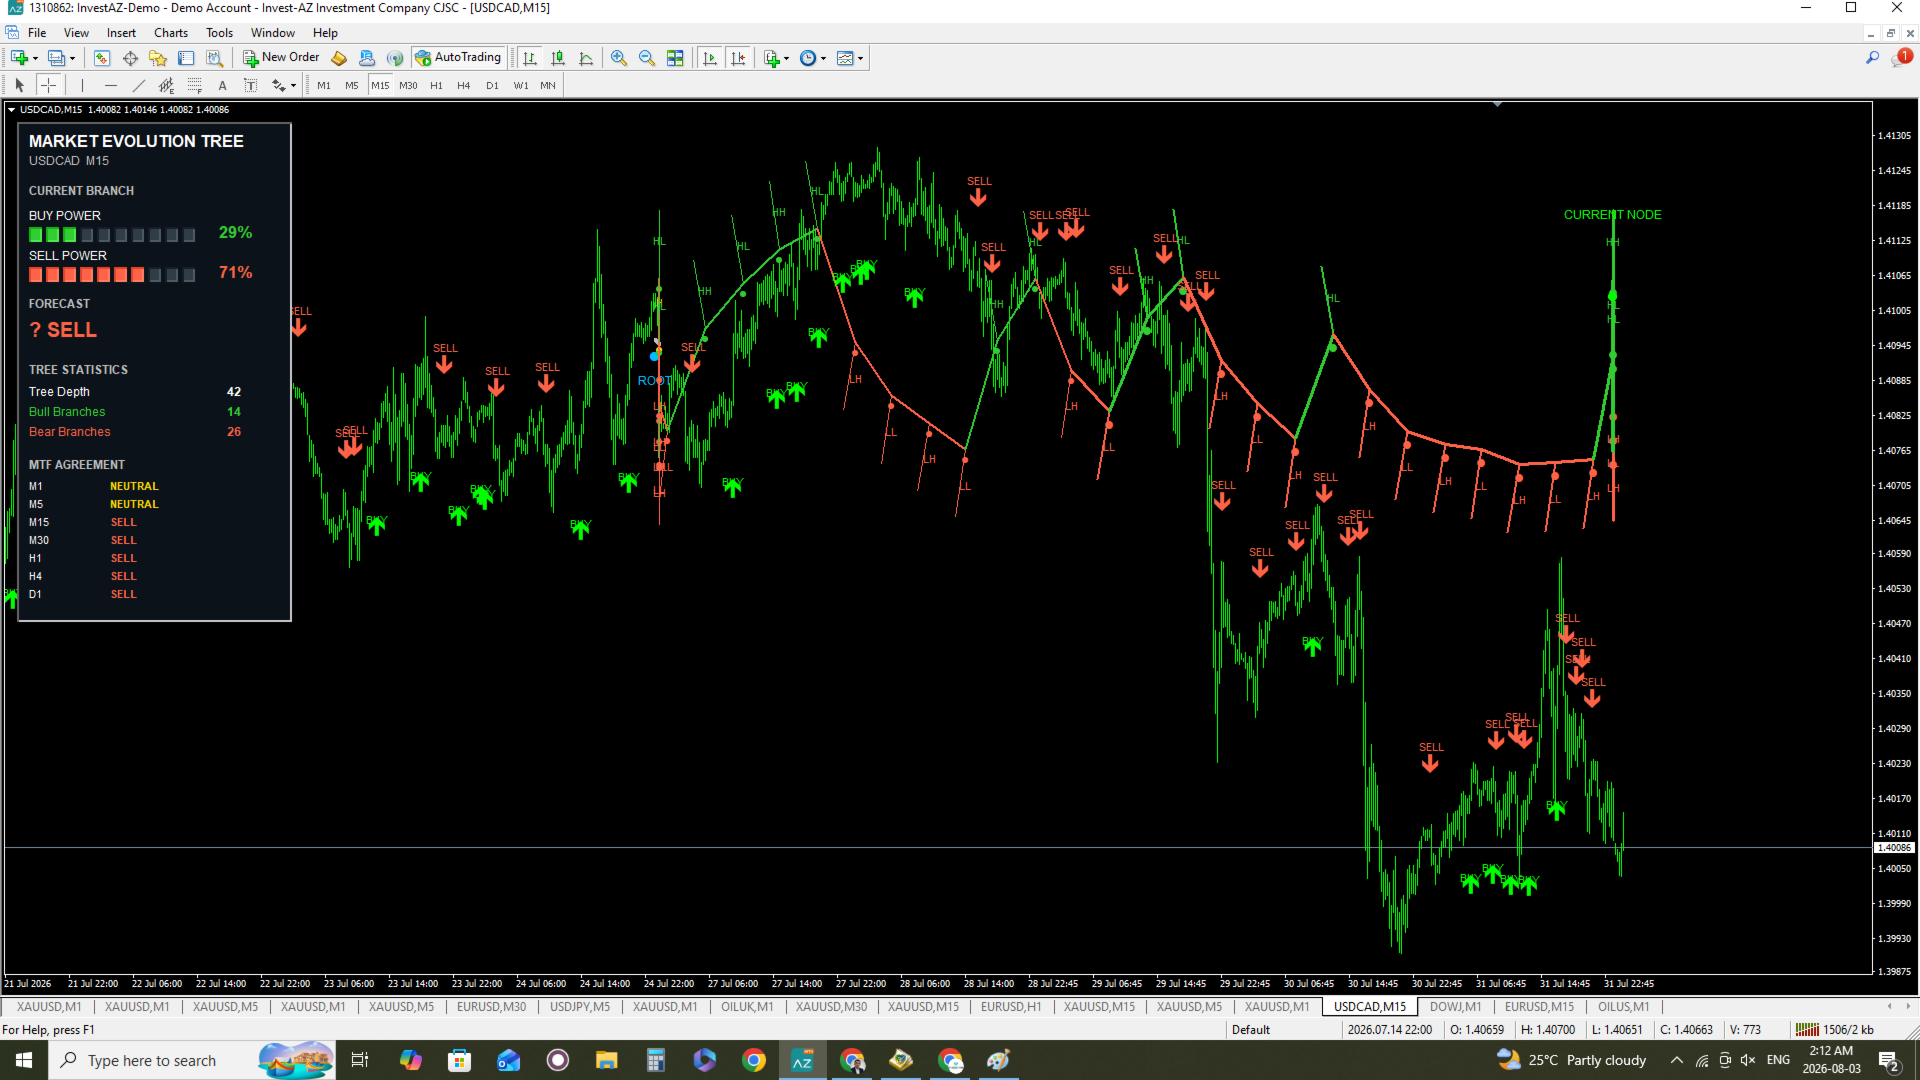
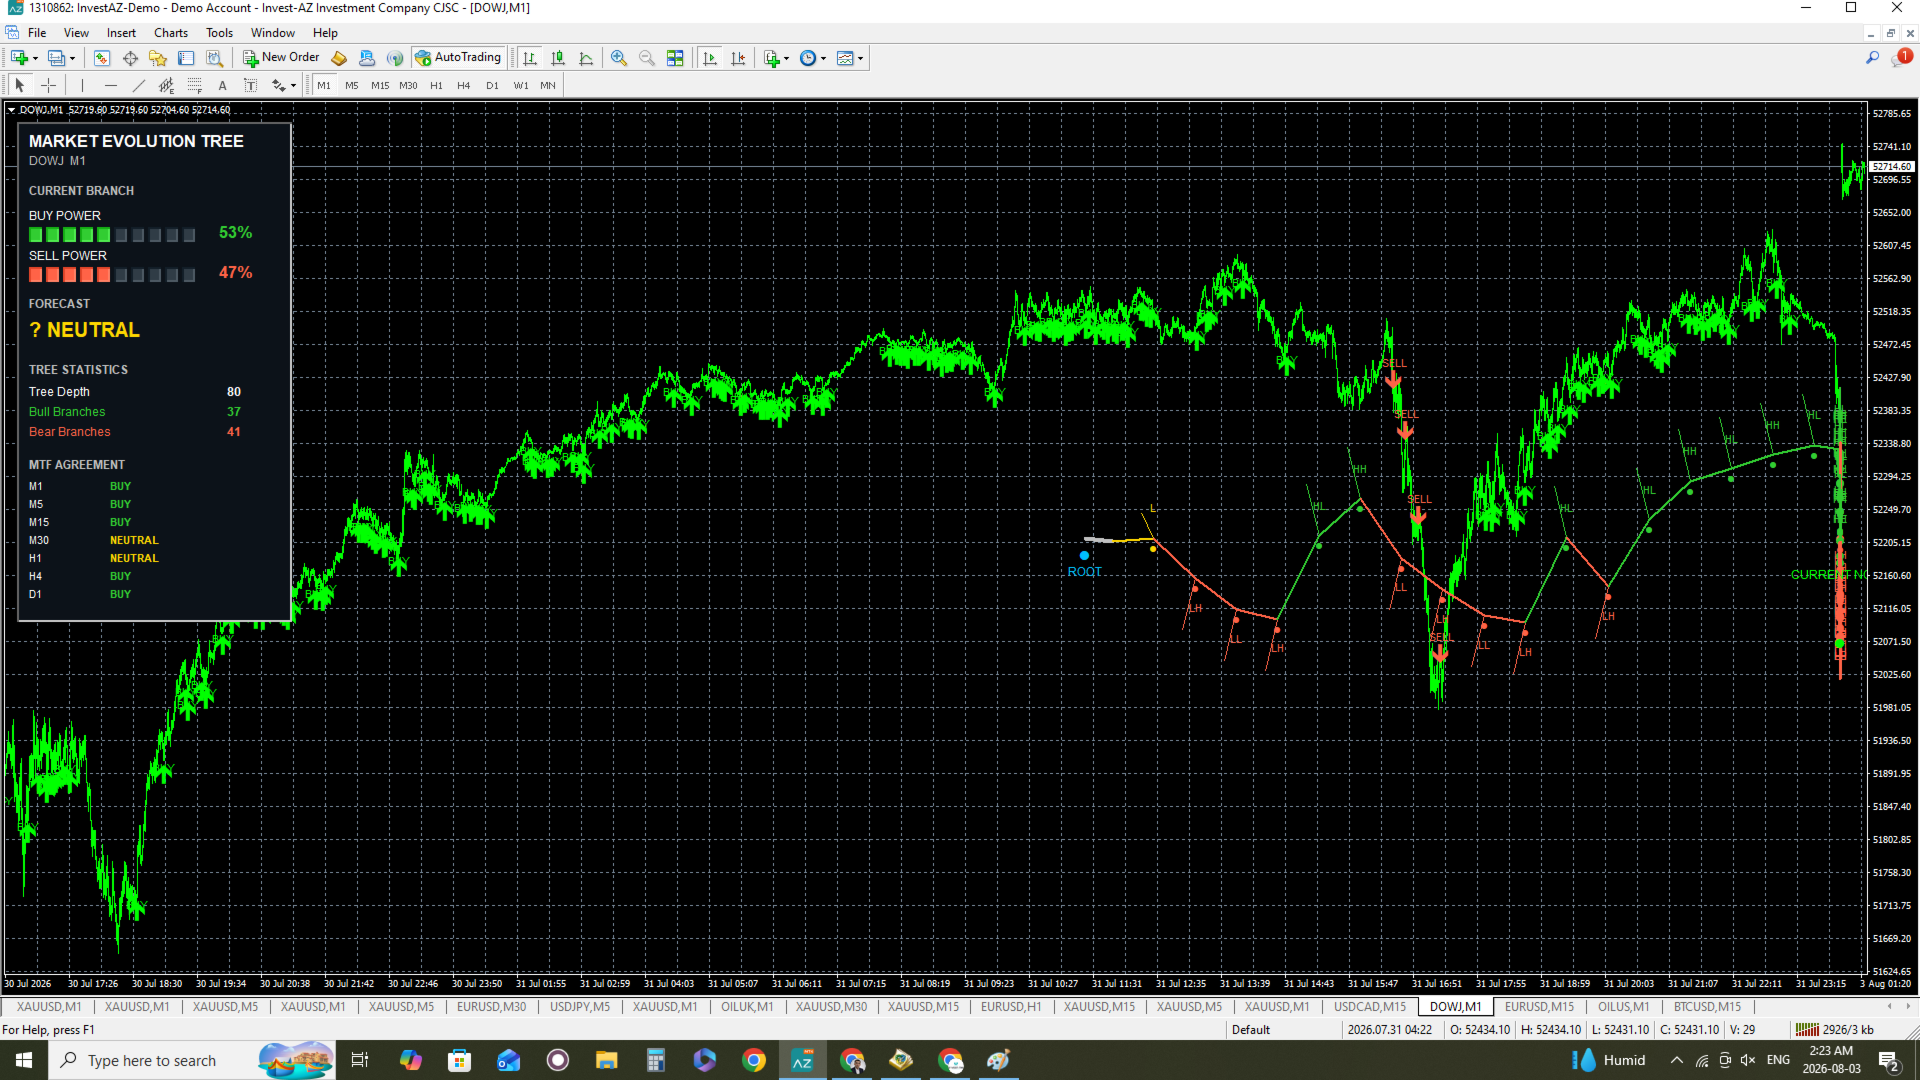
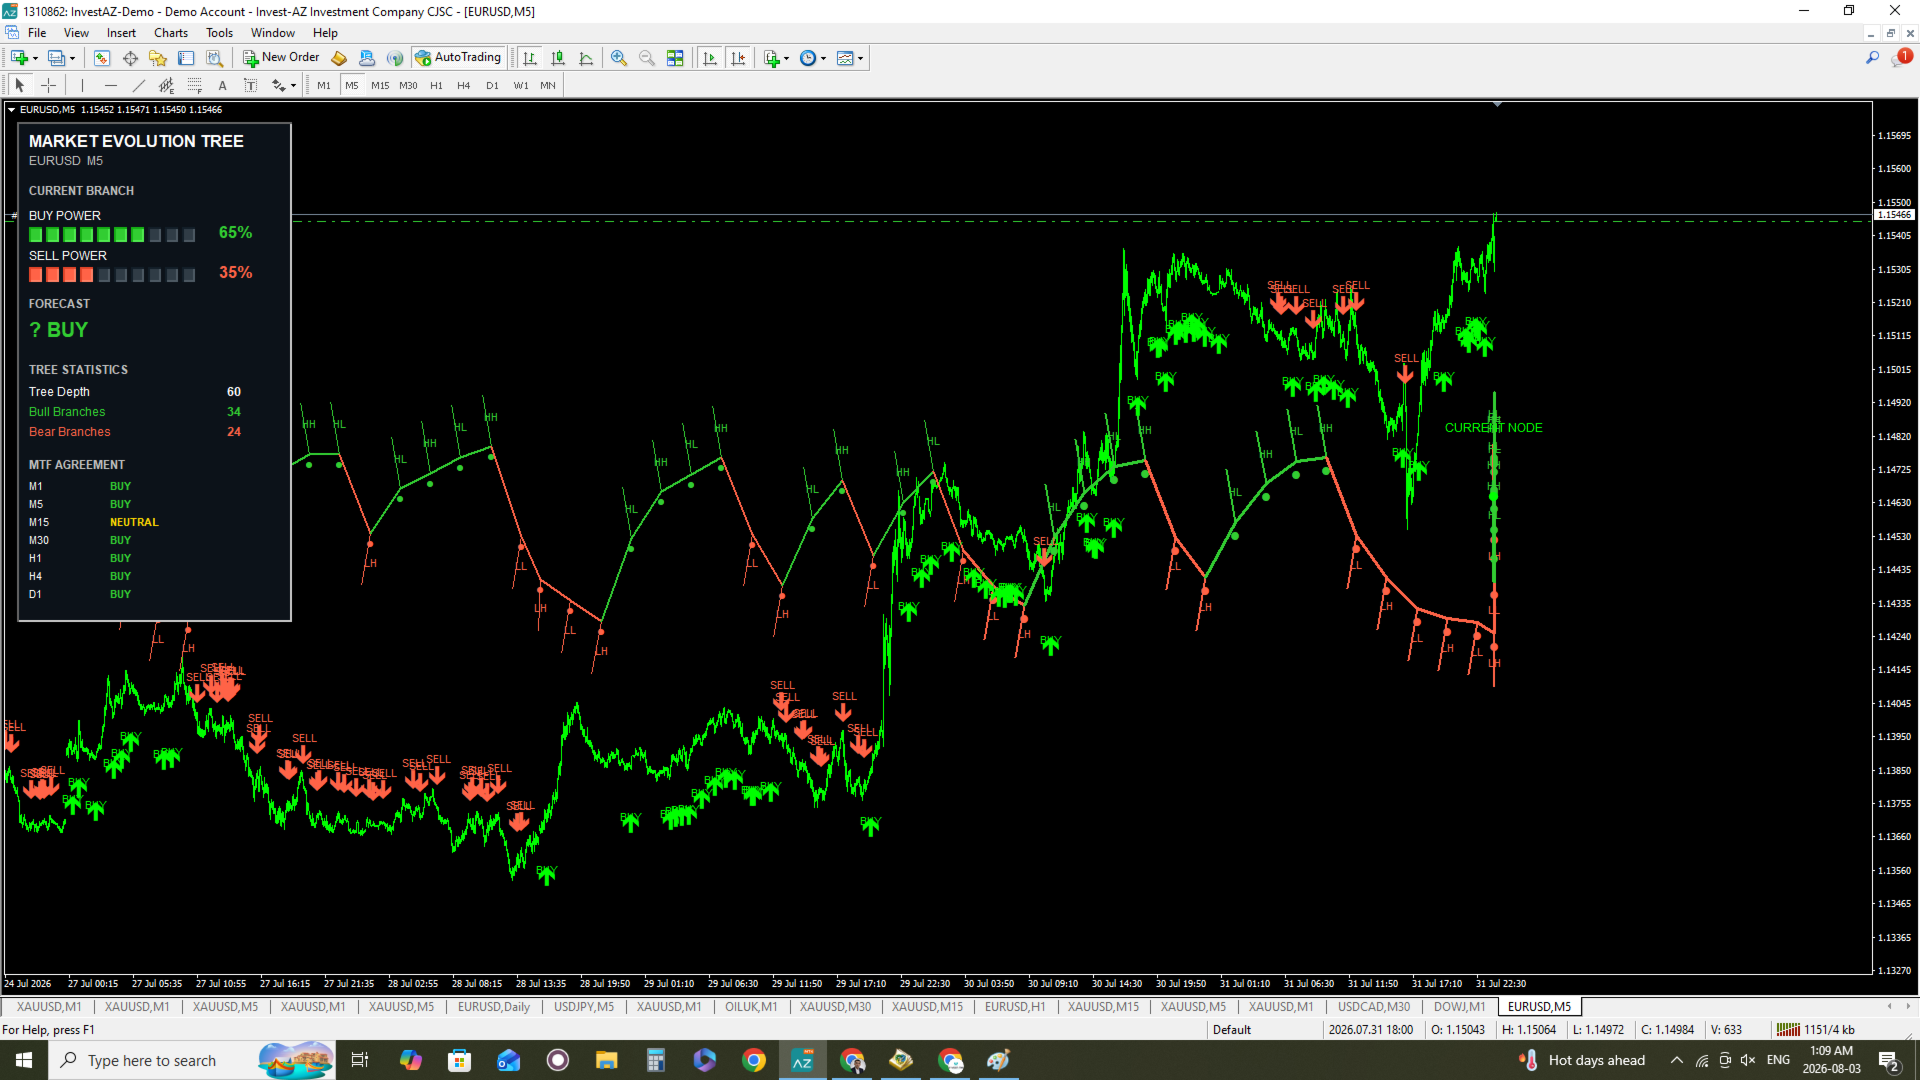
Market Evolution Tree is a non-repainting market structure indicator that transforms price action into an intelligent decision tree. Instead of generating random signals, it analyzes swing evolution, momentum, trend strength and multi-timeframe confirmation to identify high-probability BUY and SELL opportunities. The clean visual tree and built-in dashboard help traders understand market direction at a glance.

Features

  • Non-Repainting Signals
  • BUY / SELL / EXIT Alerts
  • Market Structure Tree
  • Buy & Sell Power
  • Multi-Timeframe Analysis
  • Trend & Momentum Filter
  • Professional Dashboard
  • Fast & Lightweight

Recommended For

  • Scalping
  • M1
  • M5

Compatible With

  • Forex
  • Gold (XAUUSD)
  • Indices
  • Cryptocurrency
  • CFDs

Trade Warning

Trading Forex, CFDs, cryptocurrencies, commodities and other leveraged financial instruments involves substantial risk and may not be suitable for all investors. Past performance does not guarantee future results. This indicator is designed as a decision-support tool and should not be considered financial or investment advice.

Always use proper risk management, including stop loss, position sizing and money management techniques. The developer is not responsible for any trading losses resulting from the use of this product.

Installation

  1. Copy the indicator into your MT4 / Indicators folder.
  2. Restart MetaTrader 4 or refresh the Navigator.
  3. Attach Market Evolution Tree to any chart.
  4. Adjust the input parameters according to your trading style.

Recommended for Scalping (M1 & M5).

Ask me for scalping setting please.

Support

Developer: Qiyas Baghirov

If you have any questions, need installation assistance, or would like to suggest new features, please send me a Direct Message (DM) through the MQL5 website.

You can also post your questions in the Comments section of the product page, where I will be happy to assist you and answer as soon as possible.

Thank you for choosing Market Evolution Tree. I appreciate your support and feedback.

推荐产品
Crypto_Forex MT4 版“锤子线和倒锤子线形态”指标,无需重绘,无延迟。 适用于上涨行情! ................................................................................. - “锤子线和倒锤子线形态”指标是价格行为交易的强大指标。 - 指标可检测图表上的看涨锤子线和倒锤子线形态: - 看涨倒锤子线 - 图表上显示蓝色箭头信号(见图)。 - 看涨锤子线 - 图表上显示绿色箭头信号(见图)。 - 支持 PC、手机和电子邮件提醒。 - “锤子线和倒锤子线形态”指标非常适合与支撑/阻力位结合使用。 ................................................ 点击这里查看高质量的交易机器人和指标! 这是仅在 MQL5 网站上提供的原创产品。
介绍 Moving Average Multicurrency Scanner MT4,这是一款前沿指标,旨在通过监控多个货币对在不同时间框架上的表现来增强您的交易体验。此工具非常适合依赖移动平均线来识别趋势并做出明智交易决策的交易者。 使用 Moving Average Multicurrency Scanner MT4,您可以轻松分析市场动态并及时接收信号,使您能够实时把握交易机会。想象一下,您可以通过无缝对齐多个时间框架和货币对来自定义您的交易策略。 MQL产品安装指南 | 在 MT4/MT5 上更新已购买的MQL产品 | 常见故障排除指南 | 指标设置 / 指南 主要特点 缓冲区集成:将指标值暴露为可访问的缓冲区,使 Expert Advisor 能够利用基于信号的交易策略。 视觉箭头信号:在信号蜡烛上直接在图表上显示清晰的买入/卖出箭头,便于视觉阅读。 快速且可回测:基于 MetaTrader 的本机 OnCalculate() 引擎构建,确保快速计算并与策略测试器兼容,以进行历史回测。 弹出警报:在信号事件上生成 MetaTrader 弹出警报,确保您不会错过潜在的交易设置
DeMarker Speed mf
DMITRII GRIDASOV
适用于 MT4 的 Crypto_Forex 指标 “DeMarker Speed” ,无需重绘。 - 该指标基于物理方程计算。DeMarker Speed 是 DeMarker 本身的一阶导数。 - DeMarker 振荡曲线指示当前价格相对于指标计算期间先前高点和低点的位置。 - DeMarker Speed 指标非常适合快速剥头皮入场(如图所示)。 - DeMarker Speed 指标显示 DeMarker 本身改变方向的速度——它非常敏感。 - 如果 DeMarker Speed 指标的值小于 0:速度为负值;如果 DeMarker Speed 指标的值大于 0:速度为正值。 - 指标内置移动端和 PC 端警报。 Click here to see high quality Trading Robots and Indicators! 这是仅在 MQL5 网站上提供的原创产品。
Quantum Trend Scanner (Non-Repaint) Stop hunting the market. Let the market come to YOU. Quantum Trend Scanner NonRepaint is the precision tool every serious trader has been waiting for. While most indicators repaint their signals and leave you second-guessing every trade, QTS locks every signal the moment a candle closes — and never moves it again. Sniper-precision entry signals. A red arrow appears at the top of a rally when the market is ready to reverse down. A green arrow appears at the bot
Crypto_Forex 指标“上吊线和倒锤线形态”适用于 MT4。 - 指标“上吊线和倒锤线形态”是价格行为交易的非常强大的指标:无需重绘,无延迟。 - 指标可检测图表上的看涨倒锤线和看跌上吊线形态: - 看涨倒锤线 - 图表上的蓝色箭头信号(见图片)。 - 看跌上吊线 - 图表上的红色箭头信号(见图片)。 - 带有 PC、手机和电子邮件提醒。 - 指标“上吊线和倒锤线形态”非常适合与支撑/阻力位和挂单结合使用。 ............................................................................. Click here to see high quality Trading Robots and Indicators! 这是仅在此 MQL5 网站上提供的原创产品。
A top-quality from the famous XSuper Trend indicator. It is completely loyal to the original algorithm, and implements many useful features Which includes Trend Indicators as Filters like MACD,CCI and Alligator. The Chefs Super Trend Plus Indicator is a great way to identify the current market trend. The indicator shows a clear distinction between uptrends and downtrends. The indicators has optional filters for sound signal. Suitable for the following trending pairs: EUR/USD, GBP/USD, USD/JPY,
ADX arrow N
Pavel Shutovskiy
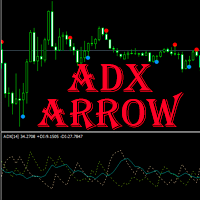
ADX arrow 该指标将 ADX indicator (平均方向移动指数)的信号显示为图表上的点。 这便于信号的视觉识别。 该指示器还具有警报(弹出消息框)和向电子邮件发送信号。          参数 Period   -平均周期。 Apply to -用于计算的价格:关闭,开放,高,低,中位数(高+低)/2,典型(高+低+关闭)/3,加权关闭(高+低+关闭+关闭)/4。 Alert   -启用/禁用警报。 EMail   -启用/禁用向电子邮件发送信号。 Push -启用/禁用发送信号推送 Period  - averaging period. Apply to  - price used for calculations: Close, Open, High, Low, Median (high+low)/2, Typical (high+low+close)/3, Weighted Close (high+low+close+close)/4. Alert  - enable/disable alerts. EMail  - enable/disable sen
G99 Gravity
Ahmed Mohamed
G99 GRAVITY G99 Gravity is a channel indicator for the MetaTrader 4 terminal. This indicator allows finding the most probable trend reversal points. Unlike most channel indicators, G99 Gravity does not redraw. Attach the indicator to a chart, and the alert will trigger once a signal emerges. With our alerting system, you will never miss a single position opening signal! Advantages of the indicator Perfect for scalping. Excellent for identifying trend reversals. Suitable for beginners and exper
ADX MA: The Ultimate Trend Strength Guide In forex trading, the Average Directional Index (ADX) is a vital indicator for gauging trend strength. Here's a streamlined approach to using ADX for effective trading: 1. Add ADX to your forex chart. 2. Interpret ADX values: <20 is weak, >40 is strong. 3. Identify trend direction: +DI above -DI indicates an upward trend, and vice versa. 4. Execute trades based on ADX and trend: Strong up trend, consider buying; strong down trend, consider selling; we
First Dawn
Innovicient Limited
The First Dawn indicator uses a unique mechanism to search and plot signals. This keeps searching for signals, making it a great indicator for scaping and identification of changes in direction, swing trading and trend trading. The  First Dawn   helps you get early signals. The backtest gives the true picture of how the indicator works with real/demo accounts. Although this is a tiny indicator it is packed with advantageous settings that will help you whether you desire to: Snap the Peaks and
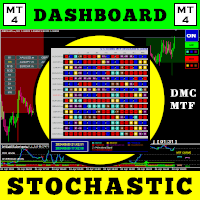
使用此交易工具,您可以同时扫描 15 个市场。 介绍新的交易指标 2024: ️ 仪表板多货币多时间框架随机。 我创建这个交易工具至少有两个原因: 首先,我厌倦了只观察一个市场。 其次,我不想失去进入另一个市场的时机。 这就是为什么我想同时了解其他市场状况。 因此,我需要一台可以同时扫描多个市场状况的扫描仪。 我经常寻找随机主线>(或<=)随机信号线从M1到H4(或只是M1到M30)的市场。 如果您同意我的分析,那么这就是您一直在寻找的交易指标。 不要错过市场状况满足上述要求的时刻。 这是一个随机扫描仪或仪表板,具有许多出色的功能: 可显示随机主线数据 可显示随机信号线数据 可以显示随机主线和信号线的位置(信号线上方主线或信号线下方主线) 可以显示随机主线和信号线的数据水平(看涨、看跌、趋势向上、趋势向下、超买但仍向上、超卖但仍向下) 可显示从M1到MN1的实时数据 可显示15种货币对的数据(多币种外汇/商品/加密货币/股票) 可定制参数 可定制颜色 OBOS 级别 漂亮的20仪表板配色方案 配备开/关货币对转换器 配备蜡烛高时间框架 配备时间点差利润信息 配
SFO Trend Racer
Tevin Marshall
5 (1)
SFO Trend Racer system is a trend indicator created by the CEO and Founder of " Simple Forex Options ", Tevin Marshall . It serves 6 different functions all in one. It shows the trader the entry signals as well as exit signals, whether it is a take profit or a stop loss. It also uses trend filters and signal confirmations so that the trader is able to make the most logically fit decision. Trend Racer uses various filters and specific settings from a plethora of indicators. The beauty in this ind
DeMarker (DeM) indicator is another member of the Oscillator family of technical indicators. Traders use the index to determine overbought and oversold conditions, assess risk levels, and time when price exhaustion is imminent. This indicator shows DeMarker data from 9 currency pairs of your choice for all 9 timeframes. If a digital value of DeM is less or equal to DnLevel = 0.3 (or whatever number you decided to put), Green square appears. This is potentially an oversold condition and may be a
Swing or Scalp
Jermaine Wedderburn
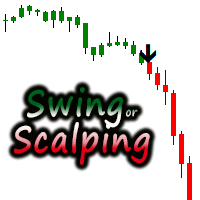
Coloured price charts, generating black arrows.  User can change the colours of the arrows in the colour section of the indicator.  It is consider a great scalping tool on lower time-frames, while higher time frames will have fewer opportunities but trades will possibly last longer.  There is an input for Alert on or off.  This can be used effectively on M15/M30 Chart until up to H4 chart time.  It is best if the user has some experience with money management, utilising trailing stop to protect
With the Technical Analysis indicator, you can find the trading signals using the combination of different technical indicators. It supports the following technical indicators: 1.     RSI 2.     Stochastic 3.     Stochastic RSI 4.     MACD 5.     ADX 6.     CCI 7.     ATR 8.     Ultimate Oscillator 9.     ROC 10.   Bull/Bear Power After you attached the indicator to a chart it will show the following information on the chart: 1.     Technical indicators, their values and the signal generated fro
Guru Pro Signal
Sergey Zhuravkov
Monitoring of real trading on this system   https://www.mql5.com/ru/signals/632726 Guru Pro Signal does not repaint!  Guru Pro Signal is an original indicator, developed for the work of employees of one of the large funds! It is the best tool that can be added to your chart!  Guru Pro Signal signals about price reversal with the highest degree of accuracy, the best tool for both scalping and position trading. The entry signal is shown by the BUY and SELL arrows. It is possible to receive notif
Inside Bars
Paul Geirnaerdt
The Inside Bars indicator shows Inside Bars, the Breakout Zone and Breakouts thereof. Inside Bars are an important price action pattern. The price action of an Inside Bar is completely covered by the price action of the previous bar. Inside Bars are most often used on higher timeframes. Settings Inside Bars default settings are good enough most of the time. Feel free to fine tune them to your needs. ATR factor to skip large candles - very large candles should be filtered as they often cover othe
MTF Trend
Sergey Ermolov
MTF Trend —— 基于3个时间周期的简洁趋势方向指标。 打开图表后,您可能无法确定不同时间周期的市场方向是否一致。 MTF Trend 会立即给出答案——3个箭头、3个时间周期、一个结论:您现在是在顺势交易,还是在逆势交易。 一眼看清趋势方向 图表上会显示一个紧凑的监控面板。每个箭头代表对应时间周期的趋势方向。 趋势方向基于市场结构进行判断: HH + HL → 上升趋势 LH + LL → 下降趋势 该指标通过分析价格高点和低点的变化结构来判断当前市场方向。 只需看一眼面板,您就能立即知道: 不同时间周期的市场方向是否一致; 现在是否适合入场,还是应该继续等待; 如果高周期显示不同方向,是否应该暂时观望。 避免逆着高周期趋势交易 交易者最常见的错误之一,就是逆着高周期趋势入场。MTF Trend 可以帮助您在开仓前快速发现这类情况。 您将获得一个 简单直观的趋势过滤器 : 如果箭头方向一致 → 市场方向一致; 如果箭头方向不一致 → 入场风险增加。 无需频繁切换时间周期,所有重要信息都会集中显示在一个紧凑的面板中。 最少设置,最大价值 该指标没有复杂繁琐的参数,也无需长
FREE
IconTrade
Vadim Gorodetskii
Place the indicator on the chart, preferably with a timeframe of H1 or H4. If you are trading in the daily range or, conversely, on lower timeframes, you will need to adjust the RSI and ATR levels accordingly.  The blue arrows of the indicator will be a signal to open a long position, the red arrows will be a signal to open a short position: 1) Blue arrow for longs (growth) and red arrow for shorts (decline). 2) Two horizontal lines for current positions (one for entry and one for stop).  3
Catchs
Yvan Musatov
The Catchs indicator analyzes the price behavior and if there is a temporary weakness in the trend, you can see this from the indicator readings, as in the case of a pronounced trend change. The advantage of working with the Catchs signal indicator is that the trader does not need to conduct technical analysis of the chart on his own. The tool generates ready-made signals in the form of directional arrows. It is not difficult to enter the market, but it is much more difficult to stay in it. Wit
动态振荡器 - 是一种高级自定义 Crypto_Forex 指标 - 适用于 MT4 的高效交易工具! .................................................................................................... - 新一代振荡器 - 查看图片以了解如何使用它。 - 动态振荡器具有自适应超卖/超买区域。 - 振荡器是一种辅助工具,用于从超卖/超买区域找到准确的切入点。 - 超卖值:低于绿线;超买值:高于红线。 - 它比标准振荡器准确得多。 - 具有 PC 和移动警报。 点击这里查看高质量的交易机器人和指标! 它是仅在此 MQL5 网站上提供的原创产品。 ..................................................
Multi Andrew PitchFork
Kourosh Hossein Davallou
5 (1)
ANDREW’S PITCHFORK TRADING STRATEGY       Essentially, Andrew’s Pitchfork is a tool for drawing price channels. While two lines surrounding price are usually enough to draw a channel, the Pitchfork has an extra line. It is the median line or the handle of the Pitchfork.     The median line is central to this trading method. This is why Andrew’s Pitchfork is also known as the Median Line Method. TRADING RULES      There are many ways to trade using Andrew’s Pitchfork but the basic idea is that pr


Trend Scanner looks at the Market watchlist and Checks to see if there are trending cases between three (3) timeframes selected by the user. The analysis can assist in finding pairs to focus on for a particular session where a trader may need to have a bias in terms of direction to place trades for a particular system which requires multiple timeframe filtration of bar momentum. 3 Main indicators are involved: Moving Average, MACD and Heiken Ashi. User is able to select timeframes available on
Trend Lines continuous
Mohamed yehia Osman
Trend Lines contiuous Signal (FREE one WEEK)  This indicator draws current trend line and  provides Buy/Sell Signal based on calculations on Higher frame (Trend) and Lower frame(Entry signals) * You should select the higher and lower frame for indicator calculations * You select the Trend line colors as you prefer * Enable or disable Alerts! Trend lines UP/Down are drawn when a trend is detected Wait for small arrows for entry : *Normally an UP arrow in an UP Trend is a BUY signal : ---you Clos
How to find out where to expect a price reversal with a probability of 80% - 90%? The "Statistics of Price Movements" indicator collects statistics of significant price movements, skipping all small pullbacks, for a certain period of time and displays them in Excel file. Sort the data in ascending order and get statistics of price reversals in 80%, 85%, 90%, 95% of all cases! (for example, in 2 years!) After the reversal, the price will move from 1000 pips or more! So... Open the daily cha
Crypto_Forex 指标“CCI 带动态超卖/超买区域”,适用于 MT4,无需重绘。 - 商品通道指数 (CCI) 非常适合顺势交易,顺势而为。 - 非常适合在动态超买区域设置卖出入场点,并在动态超卖区域设置买入入场点,顺势而为。 - 此指标也非常适合与价格行动入场点结合使用。 - 动态超买区域 - 黄线上方。 - 动态超卖区域 - 蓝线下方。 - CCI 震荡指标用于测量当前价格与历史平均价格之间的差额。 - 提供 PC 和移动端提醒。 ............................................................................. Click here to see high quality Trading Robots and Indicators! 本产品为原创产品,仅在 MQL5 网站上提供。
separate indicator window for Currencies Strength smooth lines for up to 20 symbols based on (5) time frames  &&& MAIN Window Power TABLE for up to 20 Symbols for (5) timeframes and the Total calculated Symbols strength for each 1- Currencies Strength  - It draws smooth lines for up to 20 currencies pairs representing Volatility  strength and power calculated by 5 selected time frames not only ***Works on any Time frame  but i recommend from M15 M30 H1 .... (lowest frames need higher index of
MTF Qristalium箭头指标是一个半自动的现成交易系统。 它适用于所有货币对。  该指标使用三条规则:1)我们只交易趋势,2)"当每个人都卖出卖出,当每个人都买入卖出",3)价格总是违背人群。  MTF Qristalium箭头指标使用内置指标在多个时间周期上过滤这些规则。 如果趋势与所选时间间隔匹配,则指标将显示一个进入市场的箭头。 然后你自己做决定。 买-绿箭,卖-红箭头。 在指标中,您可以更改批次,设置EA的交易时间和关闭时间。 您还可以更改工作时间段和时间筛选器。 有一个蜂鸣声。  建议的工作周期D1。 滤波器H1和H4。 设置: TF-工作期间(建议D1) CCI_Period CCI LeveiUp CCI等级 CCI价格 SAR步骤 SAR最大值 TF Filter1-(推荐H1) TF FiIter2-(推荐H4) 工作时间 声音使用 最大酒吧 
Over Trend MT4
Mansour Babasafary
Trend based indicator Identify trends with this indicator A simple-to-use trend indicator No complicated settings Attributes: Can be used in all symbols Can be used in all time frames Relatively high signals No complicated settings Specific to the trend Lifetime support Settings: Alarm Show Alert: By activating these settings, after receiving the signal, you will receive an alarm in Metatrader Alarm Show Notification: By activating these settings, after receiving the signal, you will receive a
MultiCurrency Indicators is a multi-currency indicator which calculates the values of multiple standard indicators for each of the 8 major currencies: EUR, GBP, AUD, NZD, USD, CAD, CHF, JPY. Advantages of the indicator Calculation is performed for 8 virtual charts of the currencies: EUR, GBP, AUD, NZD, USD, CAD, CHF, JPY; Show the currency strength, which does not depend on the currency pair; It allows determining the strongest and the weakest currencies at any moment, it also sorts currencies
该产品的买家也购买
Trend SniperX MT4
Sarvarbek Abduvoxobov
5 (5)
Trend Sniper X 是一款用于 MetaTrader 5 的多周期趋势追踪指标,旨在帮助交易者清晰、精准地识别趋势方向及潜在的反转点。 适用于 MT5: https://www.mql5.com/en/market/product/181101 价格信息: 当前价格为促销价,随着后续更新和新功能的推出,价格可能会发生变动。 Code2Profit 频道 通过多周期分析掌控市场! 如何使用 Trend Sniper X 最大化胜率:关键规则与交易时段技巧 技术规格 交易平台 MetaTrader 5 指标类型 多周期趋势指标 运行时间周期 任意图表周期,支持独立选择更高周期(M1–MN1) 主要交易品种 外汇、黄金 (XAUUSD) 及其他 CFD 差价合约 推荐账户 任何账户类型 可视化呈现 彩色趋势 K 线(买入/卖出/弱势/转变)+ 买入/卖出信号箭头 附加模块 市场交易时段框(悉尼、东京、伦敦、纽约) 核心功能 多周期趋势分析: 将更高周期的趋势方向直接投影到当前图表上,提供清晰的宏观视角。 弱势/不确定 K 线检测: 高亮显示趋势状况不明确的 K 线,帮助交易者远离震
Scalper Vault
Oleg Rodin
5 (40)
Scalper Vault 是一套功能强大且配置完善的交易系统,专为追求日内交易稳定性的交易者而设计。 作为一套完整且独立的交易系统,该高精度指标能够为外汇和二元期权交易者提供机构级的市场分析。 购买后请联系我,获取我的独家交易技巧以及一份超值赠品! Scalper Vault 能够消除凭感觉交易和复杂的各种手动分析,让您只需专注于执行交易,并运用简单易行的交易技巧进行操作。 精准的顺势交易信号:其核心算法通过分析市场结构,仅在市场主导趋势的方向上提供高胜率信号,从而大幅减少错误的入场操作。 精确的顶部与底部探测:系统能够识别市场动能耗尽的状态,从而锁定潜在的反转区域。 基于江恩(Gann)理论的买卖区域:系统会自动绘制江恩数学市场点位,让您能清晰洞察大型机构交易者在何处寻求买入或卖出。 100% 不会重绘(Non-Repainting):一旦K线收盘,生成的信号便会永久固定在图表上。绝无动态偏移,绝无虚假信号——您在历史数据中所见,即为该指标的真实表现。 广泛的市场适用性:适用于各类货币对、黄金、指数以及加密货币交易。
Zoryk Gold mt4
Reda El Koutbane
5 (3)
折扣将在 24 小时后结束——下一价格为 69 美元 联系我获取推荐设置 首发名额有限 ZORYK — MetaTrader 4 专业 XAUUSD 黄金信号与交易计划系统 你一定经历过这种感觉。 你花时间分析黄金,等待入场,终于打开交易后,价格却立即向相反方向移动。你过早平仓,移动止损,或者因为犹豫几秒而错过机会。随后市场在没有你的情况下,准确到达你最初预期的目标。 问题并不总是方向错误。 真正的问题是不确定性。 你不知道真正的入场位置在哪里,不知道交易逻辑在什么位置失效,也不知道应该先保护较小的利润,还是继续等待更大的行情。你甚至不知道当前信号是否足够强,还是自己只是在勉强寻找一笔交易。 黄金移动速度非常快。没有明确计划的正确判断,也可能在几秒钟内变成错误决定。 ZORYK 正是为了解决这个问题而开发。 什么是 ZORYK ZORYK 是一套专门为 MetaTrader 4 和 XAUUSD M5 周期开发的完整黄金信号与交易计划系统。 它不是一个只显示 BUY 或 SELL 箭头,然后让你独自处理所有后续决定的普通指标。 每个确认信号都可以在图表上显示
Atomic Analyst
Issam Kassas
5 (14)
Atomic Analyst — MetaTrader 4 如有产品、设置或技术支持方面的问题,请直接在 MQL5 上给我发消息。 该指标将复杂的市场计算转换为简单的视觉信号、彩色K线、趋势读数、止损水平和多个止盈区域,使交易者能够快速理解并应用于真实市场环境。 主要交易用途: 剥头皮和日内交易: 专为快速决策、清晰箭头、提醒、K线颜色和结构化进出场区域而设计。 日内交易和波段交易: 帮助交易者利用趋势方向、强度、动能和多周期分析跟随更大的市场波动。 主要功能: • 价格行为、强度和动能分析 • 多周期趋势扫描器 • 总体趋势百分比计算 • 买入和卖出箭头 • 止损和多个止盈水平 • 最多 5 个基于斐波那契的止盈水平 • 移动止损逻辑 • 用于趋势和动能的彩色K线 • 实时提醒到终端、手机和电子邮件 • 现代化用户友好面板 • 实时交易监控 • 买入和卖出潜力显示 • 总交易数量显示 • 每日、每周和总利润显示 • 每日佣金计算 • Bid、Ask 和点差显示 • K线计时器、本地时间和服务器时间 • 终端连接状态 • 账户货币显示 • 可直接从面板控制时间周期 • 可手动使用,
M1 Sniper
Oleg Rodin
4.97 (30)
M1 SNIPER 是一款易于使用的交易指标系统。它是一个专为 M1 时间框架设计的箭头指标。该指标可以作为独立的系统在 M1 时间框架下进行剥头皮交易,也可以作为您现有交易系统的一部分使用。虽然该交易系统专为 M1 时间框架交易而设计,但它也可以用于其他时间框架。我最初设计此方法是为了交易 XAUUSD 和 BTCUSD。但我发现这种方法在其他市场交易中也同样有用。 指标信号既可以顺势交易,也可以逆势交易。我教授一种特殊的交易技巧,帮助您利用指标信号进行双向交易。该方法基于使用特殊的动态支撑位和阻力位区域。 购买后,您可以立即下载 M1 SNIPER 箭头指标。此外,我还为所有 M1 SNIPER 工具用户免费提供下方屏幕截图所示的 Apollo Dynamic SR 指标!这两个指标的组合可以帮助您更轻松、更准确地利用 M1 时间框架进行交易。 购买后请联系我,免费获取交易提示和奖励指标! 祝您交易成功!
PRO Renko System
Oleg Rodin
5 (31)
PRO Renko Arrow Based System for trading renko charts.  准确的信号交易任何外汇工具. 另外,我将免费提供系统的附加模块! PRO Renko系统是RENKO图表上高度准确的交易系统。该系统是通用的。 该交易系统可应用于各种交易工具。 该系统有效地中和了所谓的市场噪音,打开了获得准确反转信号的通道。 该指标易于使用,只有一个参数负责产生信号。 您可以很容易地使算法适应您感兴趣的交易工具和renko酒吧的大小。 我很乐意通过提供任何咨询支持来帮助所有客户有效地使用该指标。 祝您交易成功!购买后,立即写信给我! 我将与您分享我的建议和我的renko发电机。 另外,我将免费提供系统的附加模块!
Currency Strength Wizard
Oleg Rodin
4.85 (61)
货币强度向导是一个非常强大的指标,为您提供成功交易的一体化解决方案。该指标使用多个时间范围内所有货币的数据来计算这个或那个外汇对的力量。此数据以易于使用的货币指数和货币电力线的形式表示,您可以使用它们来查看这种或那种货币的力量。 您所需要的只是将指标附加到您要交易的图表上,该指标将向您显示您交易的货币的真实强度。该指标还向您显示买卖量压力的极值,您可以在顺势交易时利用这些压力。该指标还显示了基于斐波那契的可能目标。该指标可用于各种交易时间范围。该指标支持各种货币对的交易。 该指标为您提供所有类型的警报,包括推送通知。 购买后请联系我。我将与您分享我的交易技巧,并免费为您提供丰厚的红利指标! 祝您交易愉快,获利丰厚!
Smart Trend Trading System
Issam Kassas
4.8 (10)
Smart Trend Trading System 是适用于 MetaTrader 4 的图表指标,将趋势信息、入场和出场信号以及价格水平集中呈现在同一图表上。 它将 10 多种交易工具 整合到一个系统中,包括趋势检测、反转区域、Smart Cloud、移动止损逻辑、支撑与阻力、K线着色、提醒以及多周期分析。 该系统旨在帮助您应对不同的市场环境: 趋势市场: 识别主要趋势,发现回调,跟随动能,并通过止损指导和移动止损选项寻找更清晰的入场机会。 震荡市场: 识别区间震荡状态,寻找价格反应区域,并在价格触及重要水平时获得更清晰的信号。 剥头皮和日内交易: 使用快速信号、K线颜色、提醒和多周期确认,辅助短线交易决策。 主要功能: • 10 多个指标整合为一个交易系统 • 7 多种策略和信号组合 • 趋势跟随、反转、剥头皮、日内交易和波段交易模式 • 入场和出场箭头 • Smart Cloud • Smart Reversal Zones • 支撑和阻力水平 • Smart Trailing Stop • 多周期趋势分析 • 成交量、趋势和反转K线着色 • 手机、电子邮件和终端提醒 •
Tokyo mt4 Indicator
Vasiliy Strukov
5 (9)
Tokyo Indicator(东京指标)直观地展示了趋势方向、潜在交易信号及市场状况。 其采用颜色编码的阶梯式趋势线,以蓝色标识看涨阶段,以洋红色标识看跌阶段。配套的方向箭头会在趋势发生变化时,标示出潜在的买入与卖出机会。 内置的综合仪表盘将当前信号、市场倾向、动能、波动率及信号质量整合于同一视图中,方便交易者在观察价格走势的同时评估指标数据,无需在不同面板间切换。 凭借清晰的图表显示和简洁的市场概览,Tokyo Indicator 支持以系统化的方式进行趋势分析与交易确认。 适用于任何时间周期及各类交易品种,尤其适合黄金交易。 购买后请立即联系我,以获取专属赠品!您可以免费获得我们的“强力支撑与趋势扫描”(Strong Support and Trend Scanner)指标,请私信我! 设置说明与使用手册请见此处。 请注意:我不会在 Telegram 上出售我的 EA 或特殊参数设置(set files);我的 EA 仅在 Mql5 平台上提供,而参数设置文件仅在我的博客(此处链接)上发布。请务必警惕诈骗,切勿从他人处购买任何参数设置! 设置 ShowHUD —— 在图表上显示
Neuro Poseidon MT4
Daria Rezueva
4.74 (46)
Neuro Poseidon is a new indicator by Daria Rezueva. It combines precise trading signals with adaptive TP/SL levels - creating best possible trades as a result! Message me and get  Neuro Poseidon Assistant  as a gift to automize your trading process! What makes it stand out? 1. Proven profitability on all assets and timeframes 2. Only confirmed BUY and SELL signals present on the chart 3. Adaptive TP & SL levels generated by the software for each trade 4. Easy to understand - suitable for all
Gann Made Easy
Oleg Rodin
4.84 (173)
Gann Made Easy 是一个专业且易于使用的外汇交易系统,它基于使用先生理论的最佳交易原则。 W.D.江恩。该指标提供准确的买入和卖出信号,包括止损和获利水平。您甚至可以使用推送通知在旅途中进行交易。 购买后请联系我,即可免费获得交易指导和超棒的额外指标! 您可能已经多次听说过江恩交易方法。通常 Gann 的理论不仅对于新手交易者而且对于那些已经有一定交易经验的人来说都是非常复杂的东西。这是因为江恩的交易方法在理论上并不那么容易应用。我花了几年时间来完善这些知识,并将最好的原则应用到我的外汇指标中。 该指标非常易于应用。您所需要的只是将其附加到您的图表并遵循简单的交易建议。该指标不断进行市场分析工作并寻找交易机会。当它检测到一个好的入口点时,它会为您提供一个箭头信号。该指标还显示止损和获利水平。 换句话说,当您像先生一样进行交易时,该指标会为您提供最佳江恩建议。江恩亲自告诉你此时此刻该做什么。但最好的部分是您不需要了解任何有关江恩交易原则的知识,因为该指标会为您完成整个市场分析工作。
Liquidity Scalper System
Stanislav Konin
5 (1)
Liquidity Scalper System: 基于流动性的指标形式交易系统。 大多数指标只显示一个箭头,止损放在哪里、目标在哪里、信号是否可信,都要交易者自己判断。Liquidity Scalper System 覆盖完整的交易周期:寻找流动性池,在其被突破时给出信号,立即计算 Entry、Stop Loss 和三个目标,并在面板上显示统计数据以及新数据上的验证结果。系统自行选择设置,并每天更新。 工作原理 1. 系统寻找流动性池:市场参与者止损单聚集的价位。 2. 当价格突破流动性池,且突破经由动能(必要时还经由成交量)确认后,图表上出现 BUY 或 SELL 箭头。 3. 立即绘制 Entry、Stop Loss、TP1、TP2 和 TP3 水平,并填充区域。 4. 右侧构建流动性分布图:可以看到价格上方和下方大成交量集中的位置。 与众不同之处 • 自动优化取代手动调参。 系统在历史数据上测试 32 种设置组合,为当前品种和周期选出最佳组合。优化目标可选:Win Rate、净利润或盈利因子。 • 新数据验证。 设置在一部分历史上训练,并在优化器未见过的更新数据上检验(out
SR Liquidity
Oleg Rodin
5 (2)
SR Liquidity 是一款旨在揭示市场流动性高度集中且价格反应最剧烈的隐蔽区域的交易指标。这些特殊的流动性区域充当着强有力的支撑位与阻力位,为您清晰呈现市场最可能发生反转的位置。 SR Liquidity 指标并非简单地绘制常规的支撑/阻力线,而是通过分析实际的价格行为,识别买卖压力积聚的区域。这些区域实际上是推动市场真实波动的流动性池。通过在图表上直观呈现这些区域,该指标能助您在价格反应发生前预判走势——这意味着它实际上能够预测价格方向可能发生的变化。它将原始的价格行为转化为清晰且具实操价值的市场蓝图,标示出那些可能成为市场转折点的关键价位。 该指标适用于任何交易品种和时间周期——包括外汇、指数、金属、加密货币等。支持任意时间周期。 购买后请联系我,以获取交易指南及免费赠送的优质附加指标!
AW Prime Oscillator
AW Trading Software Limited
5 (1)
两个振荡器的组合。第一个显示入场点,第二个显示当前趋势。该指标可以通过两种模式的箭头显示振荡信号,所有快速振荡信号或仅在当前趋势方向的信号。它具有多时间范围面板和三种类型的信号通知。 好处: 适合当日交易和倒卖交易 趋势过滤 简单而灵敏的设置 多时间框架面板 适合融入顾问。 适用于任何交易品种和任何时间范围 三种类型的通知 MT5 version ->  HERE  / Problem solving ->  HERE 指标策略 该指标由两个不同的振荡器组成: 慢趋势线(粗) - 当指标的最高水平从上到下交叉时,它是下降趋势的指标,当较低的水平水平(指标的低水平)从下到上交叉时,它是下降趋势的指标上升趋势。此外,在较低区域找到一条慢线表明当前趋势是下降趋势,反之亦然,在上方区域找到一条慢线表明当前趋势是上升趋势。这就是该指标确定当前市场趋势的方式。 快速入场线(细):识别从下到上与下线相交处的入场点,这是买入信号,在从上到下穿越上线时,这是卖出信号。除了振荡线之外,调整指标线也很重要,因为这会影响信号的数量和准确性。 本产品使用不同的振荡器来显示慢线和快线,每个振荡器必须单独调整。 为
CRT Candle Range Theory HTF MT4 - Ultimate CRT Indicator: 高级ICT概念与马来西亚SnR交易系统 使用最先进的 Candle Range Theory 指标掌握做市商的足迹。释放 Smart Money Concepts (SMC) 的真正力量,并使用 Ultimate CRT Indicator 像机构一样精确交易。该指标专为严肃的交易者打造,自动化了高效的蜡烛范围理论 (CRT)——ICT概念 (Inner Circle Trader) 的核心支柱,并通过马来西亚支撑与阻力 (SnR) 入场方法和 FVG (不平衡) 区域的致命精度对其进行了强化。 无论您是在 MT4 或 MT5 上交易外汇、加密货币还是指数,该算法都能消除市场噪音,过滤虚假突破,并将高概率、高回报的交易区域直接传送到您的图表上。 CRT Indicator 的核心功能: Absolute Extreme SnR Entry Engine: 与依赖滞后吞没形态的传统指标不同,我们的系统采用了马来西亚 SnR 技术。它在严格的时间窗口内扫描绝对最高的 Buy-
PZ Harmonacci Patterns
PZ TRADING SLU
3.17 (6)
可以说,这是您可以为MetaTrader平台找到的最完整的谐波价格形成自动识别指标。它检测19种不同的模式,像您一样认真对待斐波那契投影,显示潜在的反转区域(PRZ),并找到合适的止损和获利水平。 [ 安装指南 | 更新指南 | 故障排除 | 常见问题 | 所有产品 ] 它检测19种不同的谐波价格形态 它绘制了主要,衍生和互补的斐波那契投影(PRZ) 它评估过去的价格走势并显示每个过去的形态 该指标分析其自身的质量和性能 它显示合适的止损和获利水平 它使用突破来表明合适的交易 它在图表上绘制所有样式比率 它实现了电子邮件/声音/视觉警报 受斯科特·M·卡尼(Scott M. Carney)的书的启发,该指标旨在满足最纯粹和最熟练的交易者的需求。但是,它采取了一种使交易更容易的方式:在向交易发出信号之前,它会等待Donchian朝正确方向突破,从而使交易信号非常可靠。 斐波那契投影与向量无关 它实现了电子邮件/声音/推送警报 它绘制了ABCD投影 重要提示: 为了符合 Scott M. Carney先生 的商标申诉,某些图案名称已重命名为不言自明的替代方式, Scott M.
Top Bottom Tracker MT4
Rodrigo Arana Garcia
Top Bottom Tracker 是一款基于复杂算法的指标,可分析市场趋势并检测趋势的高点和低点 / MT5 版本。 价格将逐步上升,直至达到 500 美元。下一个价格 --> $99 功能特点 无重绘 新数据到来时 该指标不会改变其数值 交易货币对 所有外汇货币对 时间框架 所有时间框架 参数 ==== 指标配置 ==== 配置参数 // 40(值越高,发出的信号越少但越准确) 上水平值 // 80(上水平线的值) 下水平线值 // 20(下水平线值) 指标计算条数 // 3000(您希望指标计算多少条。数值 0 将计算所有条形图的指标) ==== 警报配置 ==== 弹出警报 // true (在终端上发出警报) 电子邮件报警 // true (通过电子邮件报警) 警报时间间隔 // 10 (警报时间间隔,以分钟为单位) 警告 我只在 MQL5.com 上销售我的产品。如果有人联系您向您推销我的产品,那么他们就是骗子,只想要您的钱。 此外,如果您从外部网站购买我的产品,我向您保证,这些产品都是假冒版本,与正版产品效果不同。
Cycles Predictor
Martin Eshleman
Cycles Predictor Indicator This indicator uses past market cycles to predict future price movements. The indicator scans through past data and considers  combinations  of cycles. When cycles  coincide  at the same future date/time then it is considered a valid future prediction. The predictions are drawn as vertical lines on the right side of the chart in the future. A prediction will often result in type of candle (ex. bull or bear) and/or a reversal point (ex. bottom or top) forming at this ex
SIO Oscillator:自优化半方差失衡振荡器 购买指标,即可免费获得基于该指标的智能交易系统(EA)。 大多数振荡器对所有价格波动一视同仁。SIO 将上行压力与下行压力分开,并衡量两者之间的失衡程度,清楚显示究竟是买方还是卖方在真正掌控市场。当失衡达到极值时,SIO 会给出明确的信号,并附带入场价、止损(Stop Loss)和止盈(Take Profit)水平。 SIO 的独特之处在于它不依赖固定参数。内置的自优化器会持续寻找适合当前品种和周期的参数,并在使用之前对其进行验证。 两种信号模式 均值回归(Mean Reversion):在失衡极值处交易,预期价格回归平衡。 趋势跟随(Trend Following):顺着持续、占主导地位的失衡方向交易。 自动模式:由优化器根据近期数据选择表现更好的模式。 具备真实验证的自优化器 滚动前推优化(Walk-forward):参数只用历史数据选出,然后应用于之后的K线。 真正的样本外保留期(Hold-out):结果会在优化器从未训练过的数据上得到确认。 平台图(Plateau map):所有测试参数的可视化热力图。SIO 优先选择结果稳
Break and Retest Hunter MT4 is a powerful MetaTrader 5 indicator designed to automatically identify support and resistance levels, breakout structures, and potential retest opportunities in real time. Bonus Indicator: After purchasing Break and Retest Hunter , contact me to receive Trade Indicator Assistant EA completely free as a bonus utility. $65 for the next 10 copies . Next price is $120.  Combining adaptive market analysis, clear BUY/SELL signals, Fibonacci-based profit targets, and a pre
GoldRush Trend Arrow Signal
Kirk Lee Holloway
5 (2)
GoldRush 趨勢箭頭信號 GoldRush 趨勢箭頭信號 指標為 XAU/USD 中的高速、短期短線交易者提供精確、實時的趨勢分析。 專為1分鐘時間框架設計,此工具顯示方向箭頭以明確顯示入場點,使短線交易者能在波動市場中自信操作。 該指標包含主要和次要警示箭頭。主要信號為白色和黑色方向箭頭,用於指示趨勢方向的轉變;次要信號為藍色和紅色箭頭,用於確認主要箭頭指示的方向並提示潛在交易入場點。 注意:當趨勢方向發生變化後僅出現一個主要警報箭頭時,請注意可能會出現多個次要藍/紅箭頭。次要信號將在滿足信號標準的任何蠟燭圖後出現,因此在長期趨勢移動中,螢幕上將顯示大量次要箭頭(如附帶的截圖所示)。您可在設置中開啟或關閉任一箭頭類型。 以下是我使用此指標進行交易的方式: - 對於買入入場,我會耐心等待白箭頭在蠟燭收盤時出現,並在下一根可用蠟燭收盤時出現藍箭頭時進行買入交易。 - 對於賣出入場,我會耐心等待黑箭頭在蠟燭收盤時出現,並在下一根可用蠟燭收盤時出現紅箭頭時進行賣出交易。 - 獲利了結/止損設置由使用者自行負責,但我個人使用最低R:R為1:2,並發現這在倫敦/紐約開盤等
ForexTrendMT4
Andriy Sydoruk
5 (1)
ForexTrendMT4 Indicator: A Reliable Tool for Market Tracking The ForexTrendMT4 indicator offers reliable market trend tracking, filtering out sudden fluctuations and market noise. This tool helps identify trends and signals favorable entry points into the market using arrows. It is suitable for both scalping on shorter timeframes and long-term trading strategies. Based on the principles of technical analysis, ForexTrendMT4 takes into account the cyclical nature of the market. Key Features and A
Super Signal – Skyblade Edition 專業級無重繪 / 無延遲趨勢信號系統,擁有卓越勝率 | 適用於 MT4 / MT5 在較低的時間週期上效果最佳,例如 1 分鐘、5 分鐘與 15 分鐘圖表。 核心特色: Super Signal – Skyblade Edition 是一套專為趨勢交易設計的智能信號系統。 其採用多重濾波邏輯,僅篩選出具有明確方向性、動能強勁且波動結構健康的走勢進場點。 本系統 不預測高點或低點 ,只有在同時滿足以下三項條件時才會觸發交易信號: 趨勢方向明確 動能持續增強 波動率結構穩定 此外,系統還結合市場流動性分析,以進一步提升信號的準確性與觸發時機。 信號特性: 所有箭頭信號皆為 100% 無重繪,無延遲 信號一旦出現即固定於圖表,不會閃爍或消失 提供圖表箭頭、資訊面板、彈出通知、聲音提示及推播訊息 支援 EA 呼叫(Buffer 輸出),可整合至自動化交易或信號跟單系統 提供預設參數模板,免調整即可使用,適合新手快速上手 總結: Super Signal – Skyblade Edition 是一款邏輯清晰、穩定高效的專業趨勢型
Advanced Currency Strength28 Indicator
Bernhard Schweigert
4.91 (659)
目前40%的折扣 任何新手或专家交易者的最佳解决方案! 这个指标是一个独特的、高质量的、可负担得起的交易工具,因为我们纳入了一些专有的功能和一个新的公式。只需一个图表,你就可以读出28个外汇对的货币强度!想象一下,你的交易将如何得到改善,因为你的交易是在你的手中进行的。想象一下,你的交易将如何改善,因为你能够准确地确定新趋势或剥头皮机会的触发点? 用户手册:点击这里  https://www.mql5.com/en/blogs/post/697384 这是第一本,原版的! 不要买一个毫无价值的崇拜者的克隆品。 特别的 子窗口中的箭头显示强劲的货币势头GAP将指导你的交易! 当基础货币或报价货币处于超卖/超买区域(外盘斐波那契水平)时,在个人图表的主窗口中出现警告信号。 当货币力量从外围区间回落时,回撤/反转警报。 十字星模式的特别警报 可选择多个时间框架,以快速查看趋势! 货币强度线在所有的时间框架中都非常平稳,当使用较高的时间框架来识别总体趋势,然后使用较短的时间框架来确定精确的入口时,效果非常好。你可以根据自己的意愿选择任何时间框架。每个时间框架都由其自身进行了优化。
Volume Orderflow Profile
Suvashish Halder
5 (2)
Introducing Volume Orderflow Profile , a versatile tool designed to help traders visualize and understand the dynamics of buying and selling pressure within a specified lookback period. Perfect for those looking to gain deeper insights into volume-based market behavior! MT5 Version -  https://www.mql5.com/en/market/product/122657 The indicator gathers data on high and low prices, along with buy and sell volumes, over a user-defined period. It calculates the maximum and minimum prices during this
Smart Price Action Concepts
Issam Kassas
4.56 (16)
Smart Price Action Concepts — MetaTrader 4 如有产品、设置或技术支持方面的问题,请直接在 MQL5 上给我发消息。 功能: • Smart Money Concepts SMC • Inner Circle Trading ICT • Price Action PA 和 Institutional Trading IT • 实时市场结构和 swing structure highs and lows (HH HL LL LH) • 实时内部和 swing supply and demand order blocks • Premium Equilibrium 和 Discount Zones • 自动 Fibonacci 检测,提供 2 种选项:当前 swing 或前一个 swing • Equal highs 和 equal lows 形态 • Break of Structure BOS 提醒 • Change of Character CHoCH 提醒 • 高周期 BoS 和 CHoCH 提醒 • 多周期 BOS 和 CHOCH dash
True Direction Oscillator
Muhammad Elbermawi
4.85 (364)
或 (TDO),它是一种使用“ 纯动量 ”原理衡量价格变化率的指数。 当证券价格从 10 上涨到 15 时,价格变化率为 150%,但当它从 15 回落到 10 时,价格变化率仅为 33.3%。这就是为什么像“价格变化率”(ROC) 或“动量”这样的技术分析指标给出的上升价格走势读数高于下降价格走势读数的原因。 TDO 解决了这个问题,以帮助交易者正确读取动量。 重要信息 TDO 用户手册: https://www.mql5.com/en/blogs/post/717970 TDO 常见问题: https://www.mql5.com/en/blogs/post/722015 TDO 视频库: https://www.mql5.com/en/blogs/post/722018 TDO Expert Advisor 示例: https://www.mql5.com/en/blogs/post/731141 TDO 特性 TDO 以百分比计算纯动量,因此它用于比较来自不同市场的不同证券。 (例如:将 EURUSD 与 Gold & Dow Jones Industrial 进行比较)
Trend Lines PRO
Roman Podpora
5 (2)
TREND LINES PRO 帮助您了解市场真正的方向转变点。该指标显示真实的趋势反转点以及主要参与者重新入场的时机。 您可以看到 BOS线、 趋势变化和更高时间框架的关键水平——无需复杂的设置或不必要的干扰。信号不会重绘,并在K线收盘后仍然保留在图表上。 VERSION MT 5    -   与……搭配使用时,可发挥其最大潜力   RFI LEVELS PRO 指示器 该指标显示的内容: 实际变化 趋势(BOS 线) 一旦信号出现,它就始终有效!这与会重绘的指标有着重要的区别,后者可能会发出信号后又改变信号,从而导致资金损失。现在,您可以更精准、更准确地进入市场。此外,还有一个功能,会在箭头出现后为K线着色,直到达到目标价位(止盈)或出现反转信号为止。 重复条目   以及主要玩家的充值 为了提高寻找入场点时的视觉清晰度,我们创建了一个模块,该模块首先显示买入/卖出区域,并在该区域内寻找最佳入场点。此外,我们还加入了智能逻辑来管理止损位,该逻辑会随着时间的推移逐步降低止损位的大小,从而降低入场交易时的初始风险(移动止损位)。 信号强度水平(BOS) 该指标采用三个显著性等级来衡量
目前八折优惠! 对任何新手或专家交易者来说都是最好的解决方案! 这个仪表板软件适用于28种货币对。它基于我们的两个主要指标(高级货币强度28和高级货币冲动)。它对整个外汇市场提供了一个伟大的概述。它显示高级货币强度值,货币运动速度和28个外汇对在所有(9)时间段的信号。想象一下,当你可以使用图表上的单一指标观察整个市场,以确定趋势和或剥头皮的机会时,你的交易将得到改善 我们已经在这个指标中建立了一些功能,使你更容易识别强势和弱势货币,同时识别和确认潜在的交易。该指标以图形方式显示货币的强势或弱势是增加还是减少,以及它在所有时间段的表现。 增加的新功能是动态市场斐波那契水平,它适应当前的市场条件变化,这是一个已经在我们的高级货币强度28和高级货币冲动指标中使用的成熟的加分项。 在交易时,总是将弱势货币和强势货币配对,这个新指标将帮助你做到这一点。 用户手册:点击这里  https://www.mql5.com/en/blogs/post/708783 特点  显示每个时间段的ACS28和GAP-speed(冲动)的货币强度值。 列:颜色代码以7种颜色显示货币强度:强势
Advanced Supply Demand
Bernhard Schweigert
4.91 (302)
现在优惠 30%! 任何新手或专业交易者的最佳解决方案! 该指标是一款独特、高质量、且价格合理的交易工具,因为我们已经整合了许多专有功能和新公式。 依据此更新,您将能够显示双重时间帧区域。 您不仅可以显示一个较高的时间帧,还可以同时显示图表时间帧,加上更高的时间帧:显示嵌套时区。 供需双方所有交易者都会喜欢它。 :) 重要信息披露 高级供需的最大潜力,请访问 https://www.mql5.com/zh/blogs/post/720245   想象您的交易如何得以改善,是因为您能够精准定位入场或目标位吗? 构建于新的底层算法,它可以更轻松地识别出买卖双方之间的潜在失衡。 这是因为它以图形方式展示供需最强劲区域,及其过去的表现(显示旧区域)。 这些功能旨在帮助您更轻松地发现最佳入场区域和价位。 现在您可以针对您的交易品种和时间帧来优化和编辑区域强度! 高级供需指标适用于所有产品和时间帧。 它是一个新的公式,非常新的功能是两个区域强度函数可由用户输入进行调整! 这在交易中是一大优势。 当您学习如何使用专有功能,例如带有价格游离最小 X 因子的区域强度时,您能够判断该区域强劲与否。 供需
作者的更多信息
LiquiditySweep Pro EA
Qiyas Baghirov
5 (1)
LiquiditySweep Pro Market MT5 v1.3 版本 1.3 – 2026.04.25 LiquiditySweep Pro Market 是一款基于流动性扫荡(Liquidity Sweep / Stop Hunt)概念的专家顾问(EA),旨在检测近期高点和低点的价格扫荡,并在市场出现反转确认时执行交易。 核心策略 核心策略保持简单且高效: 检测价格突破近期高点或低点的流动性扫荡 通过K线收盘行为确认反转 应用可选的EMA趋势方向过滤 仅在选定的市场交易时段进行交易 通过止损(Stop Loss)、止盈(Take Profit)、保本(Break-Even)和移动止损(Trailing Stop)管理仓位 此版本在不改变原始策略核心逻辑的前提下,针对真实账户交易稳定性进行了优化。 核心交易逻辑 EA 使用可配置的回溯周期(lookback)监控市场结构。 卖出条件:价格突破近期高点后重新收于该水平下方 买入条件:价格突破近期低点后重新收于该水平上方 该方法基于一个理念:价格在反转之前,通常会先扫荡高点或低点附近的流动性。 交易方向模式 EA 提供灵活的
SMC Reversing
Qiyas Baghirov
SMC Reversing v1.4 概述 (Overview) SMC Reversing 是一款基于 Smart Money Concepts(SMC)、流动性扫盘(liquidity sweep)检测以及反转交易逻辑开发的专家顾问(Expert Advisor)。 该 EA 通过监控近期的高点和低点来识别可能的止损扫盘(stop-hunt)行为。当价格突破流动性水平并重新收回至区间内时,系统会识别为潜在的反转机会并自动执行交易。 1.4 版本主要专注于执行稳定性、风险控制、经纪商兼容性以及针对真实市场环境的优化过滤系统。 版本 1.4 的改进内容 与 предыдущ版本相比,本次更新改进了多个重要方面: 在高点差条件下提供更好的控制 在低波动市场中改进过滤机制 为重要市场事件提供手动新闻过滤选项 提升订单执行的安全性 优化对经纪商止损距离(stop level)的处理 新增交易时段控制功能 提升对不同经纪商条件的兼容性 核心交易策略保持不变,但执行和过滤系统得到了优化。 核心交易逻辑 (Core Trading Logic) 该 EA 使用以下交易模型: 基于历史高点和低点识
TrendLines Pro EA v1.1 – 专业黄金突破剥头皮系统 TrendLines Pro EA   是一款专为黄金市场 ( XAUUSD ) 设计的高级算法交易系统。它能自动识别机构级的趋势线,并在市场流动性高峰时段执行高概率的突破交易。  1.1 版本有哪些新功能? 与旧版本相比,v1.1 版本引入了关键的升级,以确保更好的性能和安全性: 验证保证金控制 (Validated Margin Control):   新增安全层,在每笔交易前检查账户的可用保证金,防止过度杠杆,符合专业交易标准。 增强型 MQL4 架构:   针对最新的 MT4 版本进行了代码重构,确保极速执行并与经纪商服务器协议 100% 兼容。 改进的手数正规化:   优化的交易量计算逻辑,自动适应经纪商特定的最小/最大手数要求及步长。 优化交易时段过滤器:   更新了伦敦和纽约时段的逻辑,以更好地应对市场波动并避开低流动性间隙。 精准价格处理:   升级了黄金的小数位数 (Digits) 处理能力,确保止损 (SL) 和止盈 (TP) 订单的放置极其精确。 核心策略逻辑 该 EA 实时分析价格行为,
Trend Finder Fractal PRO
Qiyas Baghirov
5 (1)
Fractal Strategy Pro NR MTF – 用户使用指南 1. 什么是这个指标? Fractal Strategy Pro NR MTF 是一款高级 MT4 指标,结合了趋势分析、分形逻辑、多时间框架(MTF)仪表盘、自动 Fibonacci,以及 Repaint / Non-Repaint 切换功能。 该指标可以显示: BUY / SELL 信号 M30 / H1 / H4 标记线 趋势线(Trendlines) 自动 Swing Fibonacci 水平 多时间框架趋势方向 2. 安装方法 打开 MetaTrader 4。 进入: File → Open Data Folder 打开文件夹: MQL4 → Indicators 将指标文件 ( Fractal_Strategy.ex4 ) 复制到该文件夹中。 重启 MT4 或刷新 Navigator 窗口。 从: Navigator → Indicators 将指标拖到图表上。 3. 基本使用方法 指标显示: 绿色/蓝色信号 = BUY 机会 红色信号 = SELL 机会 BUY Signal 当价格接近下方支撑/
FVG iFVG Smart Zones 是一款专业的 MetaTrader 4 指标,用于在图表上自动识别并显示 Fair Value Gap(FVG)和 Inverse Fair Value Gap(iFVG)区域。 该指标基于市场结构和价格失衡自动识别多头与空头失衡区域,并以清晰、专业的智能矩形区域实时显示在图表上,同时支持标签显示,提升图表分析体验。 主要功能: • 自动检测多头与空头 FVG 区域 • 可选显示 iFVG(已回补失衡)区域 • 支持收盘价或影线的智能 Mitigation 逻辑 • 支持区域向右延伸 • 轻量化与优化结构 • 专业清晰的图表视觉效果 • 完全可自定义颜色与参数 • 适用于剥头皮、日内交易及 Smart Money 交易策略 主要参数: • Lookback Bars — 用于检测区域的历史K线数量 • Show FVG — 显示 / 隐藏有效 Fair Value Gap 区域 • Show iFVG — 显示 / 隐藏已回补 / 反向 FVG 区域 • Close Mitigation — 使用收盘价确认 Mitigation • Wick
SMART REVERSAL PATTERN INDICATOR — User Guide 1. Installation Open your MetaTrader 4 platform. Go to File → Open Data Folder . Open the folder: MQL4 → Indicators Copy the indicator file into this folder. Restart MetaTrader 4 or refresh the Navigator panel. Find SMART REVERSAL PATTERN INDICATOR in the Navigator. Drag and drop it onto your chart. 2. How the Indicator Works SMART REVERSAL PATTERN INDICATOR detects reversal pattern structures based on ZigZag swing points. The indicator marks the lat
Smart Multi Timeframe Fractals – User Guide Overview Smart Multi Timeframe Fractals is a MetaTrader 4 indicator designed to show confirmed fractal signals directly on the chart. The indicator can display both current timeframe fractals and higher timeframe fractals such as M5, M15, M30, H1, H4 and D1. The main purpose of this indicator is to help traders identify important market turning points, support and resistance zones, and higher timeframe confirmation areas. Main Features Confirmed fracta
Swing Highs Lows Candle Patterns Pro Swing Highs Lows Candle Patterns Pro is a professional price action indicator designed to identify important swing highs, swing lows and high-probability reversal candle patterns automatically. The indicator combines market structure analysis with candlestick confirmation to help traders locate potential BUY and SELL opportunities without cluttering the chart. Unlike ordinary swing indicators, it not only detects Higher Highs (HH), Higher Lows (HL), Lower Hi
QB Institutional Bands NR QB Institutional Bands NR is a premium MetaTrader 4 (MT4) technical analysis indicator designed by Qiyas Baghirov to identify trends, volatility zones, and institutional market structures. It provides real-time, algorithmic trading visualizations across asset classes like Gold (XAUUSD), Forex, indices, and crypto markets. Key Technical Mechanisms Dual-Layer Volatility Tracking: Consists of Outer Gold Bands that outline exhaustion or profit-taking points, alongside Inne
1. 什么是 Liquidity Setup PRO V1? Liquidity Setup PRO V1 是一款基于 Smart Money Concept(SMC)理念开发的 MT4 指标,用于逐步识别和显示 liquidity sweep、stop hunt、BOS(结构突破)以及 CHOCH 信号。 该指标会自动分析市场价格行为,并在图表上显示完整的 BUY 和 SELL setup。 适用于: Smart Money 交易者 Liquidity Sweep 策略 BOS / CHOCH 交易 机构交易逻辑 日内交易与剥头皮交易 2. 主要功能 自动识别 BUY / SELL Setup BUY Setup 价格跌破 sell-side liquidity 确认 liquidity sweep 出现强势 bullish K线 BOS 确认 BUY 信号 SELL Setup 价格突破 buy-side liquidity 确认 stop hunt 出现强势 bearish rejection K线 CHOCH / BOS 确认 SELL 信号 3. Dashboard(信息面板
Heiken Ashi Trend is a MetaTrader 4 indicator designed to help traders identify trend direction using Heiken Ashi candle structure combined with trend-confirmation filters. The indicator displays bullish and bearish trend phases directly on the chart, helping traders follow market direction more clearly and avoid unnecessary noise during fast price movement. Main Features Heiken Ashi based trend visualization Smooth trend-following structure Optional EMA line display ADX, CCI and MACD confirmati
Nested Pivot Arrows NR Nested Pivot Arrows NR is a non-repaint MT4 and MT5 indicator that identifies nested pivot structures and highlights potential market turning points directly on the chart. The indicator automatically detects: • Short-Term Highs (STH) and Short-Term Lows (STL) • Medium-Term Highs (MTH) and Medium-Term Lows (MTL) • Long-Term Highs (LTH) and Long-Term Lows (LTL) • Buy and Sell signals based on confirmed nested pivot formations Features: Non-Repaint Logic MT4 & MT5 Version
QB Compass Signal Pro QB Compass Signal Pro is an advanced predictive market direction indicator for MetaTrader 4. It transforms multiple technical factors into a visual compass that helps traders identify potential BUY, SELL, EXTREME BUY, and EXTREME SELL zones before traditional trend-following indicators react. Unlike conventional indicators that only follow price, QB Compass Signal Pro combines momentum, volatility expansion, EMA angle analysis, RSI slope, fractal breakouts, and market struc
Gold Market DNA Pro Gold Market DNA Pro is an innovative trading indicator designed with an original mathematical approach instead of relying on traditional technical indicators. Unlike conventional indicators based on moving averages, RSI, MACD, ATR, Fibonacci, or ZigZag, Gold Market DNA Pro analyzes the market through its own proprietary Market DNA Engine. Key Features - Original Market DNA calculation engine - No Moving Averages - No RSI - No MACD - No ATR - No Fibonacci - No ZigZag - No
Overview EMA Cross Pullback Pro is a professional non-repaint trend-following indicator designed for traders who use EMA crossovers and pullback entries. It combines fast and slow EMA analysis with reversal confirmation to identify high-probability trading opportunities. The indicator automatically detects: EMA Cross BUY and SELL signals Pullback/Reversal confirmation Trend direction Profit/Loss statistics Monthly performance summary Historical signal analysis from a user-defined start date Buil
QB Schumann Market Resonance MT4 QB Schumann Market Resonance MT4 is an advanced market rhythm indicator inspired by the concept of resonance and market pressure analysis. Instead of relying on traditional lagging indicators, it evaluates the balance between bullish and bearish pressure using candle structure, volatility, momentum, and tick activity to identify potential turning points and directional strength. The indicator displays an intuitive dashboard with live Bull Pressure, Bear Pressure,
Tree Market Growth MT4 Nature-Inspired Multi-Timeframe Trend Analysis Tree Market Growth MT4 is a visual trend analysis indicator that transforms market behavior into a 12-stage tree life cycle. It combines trend strength, momentum, volatility, market structure and multi-timeframe confirmation into a single easy-to-read dashboard, helping traders identify trend development, continuation and possible exhaustion. Features • 12-Stage Tree Life Cycle • Multi-Timeframe Analysis (M1, M5, M15, M30, H1,
ZigZag Probability Pro Color 是一款适用于 MetaTrader 4 (MT4) 的技术指标,用于识别已确认的 ZigZag 波峰(Swing High) 和 波谷(Swing Low) ,并通过基于概率的反转模型对每个拐点进行评估。 该指标综合分析 Tick 成交量(Tick Volume) 、 Awesome Oscillator(AO) 、 ATR(平均真实波幅) 、波段长度(Swing Size)、K线数量(Bar Count)以及历史拐点表现。根据计算结果,每个已确认的拐点都会被赋予以下四种概率等级之一: 25% 50% 75% 100% 每一段 ZigZag 连线都会根据对应的概率自动着色: 25% — 绿色 50% — 黄色 75% — 橙色 100% — 红色 在检测到的拐点位置,指标会直接显示 BUY(买入) 或 SELL(卖出) 箭头,并标注计算出的概率百分比。随着信号强度的提高,箭头和百分比标签的尺寸也会自动增大,使重要信号更加醒目。 该指标还支持 弹窗提醒(Popup) 、 声音提醒(Sound) 、 Push
LiquiditySweep Pro Market MT5 v1.3 版本 1.3 – 2026.04.26 LiquiditySweep Pro Market 是一款基于流动性扫荡(Liquidity Sweep / Stop Hunt)概念的专家顾问(EA),旨在检测近期高点和低点的价格扫荡,并在市场出现反转确认时执行交易。 核心策略 核心策略保持简单且高效: 检测价格突破近期高点或低点的流动性扫荡 通过K线收盘行为确认反转 应用可选的EMA趋势方向过滤 仅在选定的市场交易时段进行交易 通过止损(Stop Loss)、止盈(Take Profit)、保本(Break-Even)和移动止损(Trailing Stop)管理仓位 此版本在不改变原始策略核心逻辑的前提下,针对真实账户交易稳定性进行了优化。 核心交易逻辑 EA 使用可配置的回溯周期(lookback)监控市场结构。 卖出条件:价格突破近期高点后重新收于该水平下方 买入条件:价格突破近期低点后重新收于该水平上方 该方法基于一个理念:价格在反转之前,通常会先扫荡高点或低点附近的流动性。 交易方向模式 EA 提供灵活的交
Swing Highs Lows Candle Patterns Pro Swing Highs Lows Candle Patterns Pro is a professional price action indicator designed to identify important swing highs, swing lows and high-probability reversal candle patterns automatically. The indicator combines market structure analysis with candlestick confirmation to help traders locate potential BUY and SELL opportunities without cluttering the chart. Unlike ordinary swing indicators, it not only detects Higher Highs (HH), Higher Lows (HL), Lower Hi
Nested Pivot Arrows NR MT5 Nested Pivot Arrows NR is a non-repaint MT4 and MT5 indicator that identifies nested pivot structures and highlights potential market turning points directly on the chart. The indicator automatically detects: • Short-Term Highs (STH) and Short-Term Lows (STL) • Medium-Term Highs (MTH) and Medium-Term Lows (MTL) • Long-Term Highs (LTH) and Long-Term Lows (LTL) • Buy and Sell signals based on confirmed nested pivot formations Features: Non-Repaint Logic MT4 & MT5 Ver
筛选:
无评论
回复评论