Smart Reversal Pattern

SMART REVERSAL PATTERN INDICATOR — User Guide

1. Installation

  1. Open your MetaTrader 4 platform.
  2. Go to File → Open Data Folder.
  3. Open the folder:
    MQL4 → Indicators
  4. Copy the indicator file into this folder.
  5. Restart MetaTrader 4 or refresh the Navigator panel.
  6. Find SMART REVERSAL PATTERN INDICATOR in the Navigator.
  7. Drag and drop it onto your chart.

2. How the Indicator Works

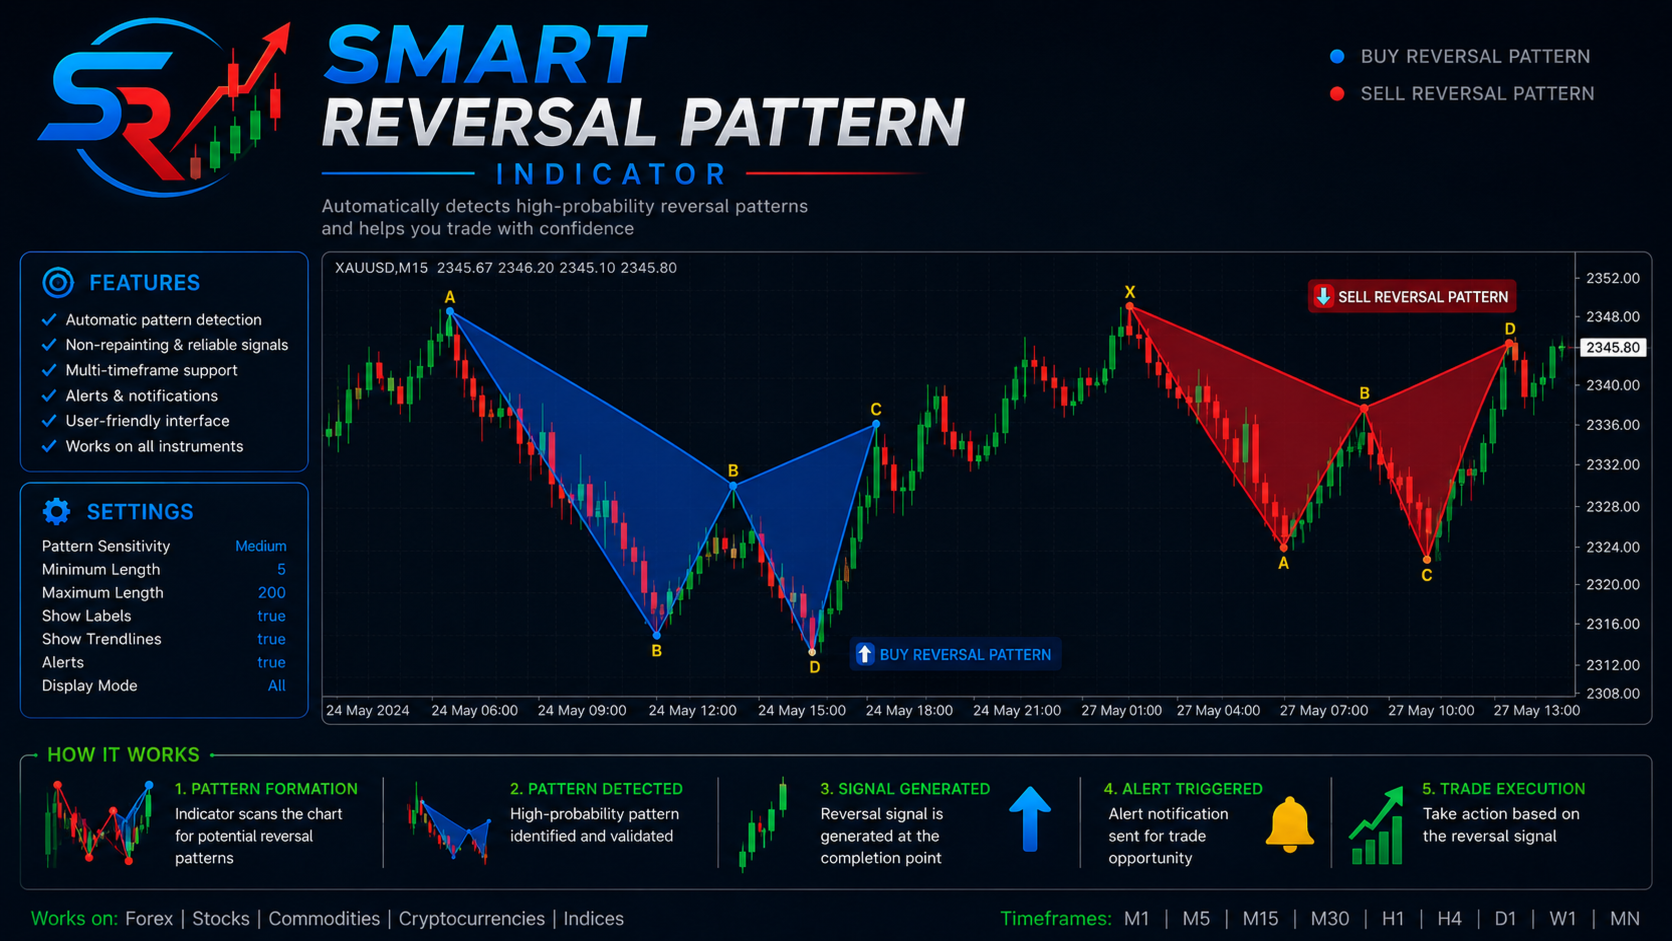
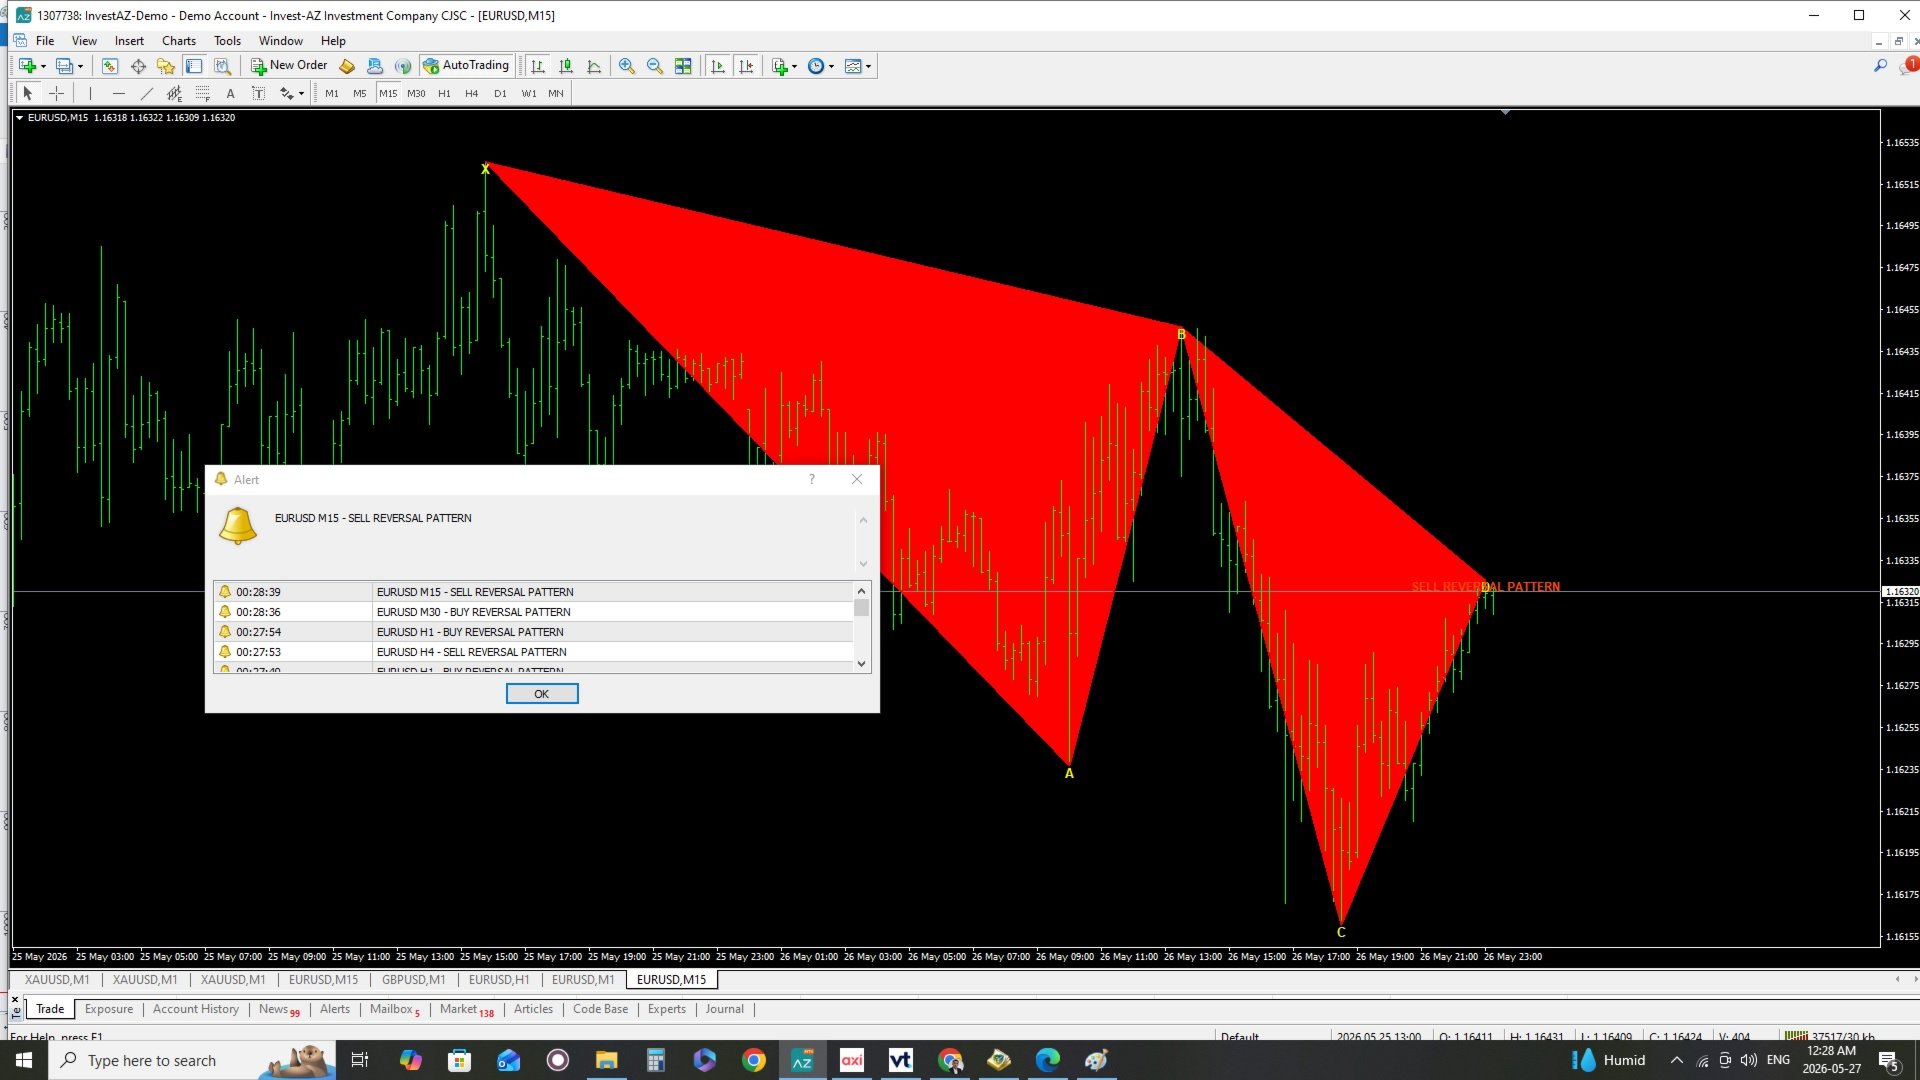
SMART REVERSAL PATTERN INDICATOR detects reversal pattern structures based on ZigZag swing points.

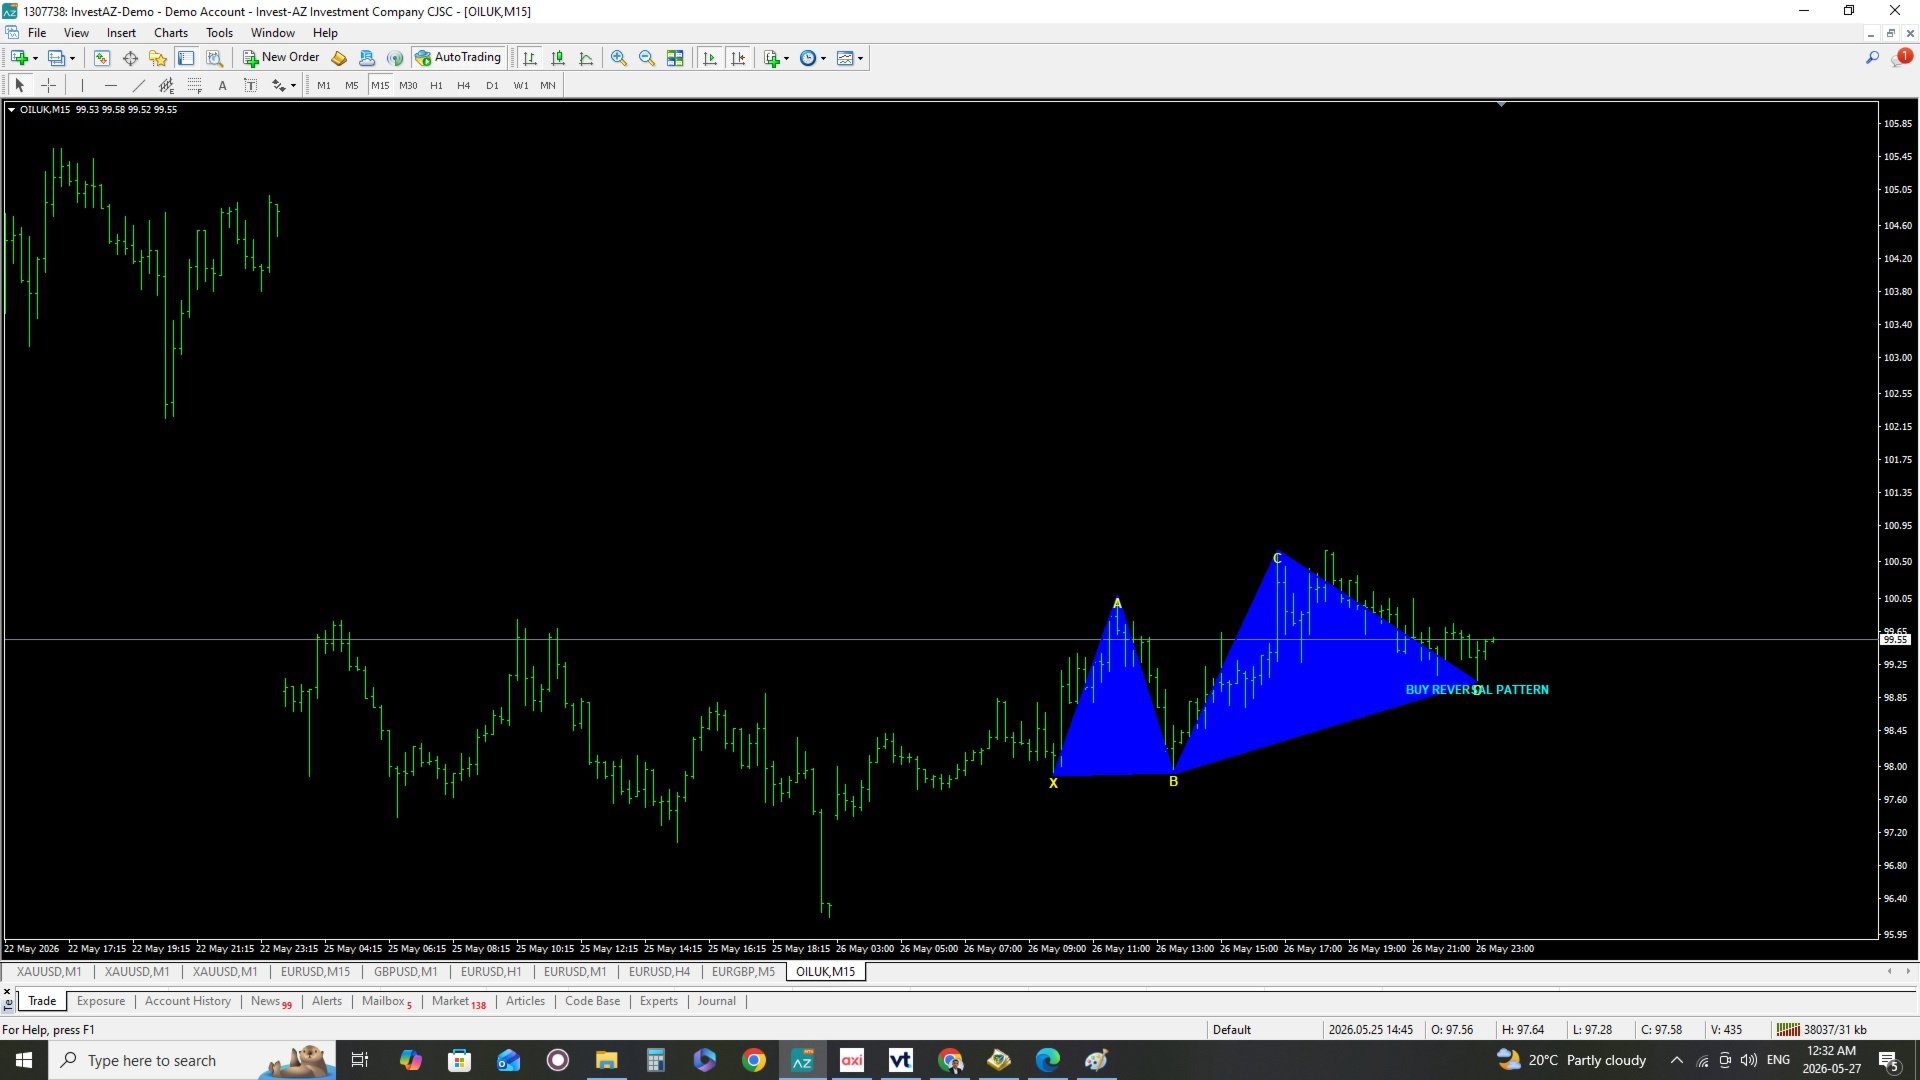
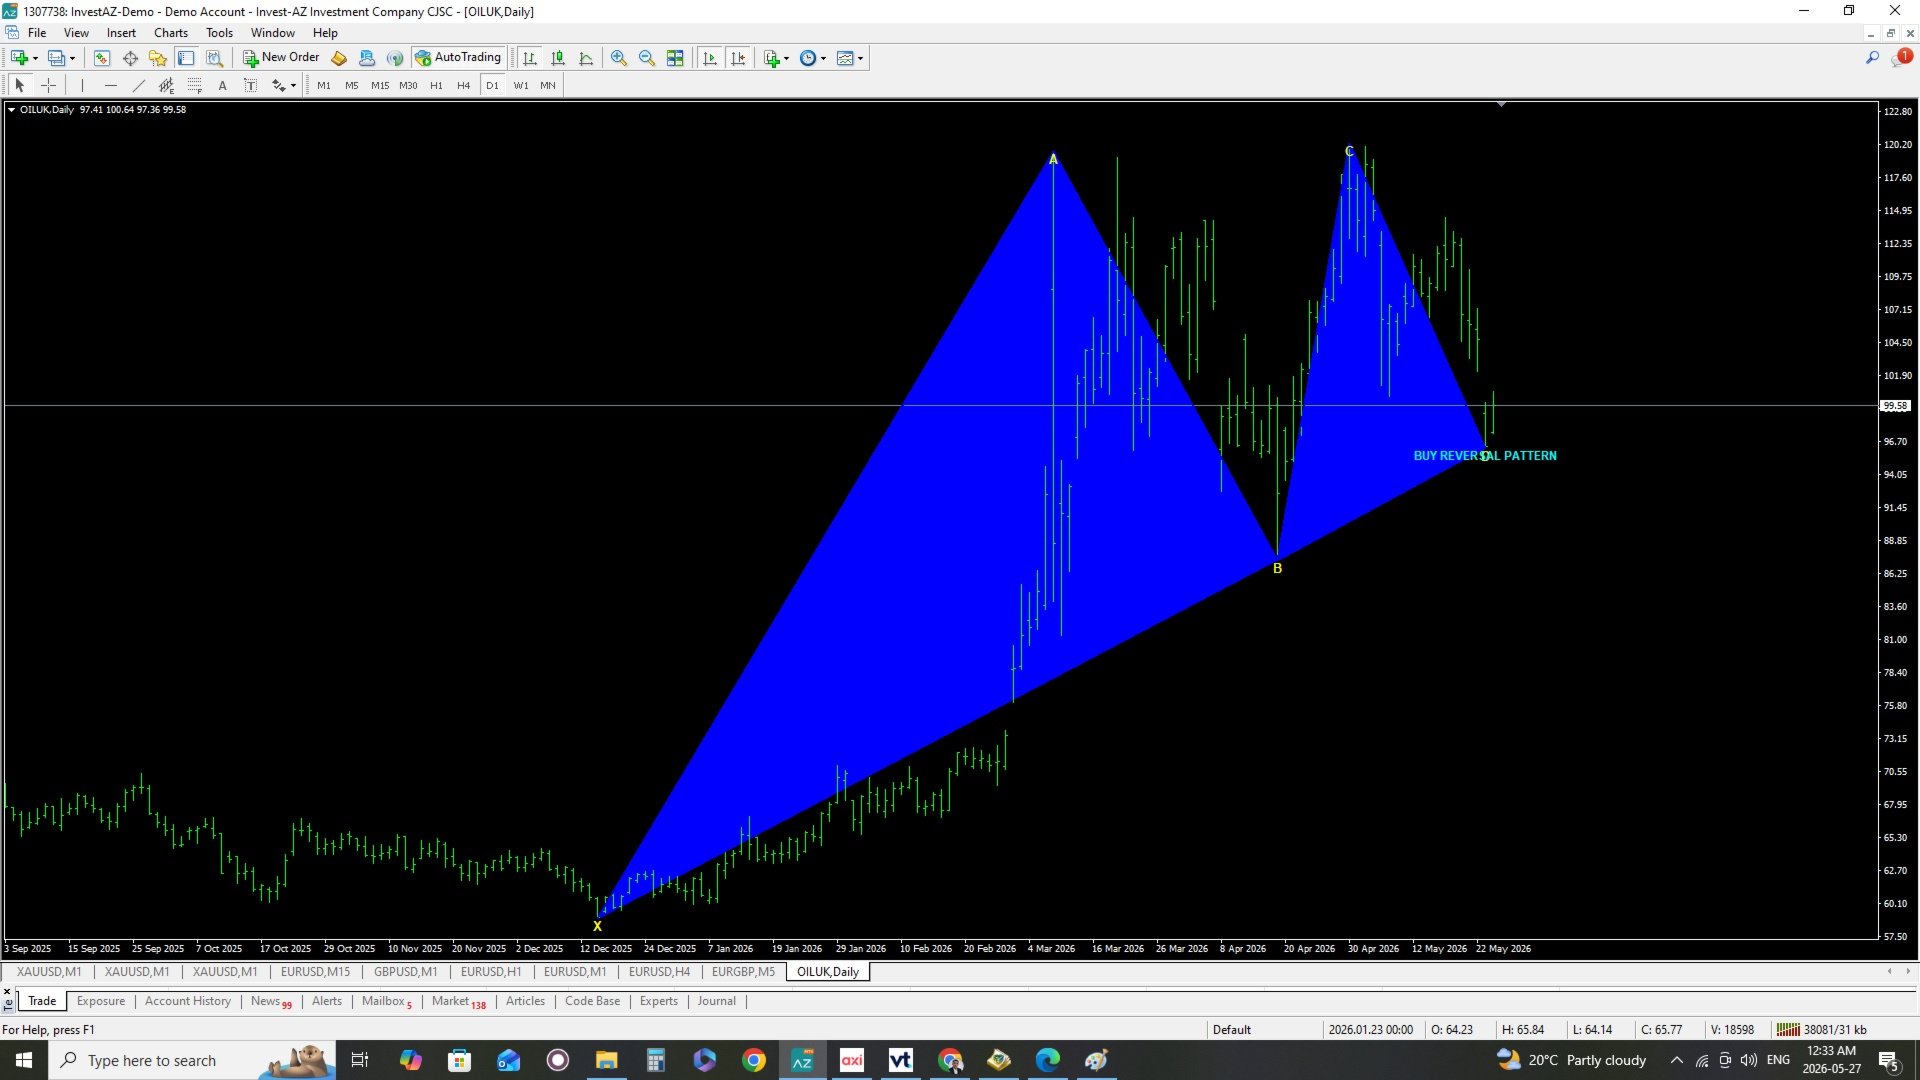
The indicator marks the latest reversal formation directly on the chart using trendlines, filled pattern zones, and X-A-B-C-D labels.

When a bullish reversal structure is detected, the pattern is displayed in blue.

When a bearish reversal structure is detected, the pattern is displayed in red.

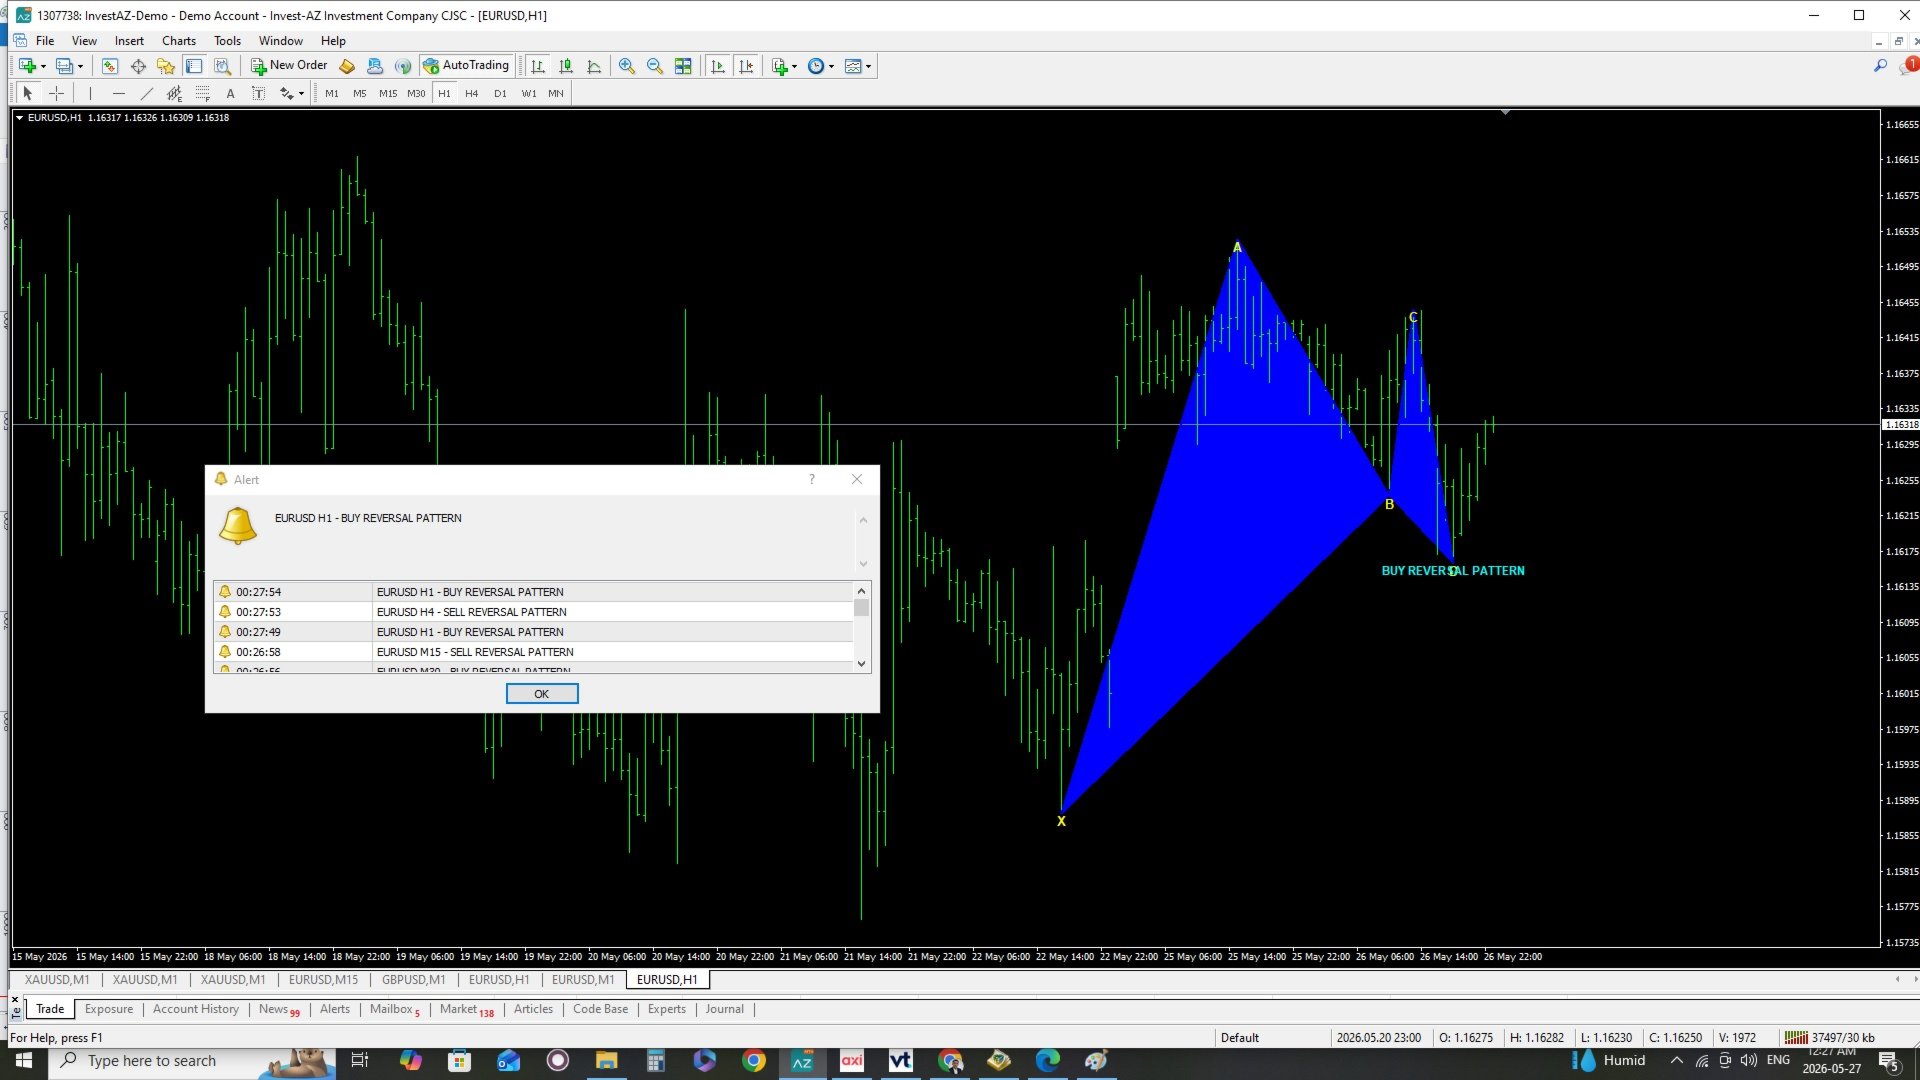
The indicator can also send alerts when a new reversal pattern is detected.

3. Main Inputs

ZigZagDepth
Controls the sensitivity of swing detection. Higher values detect larger market swings.

ZigZagDeviation
Defines the minimum price deviation required for ZigZag movement.

ZigZagBackstep
Controls how close ZigZag points can be to each other.

LookbackBars
Defines how many candles the indicator scans for pattern detection.

BuyPatternColor
Color of bullish reversal patterns.

SellPatternColor
Color of bearish reversal patterns.

BuyTextColor
Text color for bullish reversal signal labels.

SellTextColor
Text color for bearish reversal signal labels.

PointTextColor
Color of X, A, B, C, and D labels.

ShowLabels
Shows or hides chart labels.

EnableAlert
Turns platform popup alerts on or off.

EnablePush
Enables mobile push notifications.

EnableEmail
Enables email notifications.

4. Signal Interpretation

BUY Reversal Pattern
A blue pattern means the indicator has detected a potential bullish reversal structure.

SELL Reversal Pattern
A red pattern means the indicator has detected a potential bearish reversal structure.

The signal should not be used alone. It is recommended to confirm the signal with market structure, support and resistance, trend direction, volatility, and risk management.

5. Recommended Usage

Use the indicator on liquid trading instruments such as Forex pairs, Gold, indices, or other active markets.

Recommended timeframes:

M15, M30, H1, H4

For scalping, lower timeframes can be used, but signals may be more frequent and require stronger confirmation.

6. Alerts

When alerts are enabled, the indicator notifies you when a new reversal pattern appears.

To use mobile push notifications:

  1. Open MetaTrader 4.
  2. Go to Tools → Options → Notifications.
  3. Enable Push Notifications.
  4. Enter your MetaQuotes ID.
  5. Enable EnablePush = true in the indicator settings.

To use email alerts:

  1. Go to Tools → Options → Email.
  2. Configure your email settings.
  3. Enable EnableEmail = true in the indicator settings.

7. Important Notes

This indicator is a technical analysis tool and does not guarantee future market movement.

Always use proper risk management.

Backtest and forward test the indicator on a demo account before using it on a real trading account.

Market conditions, spread, volatility, and broker execution may affect trading results.

8. Disclaimer

Trading Forex, CFDs, and other financial instruments involves risk. This indicator does not provide financial advice. The user is responsible for all trading decisions and risk management.
推荐产品
Blahtech Market Profile
Blahtech Limited
4.53 (15)
Was: $249  Now: $99   Market Profile defines a number of day types that can help the trader to determine market behaviour. A key feature is the Value Area, representing the range of price action where 70% of trading took place. Understanding the Value Area can give traders valuable insight into market direction and establish the higher odds trade. It is an excellent addition to any system you may be using. Blahtech Limited presents their Market Profile indicator for the MetaTrader community. Ins
History Pattern Search
Yevhenii Levchenko
该指标建立当前报价,可以与历史报价进行比较,并在此基础上进行价格走势预测。指示器有一个文本字段,用于快速导航到所需日期。 选项: 符号 - 选择指标将显示的符号; SymbolPeriod - 选择指标从中获取数据的时段; IndicatorColor - 指示器颜色; HorisontalShift - 由指标绘制的报价移动指定的柱数; Inverse - true 反转引号,false - 原始视图; ChartVerticalShiftStep - 图表垂直移动(键盘上的向上/向下箭头); 接下来是文本字段的设置,您可以在其中输入日期,您可以通过按“回车”立即跳转到该日期。 接下来是文本字段的设置,您可以在其中输入日期,您可以通过按“回车”立即跳转到该日期。
Master Volume profile
Israr Hussain Shah
Money Flow Profile MT5 HERE   Here   our more valuable tools SMC Trend Trading   ,  Easy SMC Trading  ,  Institutional SMC Architect Volume Analysis Tools  ,  Volume flow Profile  ,  Market volume profile  , FVG with Volume  , Liquidity Heatmap Profile  ,  Volume Spread Analysis This Master Edition is engineered for clarity and speed, featuring a unique Auto-Theme Sync system that instantly beautifies your chart layout upon loading. Key Features: True Money Flow Calculation: Goes beyond stand
The indicator allows you to trade binary options. The recommended time frame is М1 and the expiration time is 1,2,3 minutes. The indicator suitable for auto and manual trading. A possible signal is specified as a arrows above/under a candle. You should wait until the candle closes! Arrows are not re-painted Trade sessions: TOKYO section (Half-end) Currency pairs: USD/JPY Working time frame: M1 Expiration time: 1,2,3 minutes. The indicator also shows good results when using the martingale strateg
FREE
Cosmic Diviner X Planet
Olena Kondratenko
4 (2)
This unique multi-currency strategy simultaneously determines the strength of trends and market entry points, visualizing this using histograms on the chart. The indicator is optimally adapted for trading on the timeframes М5, М15, М30, Н1. For the convenience of users, the indicator renders the entry point (in the form of an arrow), recommended take profit levels (TP1, TP2 with text labels) and the recommended Stop Loss level. The take profit levels (TP1, TP2) are automatically calculated for
Volume Profile Sniper v11.1是一款全面的市场分析工具 专业的交易方法 Volume Profile Sniper v11.1在一个指标中结合了超过15个关键过滤器,根据对市场情况的全面评估提供清晰的信号。 主要特点 成交量不平衡分析-该算法计算每个蜡烛中买家和卖家的份额,表明其中一方的优势(可配置阈值从50%到90%)。 多级信号滤波-指标考虑到: 趋势指标(EMA9/21) Rsi不包括超买/超卖区域 蜡烛图案(针杆,吸收,锤子) 支持/阻力水平(自动检测) 音量峰值,以确定主要参与者的活动 经典和放大的RSI分歧 波动率评估的ATR 用于确定趋势强度的ADX 价格行动(内部和外部酒吧) 多时间帧确认 市场结构(高点/低点) 会话过滤器(亚洲,伦敦,纽约会话) 防止新闻排放 灵活的配置系统-MinFiltersRequired参数允许您设置生成信号所需的最小数量的滤波器。 这使得可以使指标适应任何交易策略,从激进到保守。 可视化设置-您可以通过将指示器集成到图形样式中来更改箭头的大小和颜色(ArrowSize,BuyArr
BoxChart MT4
Evgeny Shevtsov
4.4 (5)
The market is unfair if only because 10% of participants manage 90% of funds. An ordinary trader has slim changes to stand against these "vultures". This problem can be solved. You just need to be among these 10%, learn to predict their intentions and move with them. Volume is the only preemptive factor that faultlessly works on any timeframe and symbol. First, the volume appears and is accumulated, and only then the price moves. The price moves from one volume to another. Areas of volume accumu
这是一个预测蜡烛收盘价的指标。 该指标主要用于 D1 图表。 该指标适用于传统外汇交易和二元期权交易。 该指标可以用作独立的交易系统,也可以作为您现有交易系统的补充。 该指标分析当前蜡烛,计算蜡烛本身内部的某些强度因素,以及前一根蜡烛的参数。 因此,该指标预测市场走势的进一步方向和当前蜡烛的收盘价。 由于这种方法,该指标既适用于短期盘中交易,也适用于中长期交易。 该指标允许您设置指标在分析市场情况期间将产生的潜在信号的数量。 在指标设置中有一个特殊的参数。 此外,该指标可以通过图表上的消息、电子邮件以及推送通知的形式通知新信号。感谢您的关注!交易愉快! 购买后一定要写信给我! 我会给你我的交易指标的建议! 还可以获得奖金!
TrendMaster Ultra | Structure-Based Trading Without Guesswork Tired of indicators that repaint after the fact? Sick of counter-trend oscillator signals firing in the middle of a powerful move, and endless stop-losses triggered by market noise? TrendMaster Ultra is not just another arrow indicator; it is an intelligent filter of market reality for MetaTrader 4. The system combines strict Price Action logic (Smart Money Concepts) with adaptive technical analysis. This tool takes over the most co
FREE
Trend Scan Friend
Israr Hussain Shah
Here   our more valuable tools SMC Trend Trading   ,  Easy SMC Trading  ,  Institutional SMC Architect Volume Analysis Tools  ,  Volume flow Profile  ,  Market volume profile  , FVG with Volume  , Liquidity Heatmap Profile  ,  Volume Spread Analysis Trend Identification: Look for the color change. When candles turn Green , look for Buy opportunities. When they turn Red , look for Sell opportunities. Entry: Enter on the break of the trend line or on the pullback to the line. Stop Loss: Use the
SX Supply Demand Zones accurately identifies and draws high-probability Supply and Demand zones using a sophisticated algorithm. Unlike traditional indicators that clutter your chart, this indicator is designed with a focus on performance and a clean user experience. New Unique Feature: Interactive Legend System What truly sets this indicator apart from everything else is the Interactive Control Legend. You have a professional dashboard directly on your chart that allows you to: Show/Hide: Ins
FREE
VR Grid
Vladimir Pastushak
5 (3)
VR 网格指示器 设计 用于创建具有用户定义设置的图形网格。与 标准网格 不同,VR 网格用于构建 圆形关卡 。根据用户的选择,轮次级别之间的步长可以是任意的。此外,与其他指标和实用程序不同,即使时间段发生变化或终端重新启动,VR Grid 也能保持网格的位置 。 设置、设置文件、演示版本、说明、问题解决,可以从以下位置获取 [博客] 您可以在以下位置阅读或撰写评论 [关联] 版本为 [MetaTrader 5] 垂直级别 基于实际时间间隔并 忽略缺失 或不存在的周期。因此,级别之间的步长严格对应于用户选择的值。 使用 VR 网格指标时,交易者 可以更改任何级别的垂直线和水平线的样式 、颜色和粗细。这使您可以控制金融工具的 回合水平 。 整数位是 以两个或多个零结尾 的价格(例如:1.23500、5.65900、1923.200)。人们相信,这样的水平 经常充当 作为支撑或阻力的强点。 Horizontal line settings Horizontal line step Horizontal line color Horizontal line style Horizonta
FREE
PZ Trend Trading
PZ TRADING SLU
4.8 (5)
许多盈利交易者不仅知道如何识别市场趋势,而且也能把握趋势建立后的交易机会。 Pz 趋势交易 指标设计用来在趋势行情中尽可能的赚取利润。 已建立的趋势提供了一揽子交易机会,但大多数趋势交易指标完全忽视了它们,让交易者在趋势行情时完全不知道该如何做!一般趋势指标只通知有关的趋势变化,但根本不足以得到卓越的回报. Pz 趋势交易 指标比一般趋势指标显示多达 20 倍的交易 , 因为它注重所谓的市场时机。它不仅显示当前的市场趋势,也有回调,内柱线的突破和调整。它令您在趋势回调之后介入,安全的柱线内突破金字塔加仓,以及发现潜在的反转,和已知的调整。 趋势改变 一个趋势改变在市场方向变化时发生。趋势变化在图表上用带数字的彩色圆圈显示。蓝色 (1) 信号为上涨开始, 而红色 (1) 信号为下跌开始。趋势变化并非评估当前价格动作的结果, 它意味着交易设置是不定时地。如果您正确使用本指标, 在趋势变化时, 您将将已经入场 (参看下面的调整)。 回调 但凡趋势在运动中,行情上下抖动,盈利者收割利润,且其它参与者入场。趋势回调代表好的买入机会,通常是由主力获利离场导致。如果行情在回调后回归上行, 指标将
VR Cub
Vladimir Pastushak
VR Cub 这是获得高质量切入点的指标。该指标的开发是为了促进数学计算并简化对仓位入场点的搜索。多年来,该指标所针对的交易策略已被证明其有效性。交易策略的简单性是其巨大的优势,即使是新手交易者也能成功进行交易。 VR Cub 计算开仓点以及获利和止损目标水平,这显着提高了效率和易用性。查看使用以下策略进行交易的屏幕截图,了解简单的交易规则。 设置、设置文件、演示版本、说明、问题解决,可以从以下位置获取 [博客] 您可以在以下位置阅读或撰写评论 [关联] 版本为 [MetaTrader 5] 计算入场点的规则 开仓 要计算入场点,您需要将 VR Cub 工具从最后一个高点拉伸到最后一个低点。 如果第一个点在时间上早于第二个点,交易者等待柱线收于中线上方。 如果第一个点在时间上晚于第二个点,交易者等待柱线收于中线下方。 根据上述条件,严格在 柱线收盘 后建仓。 换句话说,如果我们在小时图上进行交易,那么从最高点到最低点的时间距离必须超过24小时,最高点和最低点之间的点数必须大于或等于平均价格变动每天。 维持和改变市场地位 可以有多个未平仓头寸;每个头寸都可以单独修改。 VR Cub
我们为您提供一个指标"蜡烛收盘台",它将成为您在贸易领域不可或缺的助手。 这就是为什么知道蜡烛何时关闭会有所帮助的原因: 如果你喜欢使用蜡烛花纹进行交易,你就会知道蜡烛何时关闭。 此指标将允许您检查是否形成了已知模式以及是否存在交易的可能性。 该指标将帮助您做好市场开放和市场关闭的准备。 可以设置一个计时器来创建计划新闻的预览,这样就可以检查市场对此的反应。 您可以设置指示灯,以便在蜡烛关闭前几秒钟发送警报/警告。 通知/警报/警报可以发送到: 屏幕警报 电子邮件 移动应用 MT4烛台计时器指示器为什么有用 那么烛台计时器什么时候有用呢?如果你长期交易,你可能不需要蜡烛计时器指示器,因为你的参赛不会受到一分钟或一小时的太大影响。但是,如果你在短时间内是黄牛或交易员,那么你知道时机非常重要。 外汇市场24小时开放,只在周末关门,有些策略可能会受到您入仓时出现错误时机的严重影响。 MT4蜡烛计时器指示器可以显示当前蜡烛中的剩余时间,以便为下一次蜡烛打开做好准备。 可以从这一指标中受益的一些情况例子有: 预定消息传出 地理市场开闭 预定发生的事件,通常是金融、经济或政治事件
QuantumEdge Trader
Hossam Ali Ahmed Ali
QuantumEdge Trader v1.0 AI-Powered Precision Signals for Serious Traders QuantumEdge Trader is a smart and reliable indicator that delivers accurate BUY and SELL signals using advanced market analysis and trend detection. Designed for M1 to M60 timeframes, it's ideal for scalping and intraday strategies. --- Key Features: No Repaint – Signals never change after appearing Smart trend filters to reduce noise Adjustable sensitivity and alerts Perfect for XAUUSD, EURUSD, and m
Smart Reversal Oscillator Pro
Atventius Bayu Riswanto
## Smart Reversal Oscillator Pro Smart Reversal Oscillator Pro is an advanced hybrid trading utility designed for MetaTrader 4 that reinvents volatility and momentum analysis. Instead of analyzing raw price action, this indicator applies mathematical Bollinger Bands directly onto the Relative Strength Index (RSI) array data within a separate sub-window. Standard fixed oversold and overbought levels (like 30 and 70) often fail during strong market expansions. This professional oscillator solve
Infinity Trend Pro
Yaroslav Varankin
1 (1)
This is a trend indicator without redrawing Developed instead of the binary options strategy (by the color of the Martingale candlestick) Also works well in forex trading When to open trades (binary options) A signal will appear in the place with a candle signaling the current candle It is recommended to open a deal for one candle of the current timeframe M1 and M5 When a blue dot appears, open a deal up When a red dot appears, open a trade down. How to open trades on Forex. When a signal is rec
Quantum Falcon Signal Free is a smart visual trading indicator for MetaTrader 4 designed for Forex and Gold traders. The indicator combines: • Trend analysis • RSI momentum confirmation • MACD momentum filtering • ATR volatility filtering • Higher timeframe confirmation • Smart exit signal detection Main Features: • Smart Buy and Sell signals • Exit Buy / Exit Sell alerts • Real-time dashboard on chart • Professional candle arrows • Multi-timeframe trend confirmation • ATR market volatility filt
FREE
Phase Analytics Pro: Advanced Cyclic Market Analyzer Phase Analytics Pro is a sophisticated technical tool designed for traders who prioritize mathematical precision over lag-heavy traditional indicators. Based on the principles of digital signal processing, this indicator decomposes price action into phase and quadrature components to identify the dominant market cycle. How it works: The algorithm calculates the instantaneous phase of the market, allowing it to distinguish between trending and
Price Magnets
Ivan Simonika
Price Magnet — Price Density and Attraction Levels Indicator Price Magnet is a professional analytical tool designed to identify key support and resistance levels based on statistical Price Density. The indicator analyzes a specified historical period and detects price levels where the market spent the most time. These zones act as “magnets,” attracting price action or forming a structural base for potential reversals. Unlike traditional Volume Profile tools, Price Magnet focuses on price-time d
TWO PAIRS SQUARE HEDGE METER INDICATOR Try this brilliant 2 pairs square indicator It draws a square wave of the relation between your two inputs symbols when square wave indicates -1 then it is very great opportunity to SELL pair1 and BUY Pair2 when square wave indicates +1 then it is very great opportunity to BUY pair1 and SELL Pair2 the inputs are : 2 pairs of symbols         then index value : i use 20 for M30 charts ( you can try other values : 40/50 for M15 , : 30 for M30 , : 10 for H1 ,
Spread and Close MT4
Alexander Denisovich Jegorov
Spread & Candle Close Timer Indicator for MT4  Optimize your trading with this lightweight and efficient indicator, designed to display the real-time spread and candle close countdown directly on your MT4 chart. Features: Live Spread Monitoring – Instantly see market conditions. Candle Close Timer – Stay prepared for the next price movement. Simple & Non-Intrusive Design – No unnecessary settings, just clear and accurate data. Ideal for scalpers, day traders, and those who need real-time exec
Blahtech Supply Demand
Blahtech Limited
4.58 (36)
Was: $299  Now: $99   Supply Demand uses previous price action to identify potential imbalances between buyers and sellers. The key is to identify the better odds zones, not just the untouched ones. Blahtech Supply Demand indicator delivers functionality previously unavailable on any trading platform. This 4-in-1 indicator not only highlights the higher probability zones using a multi-criteria strength engine, but also combines it with multi-timeframe trend analysis, previously confirmed swings
Candle Pattern Finder Candle Pattern Finder is a powerful MT4 indicator designed to help traders easily detect key candlestick patterns in real-time. Whether you're trading trends, reversals, or consolidations, this tool highlights important price action signals directly on the chart — helping you make faster and more confident trading decisions. Detects popular candlestick patterns: Bullish/Bearish Engulfing Hammer & Inverted Hammer Shooting Star & Hanging Man Three White Soldiers Three Black
FREE
Easy Trade indicator
Felipe Carvalho De Queiroz
Easy Trade Indicator – Your Path to Profitable Trades! Work any Time Frame! Maximize your profits with precise and assertive trades! ️ Trade with comfort – the indicator does the analysis and you only open the order in the direction in which the indicator shows you!  Exclusive panel with past trade counter and accuracy tracking! Simplify your analysis, boost your performance, and trade with confidence! Get it now and take your trading to the next level
Alpha Trend sign Alpha Trend sign 是我么长期以来非常受欢迎的交易工具,它可以验证我们的交易系统,并且明确的提示交易信号,并且信号不会漂移。 主要功能: •  根据市场显示活跃区域,根据指标可以很直观的判断当前行情是属于趋势行情,还是震荡行情。    并根据指标的指示箭头切入市场,绿色箭头提示买入,红色箭头提示卖出。 •  建议使用5分钟以上的时间周期进行交易,避免因为小周期波动出现频繁的交易信号。 •  您也可以开启信号提示,以免错过最佳的交易时机。 •  本指标不但可以很好的预测趋势行情,也可以在宽幅震荡行情中获利。 •  本指标本着大道至简的原则,适合不同阶段的交易者使用。 注意事项: •  Alpha Trend sign 有明确的进出场信号,不建议逆势操作,以免造成损失。 •  Alpha Trend sign 是特别成熟的指标,我们团队人手一个,使用它可以实现稳定盈利。     
加密货币外汇指标“MFI 横盘探测器”是一款高效的交易辅助工具!无重绘。 我推荐您使用这款适用于 MT4 的出色指标来升级您的交易方法。 - 该指标会在图表上显示价格横盘区域。它具有“横盘灵敏度”参数,用于检测横盘区域。 - “MFI 横盘探测器”对于背离检测非常有用,并且与价格行为指标结合使用效果更佳。 - 您可以将其用于趋势跟踪系统,以检测横盘区域并避免在这些区域进行交易。 - 您可以将其用于反转剥头皮交易,以在横盘边界处进行反转交易。 - “MFI 横盘探测器”有很多可以替代标准 MFI 震荡指标的机会。 - 资金流量指数 (MFI) 本身是一个技术震荡指标,它使用价格和成交量数据来识别超卖和超买区域。 - 当 MFI 高于 80 时,超买区域是理想的卖出入场点;当 MFI 低于 20 时,超卖区域是理想的买入入场点。 点击这里查看高质量的交易机器人和指标! 这是仅在 MQL5 网站上提供的原创产品。
Super Reversal Pattern
Parfait Mujinga Ndalika
Super Reversal Pattern Indicator Unlock the power of advanced pattern recognition with our Super Reversal Pattern Indicator. Designed for traders seeking precision and reliability, this indicator identifies one of the most effective reversal patterns in technical analysis, offering a significant edge in your trading strategy. Key Features: Non-Repainting Accuracy: Enjoy the confidence of non-repainting technology. Once a Super Reversal Pattern is detected, it remains static, providing consiste
Volume Compair
Thiago Pereira Pinho
5 (1)
专业累计德尔塔与成交量中位线指标 通过这款强大的成交量分析工具,追踪 真实的买卖压力 。 成交量比较指标 (Volume Compare Indicator) 结合了 累计德尔塔 (Cumulative Delta) 和 成交量中位线 (Volume Medians) ,帮助您识别机构活动、失衡以及潜在的反转。  主要特点:  累计德尔塔直方图 – 实时可视化净买入成交量与净卖出成交量。  买入/卖出成交量中位线 – 显示平均买入和卖出成交量水平的水平线。  智能成交量分类 – 分隔: 强劲买入(绿色) – 看涨压力。 强劲卖出(红色) – 看跌压力。 买入成交量中位线(蓝色线) – 典型买入量的参考。 卖出成交量中位线(橙色线) – 典型卖出量的参考。  可自定义参数 – 调整 CDIPeriod 和 CDIRange 以设置敏感度。  EMA 平滑成交量 – 减少噪音,使信号更清晰。  如何帮助交易者: 发现机构活动 – 异常的成交量尖峰指示大玩家进场。 确认突破/反转 – 强烈的德尔塔背离警告假动作。 基于成交量的支撑/阻力 – 中位线充当动态参考水平。 日内交
该产品的买家也购买
Trend SniperX MT4
Sarvarbek Abduvoxobov
5 (5)
Trend Sniper X 是一款用于 MetaTrader 5 的多周期趋势追踪指标,旨在帮助交易者清晰、精准地识别趋势方向及潜在的反转点。 适用于 MT5: https://www.mql5.com/en/market/product/181101 价格信息: 当前价格为促销价,随着后续更新和新功能的推出,价格可能会发生变动。 Code2Profit 频道 通过多周期分析掌控市场! 如何使用 Trend Sniper X 最大化胜率:关键规则与交易时段技巧 技术规格 交易平台 MetaTrader 5 指标类型 多周期趋势指标 运行时间周期 任意图表周期,支持独立选择更高周期(M1–MN1) 主要交易品种 外汇、黄金 (XAUUSD) 及其他 CFD 差价合约 推荐账户 任何账户类型 可视化呈现 彩色趋势 K 线(买入/卖出/弱势/转变)+ 买入/卖出信号箭头 附加模块 市场交易时段框(悉尼、东京、伦敦、纽约) 核心功能 多周期趋势分析: 将更高周期的趋势方向直接投影到当前图表上,提供清晰的宏观视角。 弱势/不确定 K 线检测: 高亮显示趋势状况不明确的 K 线,帮助交易者远离震
Zoryk Gold mt4
Reda El Koutbane
5 (2)
折扣将在 24 小时后结束——下一价格为 69 美元 联系我获取推荐设置 首发名额有限 ZORYK — MetaTrader 4 专业 XAUUSD 黄金信号与交易计划系统 你一定经历过这种感觉。 你花时间分析黄金,等待入场,终于打开交易后,价格却立即向相反方向移动。你过早平仓,移动止损,或者因为犹豫几秒而错过机会。随后市场在没有你的情况下,准确到达你最初预期的目标。 问题并不总是方向错误。 真正的问题是不确定性。 你不知道真正的入场位置在哪里,不知道交易逻辑在什么位置失效,也不知道应该先保护较小的利润,还是继续等待更大的行情。你甚至不知道当前信号是否足够强,还是自己只是在勉强寻找一笔交易。 黄金移动速度非常快。没有明确计划的正确判断,也可能在几秒钟内变成错误决定。 ZORYK 正是为了解决这个问题而开发。 什么是 ZORYK ZORYK 是一套专门为 MetaTrader 4 和 XAUUSD M5 周期开发的完整黄金信号与交易计划系统。 它不是一个只显示 BUY 或 SELL 箭头,然后让你独自处理所有后续决定的普通指标。 每个确认信号都可以在图表上显示
Tokyo mt4 Indicator
Vasiliy Strukov
5 (2)
Tokyo Indicator(东京指标)直观地展示了趋势方向、潜在交易信号及市场状况。 其采用颜色编码的阶梯式趋势线,以蓝色标识看涨阶段,以洋红色标识看跌阶段。配套的方向箭头会在趋势发生变化时,标示出潜在的买入与卖出机会。 内置的综合仪表盘将当前信号、市场倾向、动能、波动率及信号质量整合于同一视图中,方便交易者在观察价格走势的同时评估指标数据,无需在不同面板间切换。 凭借清晰的图表显示和简洁的市场概览,Tokyo Indicator 支持以系统化的方式进行趋势分析与交易确认。 适用于任何时间周期及各类交易品种,尤其适合黄金交易。 购买后请立即联系我,以获取专属赠品!您可以免费获得我们的“强力支撑与趋势扫描”(Strong Support and Trend Scanner)指标,请私信我! 设置说明与使用手册请见此处。 请注意:我不会在 Telegram 上出售我的 EA 或特殊参数设置(set files);我的 EA 仅在 Mql5 平台上提供,而参数设置文件仅在我的博客(此处链接)上发布。请务必警惕诈骗,切勿从他人处购买任何参数设置! 设置 ShowHUD —— 在图表上显示
M1 Sniper
Oleg Rodin
4.97 (30)
M1 SNIPER 是一款易于使用的交易指标系统。它是一个专为 M1 时间框架设计的箭头指标。该指标可以作为独立的系统在 M1 时间框架下进行剥头皮交易,也可以作为您现有交易系统的一部分使用。虽然该交易系统专为 M1 时间框架交易而设计,但它也可以用于其他时间框架。我最初设计此方法是为了交易 XAUUSD 和 BTCUSD。但我发现这种方法在其他市场交易中也同样有用。 指标信号既可以顺势交易,也可以逆势交易。我教授一种特殊的交易技巧,帮助您利用指标信号进行双向交易。该方法基于使用特殊的动态支撑位和阻力位区域。 购买后,您可以立即下载 M1 SNIPER 箭头指标。此外,我还为所有 M1 SNIPER 工具用户免费提供下方屏幕截图所示的 Apollo Dynamic SR 指标!这两个指标的组合可以帮助您更轻松、更准确地利用 M1 时间框架进行交易。 购买后请联系我,免费获取交易提示和奖励指标! 祝您交易成功!
SR Liquidity
Oleg Rodin
5 (2)
SR Liquidity 是一款旨在揭示市场流动性高度集中且价格反应最剧烈的隐蔽区域的交易指标。这些特殊的流动性区域充当着强有力的支撑位与阻力位,为您清晰呈现市场最可能发生反转的位置。 SR Liquidity 指标并非简单地绘制常规的支撑/阻力线,而是通过分析实际的价格行为,识别买卖压力积聚的区域。这些区域实际上是推动市场真实波动的流动性池。通过在图表上直观呈现这些区域,该指标能助您在价格反应发生前预判走势——这意味着它实际上能够预测价格方向可能发生的变化。它将原始的价格行为转化为清晰且具实操价值的市场蓝图,标示出那些可能成为市场转折点的关键价位。 该指标适用于任何交易品种和时间周期——包括外汇、指数、金属、加密货币等。支持任意时间周期。 购买后请联系我,以获取交易指南及免费赠送的优质附加指标!
Top Bottom Tracker MT4
Rodrigo Arana Garcia
Top Bottom Tracker 是一款基于复杂算法的指标,可分析市场趋势并检测趋势的高点和低点 / MT5 版本。 价格将逐步上升,直至达到 500 美元。下一个价格 --> $99 功能特点 无重绘 新数据到来时 该指标不会改变其数值 交易货币对 所有外汇货币对 时间框架 所有时间框架 参数 ==== 指标配置 ==== 配置参数 // 40(值越高,发出的信号越少但越准确) 上水平值 // 80(上水平线的值) 下水平线值 // 20(下水平线值) 指标计算条数 // 3000(您希望指标计算多少条。数值 0 将计算所有条形图的指标) ==== 警报配置 ==== 弹出警报 // true (在终端上发出警报) 电子邮件报警 // true (通过电子邮件报警) 警报时间间隔 // 10 (警报时间间隔,以分钟为单位) 警告 我只在 MQL5.com 上销售我的产品。如果有人联系您向您推销我的产品,那么他们就是骗子,只想要您的钱。 此外,如果您从外部网站购买我的产品,我向您保证,这些产品都是假冒版本,与正版产品效果不同。
Smart Trend Trading System
Issam Kassas
4.8 (10)
Smart Trend Trading System 是适用于 MetaTrader 4 的图表指标,将趋势信息、入场和出场信号以及价格水平集中呈现在同一图表上。 它将 10 多种交易工具 整合到一个系统中,包括趋势检测、反转区域、Smart Cloud、移动止损逻辑、支撑与阻力、K线着色、提醒以及多周期分析。 该系统旨在帮助您应对不同的市场环境: 趋势市场: 识别主要趋势,发现回调,跟随动能,并通过止损指导和移动止损选项寻找更清晰的入场机会。 震荡市场: 识别区间震荡状态,寻找价格反应区域,并在价格触及重要水平时获得更清晰的信号。 剥头皮和日内交易: 使用快速信号、K线颜色、提醒和多周期确认,辅助短线交易决策。 主要功能: • 10 多个指标整合为一个交易系统 • 7 多种策略和信号组合 • 趋势跟随、反转、剥头皮、日内交易和波段交易模式 • 入场和出场箭头 • Smart Cloud • Smart Reversal Zones • 支撑和阻力水平 • Smart Trailing Stop • 多周期趋势分析 • 成交量、趋势和反转K线着色 • 手机、电子邮件和终端提醒 •
Miraculous Indicator Binary & Forex v3 StrategySafe Miraculous Indicator Binary & Forex v3 StrategySafe 是一款专业交易指标,适合希望获得清晰信号、强大确认工具以及结构化交易方式的 Binary 和 Forex 交易者。 v3 版本加入了 MIR Dashboard、Miraculous Confirmation Dashboard、GANN Law、Square of 9 水平线、GANN 角度以及更强的 Forex 分析模式。 核心功能 同时支持 Binary 和 Forex 交易模式。 MIR Dashboard 可快速读取市场状态。 Miraculous Confirmation Dashboard 用于确认交易机会。 GANN Law drawing lines 用于 Forex 市场结构分析。 Square of 9 线条、方向和关键价格水平。 1x1 GANN Angle 用于判断趋势压力。 Entry Information TP 帮助寻找合理止盈区域。 Strateg
PRO Renko System
Oleg Rodin
5 (31)
PRO Renko Arrow Based System for trading renko charts.  准确的信号交易任何外汇工具. 另外,我将免费提供系统的附加模块! PRO Renko系统是RENKO图表上高度准确的交易系统。该系统是通用的。 该交易系统可应用于各种交易工具。 该系统有效地中和了所谓的市场噪音,打开了获得准确反转信号的通道。 该指标易于使用,只有一个参数负责产生信号。 您可以很容易地使算法适应您感兴趣的交易工具和renko酒吧的大小。 我很乐意通过提供任何咨询支持来帮助所有客户有效地使用该指标。 祝您交易成功!购买后,立即写信给我! 我将与您分享我的建议和我的renko发电机。 另外,我将免费提供系统的附加模块!
Liquidity Scalper System
Stanislav Konin
5 (1)
Liquidity Scalper System: 基于流动性的指标形式交易系统。 大多数指标只显示一个箭头,止损放在哪里、目标在哪里、信号是否可信,都要交易者自己判断。Liquidity Scalper System 覆盖完整的交易周期:寻找流动性池,在其被突破时给出信号,立即计算 Entry、Stop Loss 和三个目标,并在面板上显示统计数据以及新数据上的验证结果。系统自行选择设置,并每天更新。 工作原理 1. 系统寻找流动性池:市场参与者止损单聚集的价位。 2. 当价格突破流动性池,且突破经由动能(必要时还经由成交量)确认后,图表上出现 BUY 或 SELL 箭头。 3. 立即绘制 Entry、Stop Loss、TP1、TP2 和 TP3 水平,并填充区域。 4. 右侧构建流动性分布图:可以看到价格上方和下方大成交量集中的位置。 与众不同之处 • 自动优化取代手动调参。 系统在历史数据上测试 32 种设置组合,为当前品种和周期选出最佳组合。优化目标可选:Win Rate、净利润或盈利因子。 • 新数据验证。 设置在一部分历史上训练,并在优化器未见过的更新数据上检验(out
Gann Made Easy
Oleg Rodin
4.84 (172)
Gann Made Easy 是一个专业且易于使用的外汇交易系统,它基于使用先生理论的最佳交易原则。 W.D.江恩。该指标提供准确的买入和卖出信号,包括止损和获利水平。您甚至可以使用推送通知在旅途中进行交易。 购买后请联系我,即可免费获得交易指导和超棒的额外指标! 您可能已经多次听说过江恩交易方法。通常 Gann 的理论不仅对于新手交易者而且对于那些已经有一定交易经验的人来说都是非常复杂的东西。这是因为江恩的交易方法在理论上并不那么容易应用。我花了几年时间来完善这些知识,并将最好的原则应用到我的外汇指标中。 该指标非常易于应用。您所需要的只是将其附加到您的图表并遵循简单的交易建议。该指标不断进行市场分析工作并寻找交易机会。当它检测到一个好的入口点时,它会为您提供一个箭头信号。该指标还显示止损和获利水平。 换句话说,当您像先生一样进行交易时,该指标会为您提供最佳江恩建议。江恩亲自告诉你此时此刻该做什么。但最好的部分是您不需要了解任何有关江恩交易原则的知识,因为该指标会为您完成整个市场分析工作。
Atomic Analyst
Issam Kassas
5 (13)
Atomic Analyst — MetaTrader 4 如有产品、设置或技术支持方面的问题,请直接在 MQL5 上给我发消息。 该指标将复杂的市场计算转换为简单的视觉信号、彩色K线、趋势读数、止损水平和多个止盈区域,使交易者能够快速理解并应用于真实市场环境。 主要交易用途: 剥头皮和日内交易: 专为快速决策、清晰箭头、提醒、K线颜色和结构化进出场区域而设计。 日内交易和波段交易: 帮助交易者利用趋势方向、强度、动能和多周期分析跟随更大的市场波动。 主要功能: • 价格行为、强度和动能分析 • 多周期趋势扫描器 • 总体趋势百分比计算 • 买入和卖出箭头 • 止损和多个止盈水平 • 最多 5 个基于斐波那契的止盈水平 • 移动止损逻辑 • 用于趋势和动能的彩色K线 • 实时提醒到终端、手机和电子邮件 • 现代化用户友好面板 • 实时交易监控 • 买入和卖出潜力显示 • 总交易数量显示 • 每日、每周和总利润显示 • 每日佣金计算 • Bid、Ask 和点差显示 • K线计时器、本地时间和服务器时间 • 终端连接状态 • 账户货币显示 • 可直接从面板控制时间周期 • 可手动使用,
This is a professional chart indicator designed for traders focused on stability and clear price action. It helps filter market noise and provides clear visual entry and exit zones for your trading decisions. Core Features: Strictly Non-Repainting: The system is built with strict non-repaint logic. What you see on the chart is the true historical performance. Confirmed Signals: Signals are triggered and confirmed only after the candle closes . Once a trading arrow appears on a closed candle, it
Scalper Vault
Oleg Rodin
5 (39)
Scalper Vault 是一个专业的剥头皮系统,为您提供成功剥头皮所需的一切。该指标是一个完整的交易系统,可供外汇和二元期权交易者使用。推荐的时间范围是 M5。 该系统为您提供趋势方向的准确箭头信号。它还为您提供顶部和底部信号以及江恩市场水平。无论您拥有何种交易经验,该系统都易于使用。您只需要遵循简单的规则并每天重复该过程。 建议将此系统用于主要货币对。感谢您的关注! 请注意,该指标在策略测试器中可能无法正常工作。因此,我建议仅在模拟或真实账户的真实交易条件下使用该系统。 指示器提供所有类型的警报,包括推送通知。 购买指标后请与我联系。我将免费与您分享我的个人交易建议和出色的奖励指标! 祝您交易愉快,盈利!
CRT Candle Range Theory HTF MT4 - Ultimate CRT Indicator: 高级ICT概念与马来西亚SnR交易系统 使用最先进的 Candle Range Theory 指标掌握做市商的足迹。释放 Smart Money Concepts (SMC) 的真正力量,并使用 Ultimate CRT Indicator 像机构一样精确交易。该指标专为严肃的交易者打造,自动化了高效的蜡烛范围理论 (CRT)——ICT概念 (Inner Circle Trader) 的核心支柱,并通过马来西亚支撑与阻力 (SnR) 入场方法和 FVG (不平衡) 区域的致命精度对其进行了强化。 无论您是在 MT4 或 MT5 上交易外汇、加密货币还是指数,该算法都能消除市场噪音,过滤虚假突破,并将高概率、高回报的交易区域直接传送到您的图表上。 CRT Indicator 的核心功能: Absolute Extreme SnR Entry Engine: 与依赖滞后吞没形态的传统指标不同,我们的系统采用了马来西亚 SnR 技术。它在严格的时间窗口内扫描绝对最高的 Buy-
Introduction to Fractal Pattern Scanner Fractal Indicator refers to the technical indicator that makes use of the fractal geometry found in the financial market. Fractal Pattern Scanner is the advanced Fractal Indicator that brings the latest trading technology after the extensive research and development work in the fractal geometry in the financial market. The most important feature in Fractal Pattern Scanner is the ability to measure the turning point probability as well as the trend probabi
成交量突破震荡指标是一种以震荡指标的形式将价格变动与成交量趋势相匹配的指标。 我想将成交量分析整合到我的策略中,但大多数成交量指标都令我失望, 例如 OBV、资金流量指数、A/D,还有成交量加权 Macd 和许多其他指标。 因此,我为自己编写了这个指标,我对它的实用性感到满意,因此我决定将其发布到市场上。 主要特点: 它突出显示了价格在成交量增加(突破)支持下朝某个方向移动的阶段。 它突出显示了成交量增加停止并因此市场收缩的阶段。 它突出显示了价格和成交量均未移动的阶段,尤其是在时间范围(<=15 分钟)的日内交易中,因此市场已为未来的运行做好准备。 当其他 EA 交易程序发出的虚假信号不受交易量增加的支持时,可过滤掉这些信号。 它使趋势和范围阶段可视化变得非常容易 输入参数: 计算设置: 计算类型:快速、正常、慢速,用于监控短期、中期和长期,保持在同一时间范围内。 计算周期:计算周期 交易量设置: 交易量类型:TickVolume(主要用于外汇)和RealVolume(用于股票市场) 信号设置: 信号周期:信号线周期 突破水平:突破信号的阈值水平 警报设置 警报类型:收盘
PZ Divergence Trading
PZ TRADING SLU
5 (2)
棘手的发现和频率稀缺是最可靠的交易方案之一。该指标使用您喜欢的振荡器自动查找并扫描常规和隐藏的发散。 [ 安装指南 | 更新指南 | 故障排除 | 常见问题 | 所有产品 ] 容易交易 发现常规和隐藏的分歧 支持许多知名的振荡器 根据突破实现交易信号 显示适当的止损和获利水平 可配置的振荡器参数 可自定义的颜色和尺寸 按条形过滤大小差异 实现绩效统计 它实现了电子邮件/声音/视觉警报 为了提供广阔的市场前景,可以使用不同的振荡器在同一张图表中多次加载该指标,而不会产生干扰。该指标支持以下振荡器: RSI CCI MACD OSMA 随机 动量 很棒的振荡器 加速器振荡器 威廉姆斯百分比范围 相对活力指数 由于差异可能会扩大很多,尤其是在外汇市场中,因此该指标产生了转折:它在等待交易突破之前等待donchian突破确认差异。最终结果是带有非常可靠的交易信号的重新粉刷指示器。 输入参数 幅度:用于寻找差异的之字形周期 振荡器-选择要加载到图表的振荡器。 突破期-交易信号的突破期,以柱为单位。 发散类型-启用或禁用发散类型:隐藏,常规或两者。 最小散度单位为条形-最小散度单位为条形
Advanced Supply Demand
Bernhard Schweigert
4.91 (302)
现在优惠 30%! 任何新手或专业交易者的最佳解决方案! 该指标是一款独特、高质量、且价格合理的交易工具,因为我们已经整合了许多专有功能和新公式。 依据此更新,您将能够显示双重时间帧区域。 您不仅可以显示一个较高的时间帧,还可以同时显示图表时间帧,加上更高的时间帧:显示嵌套时区。 供需双方所有交易者都会喜欢它。 :) 重要信息披露 高级供需的最大潜力,请访问 https://www.mql5.com/zh/blogs/post/720245   想象您的交易如何得以改善,是因为您能够精准定位入场或目标位吗? 构建于新的底层算法,它可以更轻松地识别出买卖双方之间的潜在失衡。 这是因为它以图形方式展示供需最强劲区域,及其过去的表现(显示旧区域)。 这些功能旨在帮助您更轻松地发现最佳入场区域和价位。 现在您可以针对您的交易品种和时间帧来优化和编辑区域强度! 高级供需指标适用于所有产品和时间帧。 它是一个新的公式,非常新的功能是两个区域强度函数可由用户输入进行调整! 这在交易中是一大优势。 当您学习如何使用专有功能,例如带有价格游离最小 X 因子的区域强度时,您能够判断该区域强劲与否。 供需
Trend Catcher ind
Ramil Minniakhmetov
5 (11)
趨勢捕捉指標 趨勢捕捉指標結合了作者獨有的客製化自適應趨勢分析指標,用於分析市場價格趨勢。它透過過濾掉短期噪音,並專注於潛在的動能強度、波動性擴張和價格結構行為,來識別真實的市場方向。此外,它還結合了平滑和趨勢過濾等客製化指標,例如移動平均線、相對強弱指標 (RSI) 和波動率過濾器。 您可以在這裡查看實際運行情況以及我的其他產品: https://www.mql5.com/en/users/mechanic/seller 請注意,我不會在 Telegram 上出售 EA 或任何設置,那是騙局。所有設定都可以在我的部落格上免費取得。 重要提示!購買後請立即聯繫我,以獲取使用說明和額外獎勵! 請注意,我不會在 Telegram 上出售 EA 或任何設置,那是騙局。所有設定都可以在我的部落格上免費取得。
The Super Arrow Indicator provides non-repainting buy and sell signals with exceptional accuracy. Key Features No repainting – confirmed signals remain fixed Clear visual arrows: green for buy, red for sell Real-time alerts via pop-up, sound, and optional email Clean chart view with no unnecessary clutter Works on all markets: Forex, gold, oil, indices, crypto Adjustable Parameters TimeFrame Default: "current time frame" Function: Sets the time frame for indicator calculation Options: Can be set
Apollo SR Master
Oleg Rodin
5 (3)
Apollo SR Master 是一款支撑/阻力指标,其特殊功能使利用支撑/阻力区域进行交易更加便捷可靠。该指标通过检测局部价格顶部和底部,实时计算支撑/阻力区域,没有任何时间延迟。为了确认新形成的支撑/阻力区域,该指标会显示特殊信号,表明该支撑/阻力区域可以作为实际的卖出或买入信号。在这种情况下,支撑/阻力区域的强度会增强,因此从该区域进行交易的成功率也会更高。这正是该指标的核心理念。 SR区域也使止损和止盈的操作更加便捷。根据信号方向,可以将SR区域上方或下方的空间用作止损位。此外,相对的SR区域也可以用作潜在的止盈区域。 我还免费向所有 Apollo SR Master 指标的用户提供我的“Apollo 价格行为系统”指标。这两个指标结合使用将帮助您找到更好的入场点。 购买后请联系我,即可免费获得交易指导和超棒的额外指标!
Advanced Currency Strength28 Indicator
Bernhard Schweigert
4.91 (659)
目前40%的折扣 任何新手或专家交易者的最佳解决方案! 这个指标是一个独特的、高质量的、可负担得起的交易工具,因为我们纳入了一些专有的功能和一个新的公式。只需一个图表,你就可以读出28个外汇对的货币强度!想象一下,你的交易将如何得到改善,因为你的交易是在你的手中进行的。想象一下,你的交易将如何改善,因为你能够准确地确定新趋势或剥头皮机会的触发点? 用户手册:点击这里  https://www.mql5.com/en/blogs/post/697384 这是第一本,原版的! 不要买一个毫无价值的崇拜者的克隆品。 特别的 子窗口中的箭头显示强劲的货币势头GAP将指导你的交易! 当基础货币或报价货币处于超卖/超买区域(外盘斐波那契水平)时,在个人图表的主窗口中出现警告信号。 当货币力量从外围区间回落时,回撤/反转警报。 十字星模式的特别警报 可选择多个时间框架,以快速查看趋势! 货币强度线在所有的时间框架中都非常平稳,当使用较高的时间框架来识别总体趋势,然后使用较短的时间框架来确定精确的入口时,效果非常好。你可以根据自己的意愿选择任何时间框架。每个时间框架都由其自身进行了优化。
KURAMA GOLD SIGNAL PRO(MT4)— 7层过滤 · 自动止盈止损 · 质量评分 · 信号历史保存 | 完整的XAUUSD交易系统 实时不重绘。信号出现的瞬间,箭头、入场、止盈、止损当场锁定,之后绝不移动。你交易的就是这个实时信号。而且在v7.20中,每一个真正发出的信号都会自动保存,并在重启后精确还原。 购买者专属赠品 购买永久授权,即可免费获得 AI Zone Radar(价值$59)+ 完整PDF手册。在产品价格之外,额外附赠价值$59的赠品。购买后在MQL5上给我留言即可。 AI Zone Radar: https://www.mql5.com/en/market/product/175834 在黄金交易者社区中被实际使用,因精度与易用性而广受好评。 你的难题 —— 以及解决方案 黄金一天波动$30–$50。你知道机会就在那里。但这些情况是否似曾相识: - 入场太早,价格逆行$10后才朝你的方
DayTrader PRO MT4
Davit Beridze
4.6 (10)
DayTrader PRO MT5:  https://www.mql5.com/en/market/product/186222 DayTrader PRO 是一款先进的交易指标,它结合了约翰·埃勒斯 (John Ehlers) 的 Laguerre 滤波器与强大的自动优化引擎。该指标不依赖固定的参数,而是根据最新的市场状况自动搜寻最佳设置,帮助您在无需手动调整的情况下适应不断变化的市场波动。 该指标可生成清晰的买入 (BUY) 和卖出 (SELL) 信号,并提供根据当前市场波动率计算得出的自适应止损 (Stop Loss) 和止盈 (Take Profit) 水平。内置的趋势、效率系数 (Efficiency Ratio)、波动率和蜡烛图过滤功能,有助于剔除低质量的交易设置,从而提高信号的准确性。 实时性能面板会显示当前已优化的设置、利润因子 (Profit Factor)、胜率 (Win Rate)、回撤 (Drawdown) 以及其他交易统计数据。DayTrader PRO 还支持弹出窗口、推送、邮件和声音提醒,确保您不会错过任何交易机会。 主要功能 全自动参数优化 自适应买入
Forex Breath System
Oleg Rodin
5 (5)
Forex Breath System 它是一个基于趋势的交易系统,可用于任何市场。您可以将此系统用于货币、金属、商品、指数、加密货币甚至股票。它也可以在任何时间范围内使用。该系统是通用的。它显示趋势并提供趋势箭头信号。当信号出现在趋势方向时,该指标还可以为您提供特殊类型的警报,从而使趋势交易成为一项简单的任务。 该指标非常易于使用,因为它根本不需要处理任何难以理解的设置。 您只需将其附加到图表中即可开始交易。无论您喜欢哪种交易风格,系统都会帮助您了解市场的方向以及趋势方向上可能的入场点。 该系统将对所有交易者有所帮助,无论他们的交易经验水平如何。 该指示器提供所有类型的警报,包括推送通知。 购买后请联系我以获得交易说明和丰厚奖金! 祝您交易愉快、盈利!
Prop Firm Sniper
Mohamed Hassan
4.33 (6)
Prop Firm Sniper MT4  is a professional market structure indicator that automatically identifies high-probability BUY and SELL opportunities using BOS and CHoCH analysis. Recommended Timeframes: For backtesting, use the indicator on   M5 or M15   for Gold (XAUUSD), and   M15 or H1   for more volatile Forex pairs such as   GBPUSD, USDJPY, EURGBP , and similar markets. CONTACT ME AFTER PURCHASE TO CLAIM YOUR FREE BONUSES! Prop Firm Sniper  is a professional market structure indicator designed t
“动态剥头皮震荡指标”是一款高级自定义加密货币外汇指标,适用于 MT4 平台,高效交易! ............................................................................................................ - 新一代震荡指标 - 参见图片了解如何使用。 - 动态剥头皮震荡指标具有自适应超卖/超买区域。 - 震荡指标是一款辅助工具,可从动态超卖/超买区域找到准确的入场点。 - 超卖值:低于绿线,超买值:高于橙线。 - 该指标也非常适合与价格行为模式结合使用。 - 它比标准震荡指标更精准。 - 提供 PC 和移动端警报。 ................................................... 点击这里查看高质量的交易机器人和指标! 本产品为原创,仅在 MQL5 网站上提供。
Scalping Points Pro
Andrey Kozak
5 (3)
Scalping Points Pro 是一種在圖表上顯示可能的價格反轉點且不會重新繪製其信號的指標。此外,指標通過電子郵件和推送向交易者發送信號。該指標信號的準確度在 M5 時間框架上約為 92-94%,在 H1 時間框架上超過 95%。因此,該指標允許交易者準確地打開交易並預測進一步的價格走勢。 該指標不會重新繪製其信號。 該指標適用於從 M1 到 D1 的時間範圍。 每個購買指標並撰寫評論的人都將收到我們贈送的用於自動交易的機器人。 使用該指標,您可以為外匯交易構建有效的交易系統,也可以將其集成到機器人中。 指標設置: Period_Ma_Short - 短移動週期。 Period_Ma_Long - 長移動週期。 signal - 向電子郵件和推送發送通知。
PZ Wedges
PZ TRADING SLU
3 (2)
该指标找到 楔形 ,它们是通过围绕价格合并期的趋同趋势线确定的延续模式。它使用donchian突破与形态突破一起发出交易信号。 [ 安装指南 | 更新指南 | 故障排除 | 常见问题 | 所有产品 ] 易于使用 可自定义的颜色和尺寸 它实现突破信号 它实现了各种警报 最佳用法 要查看可能重叠的所有大小的楔形,请在图表上多次加载具有不同大小的指标,例如6、12、18和24。 输入参数 大小:要找到的图案的大小,用替代点之间的条形表示 突破期:唐契安期指示交易 最大。历史柱线:图表中要检查的过去柱线的数量 看涨形态的颜色:此参数不言自明 空头形态的颜色:此参数不言自明 不间断图案的颜色:此参数不言自明 线宽:图案线的大小 看涨突破的颜色:这是买入箭头的颜色 看跌突破的颜色:这是卖出箭头的颜色 箭头大小:这是图表中显示的箭头的大小 自定义警报名称:此图表中引发的警报的自定义标题 显示警报:启用或禁用屏幕警报 电子邮件警报:启用或禁用邮件警报。 推送警报:启用或禁用推送警报。 声音警报:启用或禁用声音警报。 声音文件:出现屏幕警报时播放的声音文件。 作者 Arturo Lopez Pe
作者的更多信息
LiquiditySweep Pro EA
Qiyas Baghirov
5 (1)
LiquiditySweep Pro Market MT5 v1.3 版本 1.3 – 2026.04.25 LiquiditySweep Pro Market 是一款基于流动性扫荡(Liquidity Sweep / Stop Hunt)概念的专家顾问(EA),旨在检测近期高点和低点的价格扫荡,并在市场出现反转确认时执行交易。 核心策略 核心策略保持简单且高效: 检测价格突破近期高点或低点的流动性扫荡 通过K线收盘行为确认反转 应用可选的EMA趋势方向过滤 仅在选定的市场交易时段进行交易 通过止损(Stop Loss)、止盈(Take Profit)、保本(Break-Even)和移动止损(Trailing Stop)管理仓位 此版本在不改变原始策略核心逻辑的前提下,针对真实账户交易稳定性进行了优化。 核心交易逻辑 EA 使用可配置的回溯周期(lookback)监控市场结构。 卖出条件:价格突破近期高点后重新收于该水平下方 买入条件:价格突破近期低点后重新收于该水平上方 该方法基于一个理念:价格在反转之前,通常会先扫荡高点或低点附近的流动性。 交易方向模式 EA 提供灵活的
TrendLines Pro EA v1.1 – 专业黄金突破剥头皮系统 TrendLines Pro EA   是一款专为黄金市场 ( XAUUSD ) 设计的高级算法交易系统。它能自动识别机构级的趋势线,并在市场流动性高峰时段执行高概率的突破交易。  1.1 版本有哪些新功能? 与旧版本相比,v1.1 版本引入了关键的升级,以确保更好的性能和安全性: 验证保证金控制 (Validated Margin Control):   新增安全层,在每笔交易前检查账户的可用保证金,防止过度杠杆,符合专业交易标准。 增强型 MQL4 架构:   针对最新的 MT4 版本进行了代码重构,确保极速执行并与经纪商服务器协议 100% 兼容。 改进的手数正规化:   优化的交易量计算逻辑,自动适应经纪商特定的最小/最大手数要求及步长。 优化交易时段过滤器:   更新了伦敦和纽约时段的逻辑,以更好地应对市场波动并避开低流动性间隙。 精准价格处理:   升级了黄金的小数位数 (Digits) 处理能力,确保止损 (SL) 和止盈 (TP) 订单的放置极其精确。 核心策略逻辑 该 EA 实时分析价格行为,
Swing Highs Lows Candle Patterns Pro Swing Highs Lows Candle Patterns Pro is a professional price action indicator designed to identify important swing highs, swing lows and high-probability reversal candle patterns automatically. The indicator combines market structure analysis with candlestick confirmation to help traders locate potential BUY and SELL opportunities without cluttering the chart. Unlike ordinary swing indicators, it not only detects Higher Highs (HH), Higher Lows (HL), Lower Hi
SMC Reversing
Qiyas Baghirov
SMC Reversing v1.4 概述 (Overview) SMC Reversing 是一款基于 Smart Money Concepts(SMC)、流动性扫盘(liquidity sweep)检测以及反转交易逻辑开发的专家顾问(Expert Advisor)。 该 EA 通过监控近期的高点和低点来识别可能的止损扫盘(stop-hunt)行为。当价格突破流动性水平并重新收回至区间内时,系统会识别为潜在的反转机会并自动执行交易。 1.4 版本主要专注于执行稳定性、风险控制、经纪商兼容性以及针对真实市场环境的优化过滤系统。 版本 1.4 的改进内容 与 предыдущ版本相比,本次更新改进了多个重要方面: 在高点差条件下提供更好的控制 在低波动市场中改进过滤机制 为重要市场事件提供手动新闻过滤选项 提升订单执行的安全性 优化对经纪商止损距离(stop level)的处理 新增交易时段控制功能 提升对不同经纪商条件的兼容性 核心交易策略保持不变,但执行和过滤系统得到了优化。 核心交易逻辑 (Core Trading Logic) 该 EA 使用以下交易模型: 基于历史高点和低点识
Trend Finder Fractal PRO
Qiyas Baghirov
5 (1)
Fractal Strategy Pro NR MTF – 用户使用指南 1. 什么是这个指标? Fractal Strategy Pro NR MTF 是一款高级 MT4 指标,结合了趋势分析、分形逻辑、多时间框架(MTF)仪表盘、自动 Fibonacci,以及 Repaint / Non-Repaint 切换功能。 该指标可以显示: BUY / SELL 信号 M30 / H1 / H4 标记线 趋势线(Trendlines) 自动 Swing Fibonacci 水平 多时间框架趋势方向 2. 安装方法 打开 MetaTrader 4。 进入: File → Open Data Folder 打开文件夹: MQL4 → Indicators 将指标文件 ( Fractal_Strategy.ex4 ) 复制到该文件夹中。 重启 MT4 或刷新 Navigator 窗口。 从: Navigator → Indicators 将指标拖到图表上。 3. 基本使用方法 指标显示: 绿色/蓝色信号 = BUY 机会 红色信号 = SELL 机会 BUY Signal 当价格接近下方支撑/
FVG iFVG Smart Zones 是一款专业的 MetaTrader 4 指标,用于在图表上自动识别并显示 Fair Value Gap(FVG)和 Inverse Fair Value Gap(iFVG)区域。 该指标基于市场结构和价格失衡自动识别多头与空头失衡区域,并以清晰、专业的智能矩形区域实时显示在图表上,同时支持标签显示,提升图表分析体验。 主要功能: • 自动检测多头与空头 FVG 区域 • 可选显示 iFVG(已回补失衡)区域 • 支持收盘价或影线的智能 Mitigation 逻辑 • 支持区域向右延伸 • 轻量化与优化结构 • 专业清晰的图表视觉效果 • 完全可自定义颜色与参数 • 适用于剥头皮、日内交易及 Smart Money 交易策略 主要参数: • Lookback Bars — 用于检测区域的历史K线数量 • Show FVG — 显示 / 隐藏有效 Fair Value Gap 区域 • Show iFVG — 显示 / 隐藏已回补 / 反向 FVG 区域 • Close Mitigation — 使用收盘价确认 Mitigation • Wick
Smart Multi Timeframe Fractals – User Guide Overview Smart Multi Timeframe Fractals is a MetaTrader 4 indicator designed to show confirmed fractal signals directly on the chart. The indicator can display both current timeframe fractals and higher timeframe fractals such as M5, M15, M30, H1, H4 and D1. The main purpose of this indicator is to help traders identify important market turning points, support and resistance zones, and higher timeframe confirmation areas. Main Features Confirmed fracta
Swing Highs Lows Candle Patterns Pro Swing Highs Lows Candle Patterns Pro is a professional price action indicator designed to identify important swing highs, swing lows and high-probability reversal candle patterns automatically. The indicator combines market structure analysis with candlestick confirmation to help traders locate potential BUY and SELL opportunities without cluttering the chart. Unlike ordinary swing indicators, it not only detects Higher Highs (HH), Higher Lows (HL), Lower Hi
QB Institutional Bands NR QB Institutional Bands NR is a premium MetaTrader 4 (MT4) technical analysis indicator designed by Qiyas Baghirov to identify trends, volatility zones, and institutional market structures. It provides real-time, algorithmic trading visualizations across asset classes like Gold (XAUUSD), Forex, indices, and crypto markets. Key Technical Mechanisms Dual-Layer Volatility Tracking: Consists of Outer Gold Bands that outline exhaustion or profit-taking points, alongside Inne
1. 什么是 Liquidity Setup PRO V1? Liquidity Setup PRO V1 是一款基于 Smart Money Concept(SMC)理念开发的 MT4 指标,用于逐步识别和显示 liquidity sweep、stop hunt、BOS(结构突破)以及 CHOCH 信号。 该指标会自动分析市场价格行为,并在图表上显示完整的 BUY 和 SELL setup。 适用于: Smart Money 交易者 Liquidity Sweep 策略 BOS / CHOCH 交易 机构交易逻辑 日内交易与剥头皮交易 2. 主要功能 自动识别 BUY / SELL Setup BUY Setup 价格跌破 sell-side liquidity 确认 liquidity sweep 出现强势 bullish K线 BOS 确认 BUY 信号 SELL Setup 价格突破 buy-side liquidity 确认 stop hunt 出现强势 bearish rejection K线 CHOCH / BOS 确认 SELL 信号 3. Dashboard(信息面板
Heiken Ashi Trend is a MetaTrader 4 indicator designed to help traders identify trend direction using Heiken Ashi candle structure combined with trend-confirmation filters. The indicator displays bullish and bearish trend phases directly on the chart, helping traders follow market direction more clearly and avoid unnecessary noise during fast price movement. Main Features Heiken Ashi based trend visualization Smooth trend-following structure Optional EMA line display ADX, CCI and MACD confirmati

Nested Pivot Arrows NR Nested Pivot Arrows NR is a non-repaint MT4 and MT5 indicator that identifies nested pivot structures and highlights potential market turning points directly on the chart. The indicator automatically detects: • Short-Term Highs (STH) and Short-Term Lows (STL) • Medium-Term Highs (MTH) and Medium-Term Lows (MTL) • Long-Term Highs (LTH) and Long-Term Lows (LTL) • Buy and Sell signals based on confirmed nested pivot formations Features: Non-Repaint Logic MT4 & MT5 Version
QB Compass Signal Pro QB Compass Signal Pro is an advanced predictive market direction indicator for MetaTrader 4. It transforms multiple technical factors into a visual compass that helps traders identify potential BUY, SELL, EXTREME BUY, and EXTREME SELL zones before traditional trend-following indicators react. Unlike conventional indicators that only follow price, QB Compass Signal Pro combines momentum, volatility expansion, EMA angle analysis, RSI slope, fractal breakouts, and market struc
Gold Market DNA Pro Gold Market DNA Pro is an innovative trading indicator designed with an original mathematical approach instead of relying on traditional technical indicators. Unlike conventional indicators based on moving averages, RSI, MACD, ATR, Fibonacci, or ZigZag, Gold Market DNA Pro analyzes the market through its own proprietary Market DNA Engine. Key Features - Original Market DNA calculation engine - No Moving Averages - No RSI - No MACD - No ATR - No Fibonacci - No ZigZag - No
Overview EMA Cross Pullback Pro is a professional non-repaint trend-following indicator designed for traders who use EMA crossovers and pullback entries. It combines fast and slow EMA analysis with reversal confirmation to identify high-probability trading opportunities. The indicator automatically detects: EMA Cross BUY and SELL signals Pullback/Reversal confirmation Trend direction Profit/Loss statistics Monthly performance summary Historical signal analysis from a user-defined start date Buil
QB Schumann Market Resonance MT4 QB Schumann Market Resonance MT4 is an advanced market rhythm indicator inspired by the concept of resonance and market pressure analysis. Instead of relying on traditional lagging indicators, it evaluates the balance between bullish and bearish pressure using candle structure, volatility, momentum, and tick activity to identify potential turning points and directional strength. The indicator displays an intuitive dashboard with live Bull Pressure, Bear Pressure,
Tree Market Growth MT4 Nature-Inspired Multi-Timeframe Trend Analysis Tree Market Growth MT4 is a visual trend analysis indicator that transforms market behavior into a 12-stage tree life cycle. It combines trend strength, momentum, volatility, market structure and multi-timeframe confirmation into a single easy-to-read dashboard, helping traders identify trend development, continuation and possible exhaustion. Features • 12-Stage Tree Life Cycle • Multi-Timeframe Analysis (M1, M5, M15, M30, H1,
ZigZag Probability Pro Color 是一款适用于 MetaTrader 4 (MT4) 的技术指标,用于识别已确认的 ZigZag 波峰(Swing High) 和 波谷(Swing Low) ,并通过基于概率的反转模型对每个拐点进行评估。 该指标综合分析 Tick 成交量(Tick Volume) 、 Awesome Oscillator(AO) 、 ATR(平均真实波幅) 、波段长度(Swing Size)、K线数量(Bar Count)以及历史拐点表现。根据计算结果,每个已确认的拐点都会被赋予以下四种概率等级之一: 25% 50% 75% 100% 每一段 ZigZag 连线都会根据对应的概率自动着色: 25% — 绿色 50% — 黄色 75% — 橙色 100% — 红色 在检测到的拐点位置,指标会直接显示 BUY(买入) 或 SELL(卖出) 箭头,并标注计算出的概率百分比。随着信号强度的提高,箭头和百分比标签的尺寸也会自动增大,使重要信号更加醒目。 该指标还支持 弹窗提醒(Popup) 、 声音提醒(Sound) 、 Push
Market Evolution Tree is a non-repainting market structure indicator that transforms price action into an intelligent decision tree. Instead of generating random signals, it analyzes swing evolution, momentum, trend strength and multi-timeframe confirmation to identify high-probability BUY and SELL opportunities. The clean visual tree and built-in dashboard help traders understand market direction at a glance. Features Non-Repainting Signals BUY / SELL / EXIT Alerts Market Structure Tree Buy & S
LiquiditySweep Pro Market MT5 v1.3 版本 1.3 – 2026.04.26 LiquiditySweep Pro Market 是一款基于流动性扫荡(Liquidity Sweep / Stop Hunt)概念的专家顾问(EA),旨在检测近期高点和低点的价格扫荡,并在市场出现反转确认时执行交易。 核心策略 核心策略保持简单且高效: 检测价格突破近期高点或低点的流动性扫荡 通过K线收盘行为确认反转 应用可选的EMA趋势方向过滤 仅在选定的市场交易时段进行交易 通过止损(Stop Loss)、止盈(Take Profit)、保本(Break-Even)和移动止损(Trailing Stop)管理仓位 此版本在不改变原始策略核心逻辑的前提下,针对真实账户交易稳定性进行了优化。 核心交易逻辑 EA 使用可配置的回溯周期(lookback)监控市场结构。 卖出条件:价格突破近期高点后重新收于该水平下方 买入条件:价格突破近期低点后重新收于该水平上方 该方法基于一个理念:价格在反转之前,通常会先扫荡高点或低点附近的流动性。 交易方向模式 EA 提供灵活的交
Nested Pivot Arrows NR MT5 Nested Pivot Arrows NR is a non-repaint MT4 and MT5 indicator that identifies nested pivot structures and highlights potential market turning points directly on the chart. The indicator automatically detects: • Short-Term Highs (STH) and Short-Term Lows (STL) • Medium-Term Highs (MTH) and Medium-Term Lows (MTL) • Long-Term Highs (LTH) and Long-Term Lows (LTL) • Buy and Sell signals based on confirmed nested pivot formations Features: Non-Repaint Logic MT4 & MT5 Ver
筛选:
无评论
回复评论