Horizontal Channel Alert with Custom Fibo MT5
- 指标
- 版本: 2.0
- 更新: 4 二月 2026
- 激活: 20

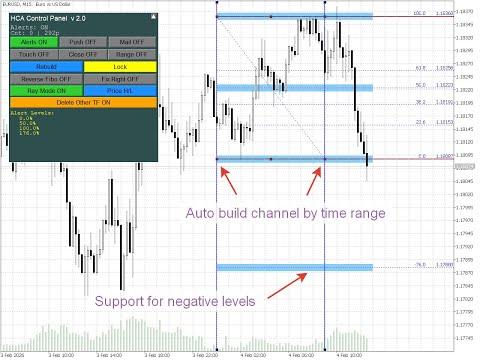
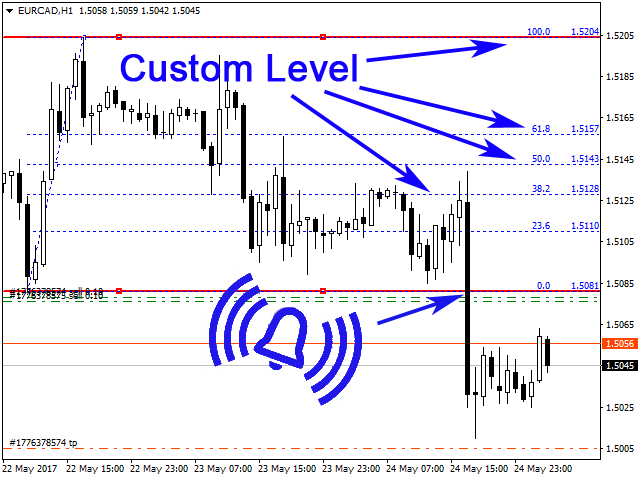
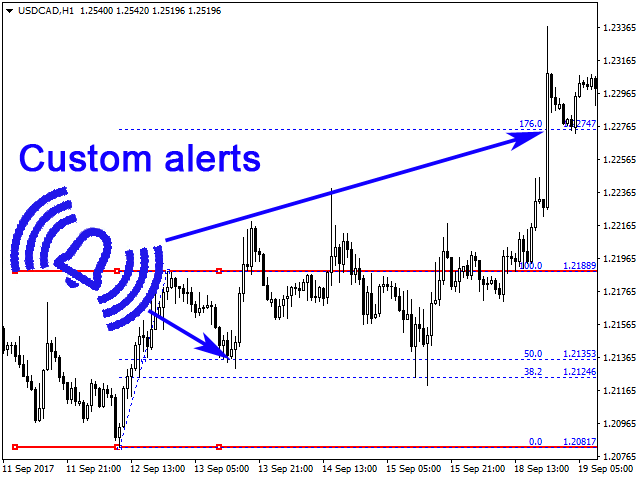
本指标用于绘制水平通道和信号区域,检测极值突破、反弹以及基于可自定义斐波那契水平的目标(可选声音提醒)。它会自动将您选择的斐波那契水平应用到这些极值上。当价格突破在设置中启用的斐波那契水平时,指标可播放声音、显示消息、向移动终端发送推送通知或发送电子邮件(若已启用)。
功能:
- 按时间范围自动构建通道,例如用于检测夜间区间的突破
- 自动跟踪新的反弹
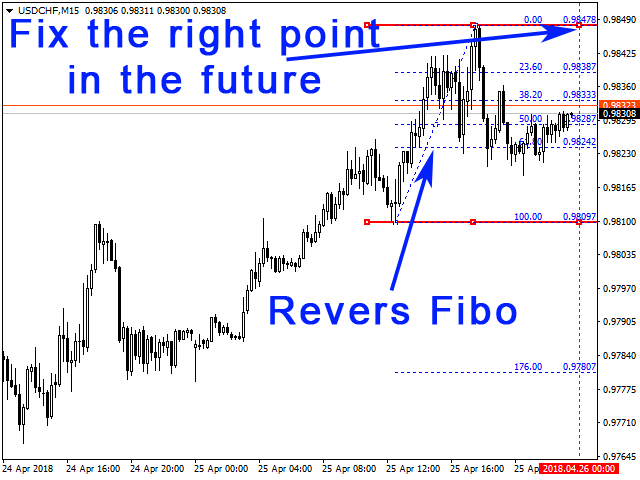
- 反转斐波那契水平刻度
- 显示/隐藏/折叠控制面板
- 从 5 种面板界面语言中选择
- 为斐波那契水平添加容差,使其成为更宽的信号区域而非线条
- 在多个时间周期上绘制水平线和斐波那契,可保留或删除其他时间周期的通道
- 按 High/Low 或 Open/Close 价格构建通道;通道自动贴合价格
- 锁定通道(设为不可选)以防误删
设置
--------- 语言 -----------
- Interface Language — 指标面板语言。English(英语)、Russian(俄语)、Spanish(西班牙语)、German(德语)、Italian(意大利语)。
--------- 设置 -----------
- Auto build channel by time range (broker time) — 按时间范围自动构建通道(经纪商时间)
- Time range HH:MM-HH:MM — 时间范围(开始–结束)
- Reverse Fibo — 反转斐波那契刻度
- Fix the right point in the future (ignored when FixByTime) — 将右端固定到未来(当「按时间范围自动构建通道」开启时忽略)
- Color Channel — 通道颜色
- Color Fibo lines — 斐波那契线颜色
- Channel Width — 通道线宽度(像素)
- Channel Length, bars — 通道长度(K 线数)
- Channel ray — 以射线形式绘制通道
- Price Mode — 价格模式:High/Low 或 Open/Close
- Delete channels from other TF — 删除其他时间周期的通道
- Lock channel (prevent line movement) — 锁定通道(禁止移动线条)
- Log channel auto-update (Experts tab) — 将通道自动更新记录到日志(专家选项卡)
--------- 控制面板 -----------
- Show control panel — 显示控制面板
- Panel X position (pixels from left edge) — 面板 X 位置(距左边缘像素)
- Panel Y position (pixels from top) — 面板 Y 位置(距顶部像素)
- Panel width (pixels) — 面板宽度(像素)
- Panel height (pixels) — 面板高度(像素)
--------- 提醒设置 -----------
- Alerts — 启用/禁用提醒
- Send Notifications — 发送通知
- Send alerts to e-mail — 通过电子邮件发送提醒
- Alert only on first touch of level (for each direction) — 仅在首次触及水平时提醒(每个方向)
- Alert on candle close above/below level — 在 K 线收盘于水平上方/下方时提醒
- Time-based alerts (N bars inside level range) — 基于时间的提醒(水平范围内连续 N 根 K 线)
- Bottom level of range, % — 基于时间提醒区间的下限水平,%(默认 38.2)
- Top level of range, % — 基于时间提醒区间的上限水平,%(默认 61.8)
- Number of consecutive bars inside range — 基于时间提醒区间内的连续 K 线数
- Limit Alerts — 提醒上限
--------- 提醒标记 -----------
- Show alert markers on chart — 在图表上显示提醒标记
- Alert marker color — 提醒标记颜色
- Marker size (1-5) — 标记大小(1–5)
- Maximum number of markers (0 = unlimited) — 最大标记数(0 = 无限制)
---- 自定义斐波线(-1 = 禁用) ----
- Level 0 … Level 29, % — 水平 0 … 水平 29 的数值,%
- Alert level 0 … Alert level 29 — 启用/禁用水平 0 … 水平 29 的提醒
- Level 0 name … Level 29 name — 水平 0 … 水平 29 的标签
提示
- 要在不改变通道大小的前提下左右移动通道,请拖动通道上轨或下轨的中间部分。
- 要延长或缩短通道,请将上轨或下轨的左端或右端拖到目标位置后松开。
- 若拖动通道边缘后线条看起来错位,在图表任意处单击鼠标左键,通道与斐波那契水平将重新对齐。
- 要反转斐波那契刻度,请启用 Reverse Fibo。
- 要自动跟踪反弹,请启用 Fix the right point in the future。通道左端保持固定;右端跟随新 K 线。
- 若启用了按时间自动构建通道(例如用于区间突破),通道仅会按时间自动重建;若要手动调整,请关闭该设置。
- 当 Delete channels from other TF = false 时,切换时间周期会保留现有通道并在所选时间周期上添加新通道。当 Delete channels from other TF = true(默认)时,切换时间周期会删除旧通道,仅在新时间周期上绘制新通道。
- 若使用推送通知,不建议将 Limit Alerts 设得过高或设为无限制,因为单账户推送通知过多可能导致 MetaTrader 服务限制后续发送。


Отличный инструмент! Спасибо!