RSI vs Envelopes Graph

3

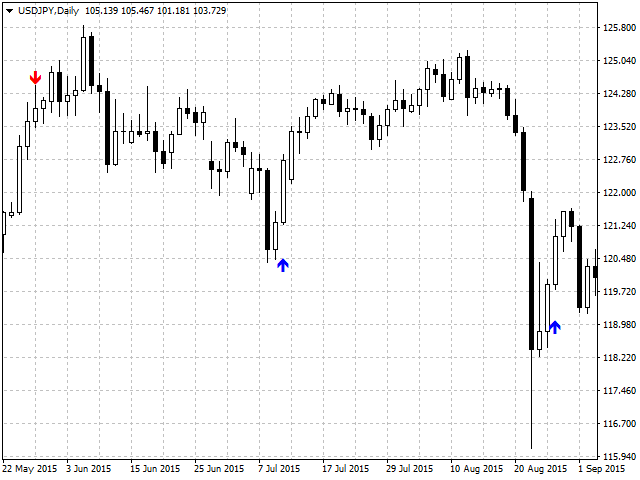
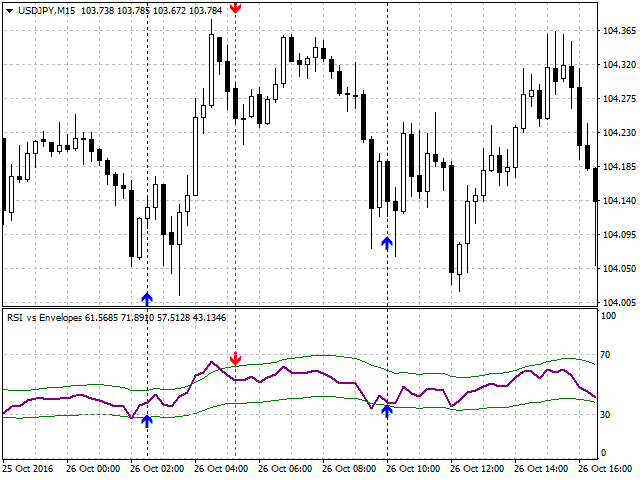
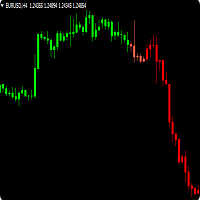
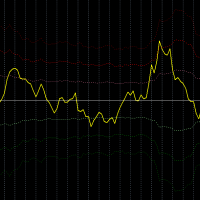
This semaphore indicator is based in the standard RSI, which is applied over the Envelopes indicator that shows an envelope or envelope fluctuation borders. This is a version of RSI vs Envelopes drawn in the symbol window.

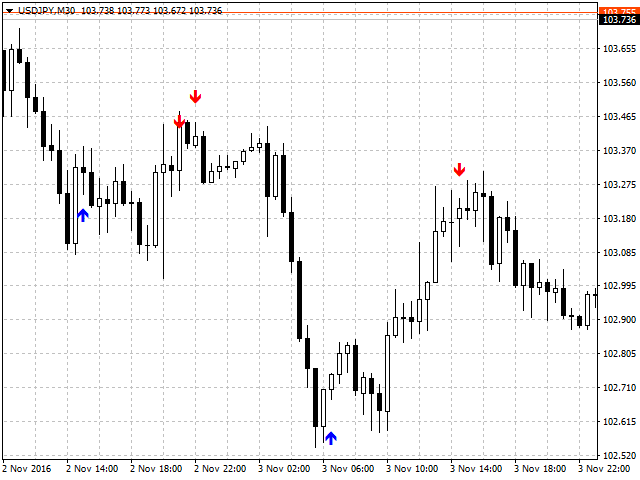
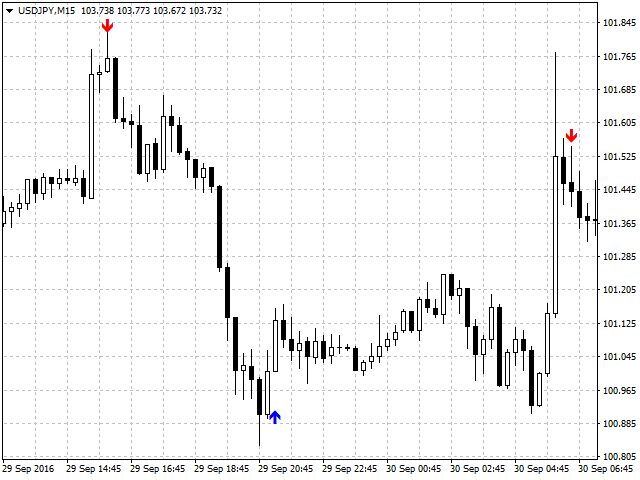
A sell signal emerges when the upper envelope/border is broken by the RSI indicator from top to bottom.

A buy signal emerges when the lower envelope/border is broken by the RSI indicator from bottom upwards.

The indicator can draw arrows on the indicator, draw vertical lines to keep track of where the entry is located on the chart, play a sound alert upon an entry signal, and send push notifications to your mobile.

If you only need signals upon crossing of the RSI indicator and the standard signal levels, use the RSI Alerts indicator.


Settings

  • RSI Period - standard RSI period.
  • Envelopes Period - indicator period.
  • Alert on screen - enable alerts.
  • Send Push - enable push-notifications to a mobile.
  • Envelopes Method - Envelopes drawing method.
  • Applied price - ерк pices used for the indicator calculations.
  • Envelopes deviation % - deviation in % (envelope width).
  • Shift 0-current bar, 1-first bar - shift of the signal, if =0 - the signal will be searched on a zero candle, if =1 - the signal will be searched on the completed candlestick, and the signal will be produced on the new candlestick opening. The second method (=1) is more reliable.
  • Draw Lines - enable/disable.
  • RSI color - choose color.
  • Envelopes color - choose color.
  • Buy arrow color - choose color.
  • Sell arrow color - choose color.


Recommendations

Note that the default settings are set approximately, so I recommend to tune RSI Period, Envelopes Period, Envelopes deviation%.

If you set "Shift 0-curren bar, 1-first bar" = 0, there is a chance that the signal will not be confirmed and will be redrawn, therefore the recommended value is = 1.

Sometimes it is convenient to watch two indicators RSI vs Envelopes and RSI vs Envelopes Graph both on the same chart.
评分 3
InspireForex Club
38
InspireForex Club 2022.03.02 18:47 
 

This is an amazing indicator if used correctly! Also, Yurij is an amazing person! I just asked him a favour and he did it without knowing me before. Thanks Yurij. You are the best!

推荐产品
Strength Graph
Zi Feng Ding
5 (1)
这个指标可以用来衡量主要货币的相对强弱。在设定的时间周期内,相对较强的货币分值较高,相对较弱的货币分值较低。 指标的设置选项 Strength Period - 更改Strength Period(力度计算周期)会影响到计算的蜡烛数量,从而影响计算结果。较高的值让指标表示的线条较为平滑,而且指标的结果会表现出各个货币更长时间里的相对强度,而不是最近的强度。 Display Options - 设置视觉呈现的偏好(show strength/weakness/kebab) "show strength" 模式,越强的货币分值越高,最弱的货币是0分。 "show weakness" 模式,越弱的货币分值越低,最强的货币是0分。 "show kebab"模式,越强的货币分值越高,平均强度分值为50分。 参照这个指标,你不仅可以用它交易主要货币对,也可以用来交易各种不同的交叉对。 基本上扫一眼能大略看懂目前各种货币的相对强弱。 如果指标没有正确载入,可以多次切换不同周期来刷新。 默认状态下指标的固定最大值和最小值是可以更改的。可以根据喜好改变指标里每种货币表示的线型和颜色。
FREE
TSTripleMovingAverages
Salvatore Labriola
Useful indicator that incorporates three moving averages, for your favorite trading strategy. Moving averages are fully configurable, Period, Method, Color, Etc Just place it on your favorite timeframe. The benefits you get : Never redesigns, does not retreat, never recalculates. Works on forex and CFD, timeframe from M1 to Monthly. Easy to use. Convenience for your trading. 
FREE
TSDoubleMovingAverages
Salvatore Labriola
Useful indicator that incorporates two moving averages, for your favorite trading strategy. Moving averages are fully configurable, Period, Method, Color, Etc Just place it on your favorite timeframe. The benefits you get : Never redesigns, does not retreat, never recalculates. Works on forex and CFD, timeframe from M1 to Monthly. Easy to use. Convenience for your trading.
FREE
An improved version of the standard Standard Deviation indicator. It is now a responsive and smoothed line. The setup is not straightforward - but I hope you can do it. It is very easy to understand the readings of this indicator, the meaning is the same as that of the usual Standard Deviation. //////////////////////////////////////////////// /////////////////////////////////// I hope this indicator will be very useful to you in successful trading. Good luck.
FREE
Donchian Trend Histogram
Mariusz Piotr Rodacki
Donchian channels are a tool in technical analysis used to determine the relative volatility of a market and the potential for price breakouts. Can help identify potential breakouts and reversals in price, which are the moments when traders are called on to make strategic decisions. These strategies can help you capitalize on price trends while having pre-defined entry and exit points to secure gains or limit losses. Using the Donchian channel can thus be part of a disciplined approach to managi
FREE
MAs COMBO
Dora Nafwa Mwabini
MAs COMBO - 探索MT4平台简单而强大的移动平均线指标! 这款自定义指标巧妙地结合了简单移动平均线,能够以最小的努力识别高概率的交易机会。 即使您是交易新手,也能凭借该指标简洁明了的逻辑快速发现清晰且有利可图的交易信号。其模式识别非常直观,无论是新手还是经验丰富的交易者都能立即上手! 您会爱上这款指标的理由: 1. 预设输入设置,无需复杂设置即可立即使用。 2. 可自定义颜色,让您根据个人风格定制图表。 3. 内置参数处理所有繁琐的移动平均线设置,节省您的时间和精力。 适用于所有交易风格: 1. 长期交易?在高时间框架下使用,以获得更强的趋势确认和更高的利润。 2. 短线剥头皮交易?将其应用于较低的时间框架(H1 以下)——只需注意市场噪音,即可获得最佳效果。 全新!更新功能: 1. 移动平均线交叉时实时发出警报——绝不错过任何交易机会! 2. 可执行的交易信号——在交叉点立即判断买入或卖出时机。 3. 精准的入场信息——获取精确的价格水平(卖价或买价)警报,助您自信下单。 无论您是初次开设交易账户,还是正在完善专业交易策略,此指标都是一款可靠的
FREE
RSI vs Envelopes
Yurij Izyumov
2 (2)
This semaphore indicator is based in the standard RSI, which is applied over the Envelopes indicator that shows an envelope or envelope fluctuation borders. This is a version of RSI vs Envelopes Graph drawn in a separate window . A sell signal emerges when the upper envelope/border is broken by the RSI indicator from top to bottom. A buy signal emerges when the lower envelope/border is broken by the RSI indicator from bottom upwards. The indicator can draw arrows on the indicator, draw vertical
FREE
A ratio between 0 and 1 with the higher values representing a more efficient or trending market,  It is used in the calculation of Perry J. Kaufman Adaptive Moving Average (KAMA), dividing the price change over a period by the absolute sum of the price movements that occurred to achieve that change. The Fractal Efficiency or also known as Efficiency Ratio was first published by Perry J. Kaufman in his book ‘Smarter Trading‘. This is mostly considered a filter for volatile markets none the less
FREE
Geo Fractals
Georgij Komarov
5 (1)
分形的专业指标。在一个打开的图表上提供“多屏幕”操作模式。 专为黄牛和“精确”作品的爱好者而设计。 显示六个时间范​​围内的分形,并在较低的时间范围内显示从价格到新出现的分形的距离,这提供了价格行为的透明性以及在支点处监视价格行为的独特准确性。 指示器同时显示分形和时间范围 W1.D1,H4,H1,M15,M5,M1。 要选择显示所需的时间范围,请使用相应的指标参数: ShowW1=true; ShowD1 = true; ShowH4 = true; ShowH1 = true; ShowM15 = true; ShowM5 = true; ShowM1 = true; 对于M1和M5时间范围,与价格的距离(买入价和卖价)以点为单位显示。 如果分形没有被价格打折,则会以虚线显示。工具提示指示线条是否属于时间范围。 破碎的分形显示为实线,并用文本标签标记,表明该线属于相应的时间范围。 您将能够通过分形线的价格或无法突破该水平的价格来固定即时联系,并在此基础上决定进一步的价格行为。 仅一个参数用作输入参数:是否添加1点(五位数字仪器为10点)来显示分形的水平。 当显示
RCCMA is a general moving average indicator that works with ReviewCandleChart. Original is "Custom Moving Average" provided by MetaQuotes Software Corp. Based on that source code, I corresponded to ReviewCandleChart . Advantages When ReviewCandleChart is ON, no line will be displayed on the right side from the vertical reference line. When ReviewCandleChart is ON and you press a key such as "Z" or "X" Following that, the MA is drawn. When ReviewCandleChart is OFF, the same drawing as the origin
FREE
MACD in MA
Nikolaos Pantzos
iMACD in iMA is indicator to change color in iMA if iMACD is upper of zero (up trend) or lower of zero (down trend). It is a useful tool to track when the upside and the downside iMACD on iMA. You can to get source code from here . Parameters MA_Periods — Period for iMA. MA_Method — Method for iMA. MACD_FastEMA — Fast EMA for MACD. MACD_SlowEMA — Slow EMA for MACD. MACD_SignalSMA — SMA signal for MACD. MACD_ApliedPrice — Price used for MACD. BarsCount — How many bars will show the line. Revers
FREE
TSO Moving Average Slope
Dionisis Nikolopoulos
3.67 (3)
The Moving Average Slope (MAS) subtracts the moving average level n-periods ago from the current moving average level. This way, the trend of the moving average can be drawn on the moving average line. Features Observe uptrends and downtrends at a glance. The indicator is non-repainting. Returns buffer values for the trend of the moving average to be used as part of an EA. (see below) Inputs Moving Average Period : The period of the moving average (MA). Slope Period : Number of periods between
FREE
TurboTrend
Ashkan Hazegh Nikrou
3 (2)
免费但先进产品概述 Turbo Trend 是一个强大的指标,旨在帮助交易者识别和跟随市场趋势。它结合了高级移动平均线和成交量分析,以提供明确的趋势方向信号。Turbo Trend 通过将市场状况分类为三种不同的状态: 上升趋势 、 下降趋势 和 中性趋势,简化了决策过程,使用易于区分的彩色线条和蜡烛高亮显示。 加入  Koala Trading Solution 频道  在mql5社区,获取有关所有Koala产品的最新新闻,加入链接如下: https://www.mql5.com/en/channels/koalatradingsolution 访问其他不错的免费工具:FVG 指标:  https://www.mql5.com/en/market/product/108907 基于 Turbo Trend 的EA 现在已在市场上提供 在此访问 Turbo Trend Bot: https://www.mql5.com/en/market/product/127401 关键功能 趋势分类 :该指标使用复杂的算法来分析多个移动平均线和成交量,以提供明确的趋势洞察。 视觉信号 :趋势方向
FREE
TrailingStop MA 4
Andrej Nikitin
4 (1)
本指标绘制两条 简单移动均线 ,使用最高价和最低价。 MA_High 线当均线指向下行时显示。它可以用于设置空头订单的止损位。 MA_Low 线当均线指向上行时显示。它可以用于设置多头订单的止损位。 本指标用于 TrailingStop EA。 参数 Period - 移动均线的计算周期。 Deviation - 线间聚合/离散率。 缓存区索引: 0 - MA_High, 1 - MA_Low。
FREE
Force Index MTF 是经典力度指数(Force Index)振荡器的进阶实现,增强了多周期(MTF, Multi-Timeframe)能力。它通过计算价格变动与成交量的乘积,量化市场波动背后的原始力量,帮助交易者区分显著的趋势延续与轻微的回调。 作为一款动量-成交量振荡器,Force Index 衡量买方和卖方的力量。正值表示买盘压力占主导(吸筹/accumulation),负值表示卖盘压力占主导(派发/distribution),而零轴穿越则预示市场控制权可能发生转变——常被用于识别回调的结束。 本指标包含一个独立的 MTF 引擎,让您无需切换窗口,即可在当前图表上直接监控任意更高周期(HTF)的 Force Index 数据。它提供双模式灵敏度:短周期(例如 2)高度灵敏,适合在日内交易中捕捉短期回调;标准周期(例如 13)数据更平滑,针对波段趋势和结构转变进行了优化。彩色编码的柱状图让市场压力一目了然,优化的输出缓冲区(output buffers)使本指标可与智能交易系统(Expert Advisor / EA)连接。 在实际使用中,本指标可作为趋势跟随过滤
FREE
Price Ladder
Kourosh Hossein Davallou
This indicator is based on the Channel . Input Parameters channel_One- show trend line One on or off. timeFrame_One - time Frame of channel One . ColorChannel_One - color of  trend line One. channel_Two- show trend line Two on or off. timeFrame_Two - time Frame of channel Two . ColorChannel_Two - color of  trend line Two. channel_Three- show trend line Three on or off. timeFrame_Three - time Frame of channel Three . ColorChannel_Three - color of  trend line three. channel_Four- show trend line F
FREE
Step RSI AM
Andrii Matviievskyi
5 (2)
所呈现的指标是基于经典技术分析指标 RSI 的原创开发。 为了平滑指标值的急剧波动,我们使用了一个过滤器来消除微弱的变化,并将交易者的注意力集中在值的剧烈波动上。 指标不会在形成的条形上重新绘制。 为了提高该指标的有效性,应将其与识别趋势方向以及支撑/阻力位的指标结合使用。 指标信号在指标直方图与指标信号线相交的点处给出。 当价格突破发出信号的柱状图的最大值/最小值时,即确认信号。 该指标允许向移动终端和电子邮件发送信号通知。 可配置参数: Style  - 指标信号的风格(指标的主要信号是振荡器穿过信号线或振荡器穿过零线; Number_of_bars_calculated - 计算并显示指标的条数; RSI_Price - 用于计算指标的价格; RSI_Period - 指标周期; Shift_Signal_Line - 信号线相对于指标的平移; Method_Signal_Line - 平滑信号线的方法; Period_Signal_Line - 信号线的平滑周期; M_Signal_on_Chart - 在价格图表上显示主要信号; A_Signal_on_Chart - 在价格
FREE
AW Flexible Fractals
AW Trading Software Limited
4 (5)
该指标分析分形的价格结构并确定市场动态的可能反转点。与其他类型的指标结合使用时非常完美。 好处: 适用于所有仪器和时间序列, 不重绘结果, 指示器元素的可定制颜色, 适用于任何趋势策略, 调整分形的强度。 MT5 version -> HERE / Our news ->  HERE Strategy: AW Flexible Fractals   is an indicator that indicates signals not instantly, but with a delay, due to the structure of the fractal.     To detect a signal in the " Number of candles on each side of the fractal " variable, you can adjust the number of bars on each side       from the central point of the fractal. In the default settings, the
FREE
This is a   custom MT4 indicator   called   “Elsna Moving Average” . It plots   three moving averages (MA1, MA2)   on the chart with customizable periods, shifts, methods, and applied prices. MA1 & MA2   can optionally be used to create   fill areas   (histogram-like shading) based on a color-fill setting You can   show or hide each MA   individually. The indicator is designed for   trend identification and visualization , helping traders see MA relationships and potential support/resistance zon
FREE
Broken Trends
Nikolay Likhovid
4.5 (2)
突破趋势 是为剥头皮者和日内交易者准备的指标。指标在图表上以实时模式选择并显示趋势级别。指标反应价格动量: 它在动量幅度超过指定参数里设置的阀值之时,开始搜索趋势。此指标当价格越过当前的趋势线时,还可以播放声音。在正常模式, 此指标只显示一条 (最后发现的) 上行和一条下行趋势线, 但在高级模式 - 以前检测到的趋势线依旧在图表上绘制。 注意 突破趋势 指标不会产生完整的决定。它只做脏活,显示出可能的选项。交易者应该做出决定。 指标参数: ExtMode - 启用/禁止高级模式;  Sound - 启用/禁止 当价格与趋势线交叉时声音通知;   UTColor - 设置上行趋势线颜色;  DTColor - 设置下行趋势线颜色;  HistoryDepth - 设置使用历史的深度, 0 - 整个历史; Rank - 设置搜索等级; PulseThr - 设置动量振幅阀值点数。
FREE
hi dear today i write an indicator of crossing 2 moving averages and show a label for the signals of it . .......................you can select the period of movings and the method of moving............... ......................and also method of apply price and see the movings and signals.................. ................also you can turn off showing movings to see just signal labels.......................... ................................................wish the best for you................
FREE
Returns MT4
Fabrizio Malavasi
This indicator shows the value of returns in the selected time frame . They are calculated as logarithm of returns , rather than price or raw returns. For small returns, arithmetic and logarithmic returns will be similar. The benefit of using returns, versus prices, is normalization. It is possible measures all variables in a comparable metric despite originating from price series of unequal values. Inputs You can display data both as a Histogram  or a    Line It's also possible to display th
FREE
TrendFinder SMA
Jose Ramon Miranda Ramos
4.78 (9)
Trendfinder SMA are Colored candlesticks showing the trend based on two Simple Moving Averages and the slope of the slow moving average. This indicator will give you the color change on the next bar on the confirmation candle and will never repaint   Trendfinder SMA is optimize to trade on any market and to be used trending and None trending markets. PLEASE TAKE NOTICE: For best results use this indicator as an extra tools after you have completed your regular analysis and use it for alerts base
FREE
Multi RsIBB MT4
Mansour Babasafary
4 (2)
A combined indicator of two famous indicators: RSI , Bollinger Bands Can be used in all currency pairs Can be used in all time frames with many signals Very simple and fast to use Description: This indicator is made from the combination of RSI and Bollinger Bands indicators As you can see, it shows good signals and is worth using and testing We hope you are satisfied with this indicator Settings: show past show candle: Displays the number of candles that the indicator calculates. For example
FREE
Nema general PRT
Irina Cherkashina
What is so remarkable about the Nema general PRT indicator? It calculates all known derivatives of "EMA" (you know some: DEMA - or, more simply, EMA of the 2nd depth level, TEMA - EMA of the 3rd depth level...DecEMA ...and so you can dive into your research up to level 50...)   If you set the depth = 1, then it will be an analogue of "EMA"; I repeat - depth 2 = "DEMA"; depth 3 = "TEMA"...Experiment - check the behavior of the created average at other depths.     The indicator also has the abili
FREE
Adaptiv Ma это индикатор средняя линия  значение которой выставляется в меню и применяется на тейфрейме Н4. В последствии она адаптируется к выбранному определенному таймфрейму. В меню индикатора задаются следующие параметры 1. Период индикатора 2.Метод определения Ма. 3. Стиль Ма. 4.Толщина линии Ма. 5.Цвет линии Ма. При переключении между таймфреймами автоматически переключается значение периода Ма для адаптации к новому таймфрейму. Пишите насколько вам была полезен такой индикатор. 
FREE
Lampropeltis
Vladimir Blednov
4.6 (5)
Lampropeltis is a trend indicator. The algorithm of calculation is based on data from the standard indicators included in the MT4 package and interpretation of patterns formed by these indicators. The settings include a minimum set of parameters: Slow MA - slow MA period; Slow MA method - slow MA smoothing method; Fast MA - fast MA period; Fast MA method - fast MA smoothing method. Change of the signal color to red indicates the possibility of opening a Sell order. Change of the signal color to
FREE
PZ Multi TDI
PZ TRADING SLU
4.8 (10)
All-in-one trading powerhouse: trend, reversal, and exhaustion detection This indicator is a personal implementation of the famous Traders Dynamic Index, which uses RSI, moving averages and volatility bands to find trends, reversals and price exhaustions. However, this particular implementation supports not only RSI, but many others. It is suitable for scalping, day trading, and swing trading and aims to provide a full picture of the current market conditions. [ Installation Guide | Update Guid
FREE
Gravity Force
Salman A A A T Bakhash
Description: This indicator measures how far the price is away from Moving Average or multiple Moving Averages  (from Lowest MA Period to Highest MA Period). also you can apply  weighted factor that  increase / decrease from  lowest  MA to  highest  MA period. Inputs: Lowest MA Period Highest MA Period Weighted factor for Lowest MA Period Weighted factor for Highest MA Period MAs method MAs applied price ATR Period 1st band factor 2nd band factor 3rd band factor indicator Applied price
FREE
MA Cloud mt4
Alexander Chertnik
4 (2)
Moving Average Cloud draws 4 MAs on chart simultaneously in histogram style. Indicator uses 4 MAs: slow sma & ema 200 and fast sma & ema 50. the range between 2 slows MAs and Fasts, represented by histograms on the MAs boundaries - creating kind of "cloud" that can be traded by all kind of MA strategies like support & resistance or other... Change of color of the same histogram points to momentum changing. Combined with other market analysis, can greatly improve trading results.
FREE
该产品的买家也购买
Trend SniperX MT4
Sarvarbek Abduvoxobov
5 (3)
Trend Sniper X 是一款用于 MetaTrader 5 的多周期趋势追踪指标,旨在帮助交易者清晰、精准地识别趋势方向及潜在的反转点。 适用于 MT5: https://www.mql5.com/en/market/product/181101 价格信息: 当前价格为促销价,随着后续更新和新功能的推出,价格可能会发生变动。 Code2Profit 频道 通过多周期分析掌控市场! 如何使用 Trend Sniper X 最大化胜率:关键规则与交易时段技巧 技术规格 交易平台 MetaTrader 5 指标类型 多周期趋势指标 运行时间周期 任意图表周期,支持独立选择更高周期(M1–MN1) 主要交易品种 外汇、黄金 (XAUUSD) 及其他 CFD 差价合约 推荐账户 任何账户类型 可视化呈现 彩色趋势 K 线(买入/卖出/弱势/转变)+ 买入/卖出信号箭头 附加模块 市场交易时段框(悉尼、东京、伦敦、纽约) 核心功能 多周期趋势分析: 将更高周期的趋势方向直接投影到当前图表上,提供清晰的宏观视角。 弱势/不确定 K 线检测: 高亮显示趋势状况不明确的 K 线,帮助交易者远离震
SR Liquidity
Oleg Rodin
5 (2)
SR Liquidity 是一款旨在揭示市场流动性高度集中且价格反应最剧烈的隐蔽区域的交易指标。这些特殊的流动性区域充当着强有力的支撑位与阻力位,为您清晰呈现市场最可能发生反转的位置。 SR Liquidity 指标并非简单地绘制常规的支撑/阻力线,而是通过分析实际的价格行为,识别买卖压力积聚的区域。这些区域实际上是推动市场真实波动的流动性池。通过在图表上直观呈现这些区域,该指标能助您在价格反应发生前预判走势——这意味着它实际上能够预测价格方向可能发生的变化。它将原始的价格行为转化为清晰且具实操价值的市场蓝图,标示出那些可能成为市场转折点的关键价位。 该指标适用于任何交易品种和时间周期——包括外汇、指数、金属、加密货币等。支持任意时间周期。 购买后请联系我,以获取交易指南及免费赠送的优质附加指标!
Miraculous Indicator Binary & Forex v3 StrategySafe Miraculous Indicator Binary & Forex v3 StrategySafe 是一款专业交易指标,适合希望获得清晰信号、强大确认工具以及结构化交易方式的 Binary 和 Forex 交易者。 v3 版本加入了 MIR Dashboard、Miraculous Confirmation Dashboard、GANN Law、Square of 9 水平线、GANN 角度以及更强的 Forex 分析模式。 核心功能 同时支持 Binary 和 Forex 交易模式。 MIR Dashboard 可快速读取市场状态。 Miraculous Confirmation Dashboard 用于确认交易机会。 GANN Law drawing lines 用于 Forex 市场结构分析。 Square of 9 线条、方向和关键价格水平。 1x1 GANN Angle 用于判断趋势压力。 Entry Information TP 帮助寻找合理止盈区域。 Strateg
Zoryk Gold mt4
Reda El Koutbane
5 (2)
折扣将在 24 小时后结束——下一价格为 69 美元 联系我获取推荐设置 首发名额有限 ZORYK — MetaTrader 4 专业 XAUUSD 黄金信号与交易计划系统 你一定经历过这种感觉。 你花时间分析黄金,等待入场,终于打开交易后,价格却立即向相反方向移动。你过早平仓,移动止损,或者因为犹豫几秒而错过机会。随后市场在没有你的情况下,准确到达你最初预期的目标。 问题并不总是方向错误。 真正的问题是不确定性。 你不知道真正的入场位置在哪里,不知道交易逻辑在什么位置失效,也不知道应该先保护较小的利润,还是继续等待更大的行情。你甚至不知道当前信号是否足够强,还是自己只是在勉强寻找一笔交易。 黄金移动速度非常快。没有明确计划的正确判断,也可能在几秒钟内变成错误决定。 ZORYK 正是为了解决这个问题而开发。 什么是 ZORYK ZORYK 是一套专门为 MetaTrader 4 和 XAUUSD M5 周期开发的完整黄金信号与交易计划系统。 它不是一个只显示 BUY 或 SELL 箭头,然后让你独自处理所有后续决定的普通指标。 每个确认信号都可以在图表上显示
M1 Sniper
Oleg Rodin
4.97 (30)
M1 SNIPER 是一款易于使用的交易指标系统。它是一个专为 M1 时间框架设计的箭头指标。该指标可以作为独立的系统在 M1 时间框架下进行剥头皮交易,也可以作为您现有交易系统的一部分使用。虽然该交易系统专为 M1 时间框架交易而设计,但它也可以用于其他时间框架。我最初设计此方法是为了交易 XAUUSD 和 BTCUSD。但我发现这种方法在其他市场交易中也同样有用。 指标信号既可以顺势交易,也可以逆势交易。我教授一种特殊的交易技巧,帮助您利用指标信号进行双向交易。该方法基于使用特殊的动态支撑位和阻力位区域。 购买后,您可以立即下载 M1 SNIPER 箭头指标。此外,我还为所有 M1 SNIPER 工具用户免费提供下方屏幕截图所示的 Apollo Dynamic SR 指标!这两个指标的组合可以帮助您更轻松、更准确地利用 M1 时间框架进行交易。 购买后请联系我,免费获取交易提示和奖励指标! 祝您交易成功!
DayTrader PRO MT4
Davit Beridze
4.6 (10)
DayTrader PRO MT5:  https://www.mql5.com/en/market/product/186222 DayTrader PRO 是一款先进的交易指标,它结合了约翰·埃勒斯 (John Ehlers) 的 Laguerre 滤波器与强大的自动优化引擎。该指标不依赖固定的参数,而是根据最新的市场状况自动搜寻最佳设置,帮助您在无需手动调整的情况下适应不断变化的市场波动。 该指标可生成清晰的买入 (BUY) 和卖出 (SELL) 信号,并提供根据当前市场波动率计算得出的自适应止损 (Stop Loss) 和止盈 (Take Profit) 水平。内置的趋势、效率系数 (Efficiency Ratio)、波动率和蜡烛图过滤功能,有助于剔除低质量的交易设置,从而提高信号的准确性。 实时性能面板会显示当前已优化的设置、利润因子 (Profit Factor)、胜率 (Win Rate)、回撤 (Drawdown) 以及其他交易统计数据。DayTrader PRO 还支持弹出窗口、推送、邮件和声音提醒,确保您不会错过任何交易机会。 主要功能 全自动参数优化 自适应买入
Scalper Inside PRO
Alexey Minkov
4.74 (69)
Scalper Inside PRO 帮你分析日内趋势,在入场前就把交易规划好。核心是三套专属策略,让你更精准地读懂市场。信号一出现,指标就自动判断行情方向并计算关键价位,你能提前看到潜在入场点、预期的止损以及多个止盈位。详尽的绩效统计会展示不同品种和策略在历史上的表现,帮你根据当前行情挑选合适的资产。它既可以作为独立的剥头皮工具,也可以融入你的系统,或者作为你自己 EA 的基础。运行于 MetaTrader 4 平台。 指标会直接在图表上标出入场、三个止盈位 - TP1、TP2、TP3 以及一个可选止损。你甚至可以接入自己的箭头指标,检验它们的统计数据和盈利能力。 购买后请直接联系我,即可获得指标的专属附赠 add-ons、更多关于实盘运用的说明,以及把它正确接入你自己交易系统和 EA 的帮助。 指标主要功能 内置三套专属交易策略,可即时切换。 箭头信号出现后即时计算价位:入场以及 TP1、TP2、TP3 多级目标立刻显示,方便你提前规划交易。开启手动或自动计算后,会显示止损位。 三套策略均内置优化模块:自动把参数适配到当前品种和周期,帮你快速筛选资产(仅在实时状态下可用)。 HTF
Smart Trend Trading System
Issam Kassas
4.8 (10)
本产品已针对 2026 年市场进行更新,并针对最新 MT5 版本进行了优化。 价格更新通知: Smart Trend Trading System 目前价格为 $99 。 接下来的 30 次购买 后,价格将上涨至 $199 。 特别优惠: 购买 Smart Trend Trading System 后,请发送私信给我,即可免费领取 Smart Universal EA ,并将您的 Smart Trend 信号转换为自动交易。 Smart Trend Trading System 是一套完整的交易系统,具备不重绘、不回绘、不延迟的特点,专为希望获得更清晰信号、更准确趋势方向以及更有组织交易方式的交易者打造。 Online course , manual and [download presets] . 它将 10 多种交易工具 整合到一个系统中,包括趋势检测、反转区域、Smart Cloud、移动止损逻辑、支撑与阻力、K线着色、提醒以及多周期分析。 该系统旨在帮助您应对不同的市场环境: 趋势市场: 识别主要趋势,发现回调,跟随动能,并通过止损指导和移动止损选项寻找更清晰的入场机会。
Entry Points Pro
Yury Orlov
4.59 (174)
这是一款 MT4 的趋势指标,可提供准确的入场交易信号,且无重绘或延迟。 它可应用在任何金融资产:外汇、加密货币、贵金属、股票、指数。 最好的结果出现在 M15+ 的时间帧内。 指标的 MT5 版本 重要! 购买后请联系我,以便获取详细指南和奖励。 视频 (6:22) - 一个信号赢取的利润等于指标价格的三倍。 视频 (4:44) - 它如何在测试器中工作,我的提示和技巧。 视频 (1:44) - 有关它如何处理加密货币和指数的几句话。 大多数交易者在 Entry Points Pro 指标的帮助下,在第一个交易周内就改善了他们的交易结果。 Entry Points Pro 指标的益处 入场信号无重绘或延迟 如果信号出现,并得到确认(如果信号所在烛条已收盘),则它不会再消失;不像是重绘指标,它会导致重大的财产损失,因为它们可以在显示信号后再将其删除。 无差错开仓 指标算法可令您找到入场交易(买入或卖出资产)的理想时机,从而提高每位交易者的成功率。 Entry Points Pro 可操作任何资产 它允许您在 MT4 平台上交易任何经纪商提供的加密货币、股票、金属、指数、商品
Gann Made Easy
Oleg Rodin
4.84 (172)
Gann Made Easy 是一个专业且易于使用的外汇交易系统,它基于使用先生理论的最佳交易原则。 W.D.江恩。该指标提供准确的买入和卖出信号,包括止损和获利水平。您甚至可以使用推送通知在旅途中进行交易。 购买后请联系我,即可免费获得交易指导和超棒的额外指标! 您可能已经多次听说过江恩交易方法。通常 Gann 的理论不仅对于新手交易者而且对于那些已经有一定交易经验的人来说都是非常复杂的东西。这是因为江恩的交易方法在理论上并不那么容易应用。我花了几年时间来完善这些知识,并将最好的原则应用到我的外汇指标中。 该指标非常易于应用。您所需要的只是将其附加到您的图表并遵循简单的交易建议。该指标不断进行市场分析工作并寻找交易机会。当它检测到一个好的入口点时,它会为您提供一个箭头信号。该指标还显示止损和获利水平。 换句话说,当您像先生一样进行交易时,该指标会为您提供最佳江恩建议。江恩亲自告诉你此时此刻该做什么。但最好的部分是您不需要了解任何有关江恩交易原则的知识,因为该指标会为您完成整个市场分析工作。
Tokyo mt4 Indicator
Vasiliy Strukov
5 (2)
Tokyo Indicator(东京指标)直观地展示了趋势方向、潜在交易信号及市场状况。 其采用颜色编码的阶梯式趋势线,以蓝色标识看涨阶段,以洋红色标识看跌阶段。配套的方向箭头会在趋势发生变化时,标示出潜在的买入与卖出机会。 内置的综合仪表盘将当前信号、市场倾向、动能、波动率及信号质量整合于同一视图中,方便交易者在观察价格走势的同时评估指标数据,无需在不同面板间切换。 凭借清晰的图表显示和简洁的市场概览,Tokyo Indicator 支持以系统化的方式进行趋势分析与交易确认。 适用于任何时间周期及各类交易品种,尤其适合黄金交易。 购买后请立即联系我,以获取专属赠品!您可以免费获得我们的“强力支撑与趋势扫描”(Strong Support and Trend Scanner)指标,请私信我! 设置说明与使用手册请见此处。 请注意:我不会在 Telegram 上出售我的 EA 或特殊参数设置(set files);我的 EA 仅在 Mql5 平台上提供,而参数设置文件仅在我的博客(此处链接)上发布。请务必警惕诈骗,切勿从他人处购买任何参数设置! 设置 ShowHUD —— 在图表上显示
成交量突破震荡指标是一种以震荡指标的形式将价格变动与成交量趋势相匹配的指标。 我想将成交量分析整合到我的策略中,但大多数成交量指标都令我失望, 例如 OBV、资金流量指数、A/D,还有成交量加权 Macd 和许多其他指标。 因此,我为自己编写了这个指标,我对它的实用性感到满意,因此我决定将其发布到市场上。 主要特点: 它突出显示了价格在成交量增加(突破)支持下朝某个方向移动的阶段。 它突出显示了成交量增加停止并因此市场收缩的阶段。 它突出显示了价格和成交量均未移动的阶段,尤其是在时间范围(<=15 分钟)的日内交易中,因此市场已为未来的运行做好准备。 当其他 EA 交易程序发出的虚假信号不受交易量增加的支持时,可过滤掉这些信号。 它使趋势和范围阶段可视化变得非常容易 输入参数: 计算设置: 计算类型:快速、正常、慢速,用于监控短期、中期和长期,保持在同一时间范围内。 计算周期:计算周期 交易量设置: 交易量类型:TickVolume(主要用于外汇)和RealVolume(用于股票市场) 信号设置: 信号周期:信号线周期 突破水平:突破信号的阈值水平 警报设置 警报类型:收盘
TPA True Price Action indicator reveals the true price action of the market makers through 100% non-repainting signals (except early signals mode) strictly at the close of a candle! TPA shows entries and re-entries, every time the bulls are definitely stronger than the bears and vice versa. Not to confuse with red/green candles. The shift of power gets confirmed at the earliest stage and is ONE exit strategy of several. There are available now two free parts of the TPA User Guide for our custom
Trend Catcher ind
Ramil Minniakhmetov
5 (11)
趨勢捕捉指標 趨勢捕捉指標結合了作者獨有的客製化自適應趨勢分析指標,用於分析市場價格趨勢。它透過過濾掉短期噪音,並專注於潛在的動能強度、波動性擴張和價格結構行為,來識別真實的市場方向。此外,它還結合了平滑和趨勢過濾等客製化指標,例如移動平均線、相對強弱指標 (RSI) 和波動率過濾器。 您可以在這裡查看實際運行情況以及我的其他產品: https://www.mql5.com/en/users/mechanic/seller 請注意,我不會在 Telegram 上出售 EA 或任何設置,那是騙局。所有設定都可以在我的部落格上免費取得。 重要提示!購買後請立即聯繫我,以獲取使用說明和額外獎勵! 請注意,我不會在 Telegram 上出售 EA 或任何設置,那是騙局。所有設定都可以在我的部落格上免費取得。
Quantum Naked SMC Prime is a streamlined Smart Money Concepts indicator designed for traders who prefer a clean chart, structured market analysis and clear visual trade setups without unnecessary complexity. The indicator combines market structure, liquidity behavior, institutional zones and confirmation logic into a compact analytical framework. Instead of flooding the chart with technical indicators, Quantum Naked SMC Prime focuses on the core elements of price action and Smart Money Concepts.
Advanced Currency IMPULSE with ALERT
Bernhard Schweigert
4.9 (491)
目前40%的折扣!! 对任何新手或专家交易者来说都是最好的解决方案! 这个指标是一个独特的、高质量的、负担得起的交易工具,因为我们已经纳入了一些专有的功能和一个秘密的公式。只需一张图表,它就能给出所有28种货币对的警报。想象一下,你的交易将如何改善,因为你能够准确地确定新趋势或剥头皮机会的触发点 建立在新的基础算法上,它使识别和确认潜在交易变得更加容易。这是因为它以图形方式显示了一种货币的强势或弱势是否正在加速,并测量了这种加速的速度--把它想象成你汽车中的速度表。当你加速时,事情显然会发生得更快,这在外汇市场上也是一样的,即如果你配对的货币正在向相反的方向加速,你就会发现一个潜在的有利可图的交易。 货币动量的垂直线和箭头将指导你的交易! 动态的市场斐波那契23水平被用作警报触发器,将适应市场活动。如果冲动触及黄色触发线,您将在MetaTrader或您的电子邮件或推送警报中收到警报。然后你就知道作为一个交易员应该做什么。货币对和方向已经给出。只要点击警报按钮,就可以切换到该货币对或打开一个新的图表,以便进一步分析。警报级别可以通过用户输入来改变,可以选择3个敏感度级别。 尽
Price Breakout pattern Scanner is the automatic scanner for traders and investors. It can detect following patterns automatically from your chart. Head and Shoulder - Common tradable pattern. Reverse Head and Shoulder - This pattern is the reverse formation of the Head and Shoulder. Double Top - When the price hits resistance level twice and decline toward the support level, the trader can anticipate sudden bearish breakout through the support level. Double Bottom - The double bottom pattern is
Quantum Breakout Indicator PRO
Bogdan Ion Puscasu
4.96 (26)
介绍     Quantum Breakout PRO   ,突破性的 MQL5 指标,正在改变您交易突破区域的方式!   Quantum Breakout PRO 由拥有超过 13 年交易经验的经验丰富的交易者团队开发,旨在通过其创新和动态的突破区域策略将您的交易之旅推向新的高度。 量子突破指标将为您提供带有 5 个利润目标区域的突破区域的信号箭头,以及基于突破框的止损建议。 它既适合新手交易者,也适合专业交易者。 量子 EA 通道:       点击这里 MT5版本:   点击这里 重要的!购买后请私信我领取安装手册。 建议: 时间范围:M15 货币对:GBPJPY、EURJPY、USDJPY、NZDUSD、XAUUSD 账户类型:ECN、Raw 或 Razor,点差极低 经纪商时间:GMT +3 经纪商:IC Markets、Pepperstone with Raw 和 Razor 的点差最低 规格: 不重漆! 最多 5 个建议利润目标区域 建议止损水平 可定制的盒子。您可以设置自己的 Box Time Start 和 Box Time End。 接触 如果您
目前八折优惠! 对任何新手或专家交易者来说都是最好的解决方案! 这个仪表板软件适用于28种货币对。它基于我们的两个主要指标(高级货币强度28和高级货币冲动)。它对整个外汇市场提供了一个伟大的概述。它显示高级货币强度值,货币运动速度和28个外汇对在所有(9)时间段的信号。想象一下,当你可以使用图表上的单一指标观察整个市场,以确定趋势和或剥头皮的机会时,你的交易将得到改善 我们已经在这个指标中建立了一些功能,使你更容易识别强势和弱势货币,同时识别和确认潜在的交易。该指标以图形方式显示货币的强势或弱势是增加还是减少,以及它在所有时间段的表现。 增加的新功能是动态市场斐波那契水平,它适应当前的市场条件变化,这是一个已经在我们的高级货币强度28和高级货币冲动指标中使用的成熟的加分项。 在交易时,总是将弱势货币和强势货币配对,这个新指标将帮助你做到这一点。 用户手册:点击这里  https://www.mql5.com/en/blogs/post/708783 特点  显示每个时间段的ACS28和GAP-speed(冲动)的货币强度值。 列:颜色代码以7种颜色显示货币强度:强势
CRT Candle Range Theory HTF MT4 - Ultimate CRT Indicator: 高级ICT概念与马来西亚SnR交易系统 使用最先进的 Candle Range Theory 指标掌握做市商的足迹。释放 Smart Money Concepts (SMC) 的真正力量,并使用 Ultimate CRT Indicator 像机构一样精确交易。该指标专为严肃的交易者打造,自动化了高效的蜡烛范围理论 (CRT)——ICT概念 (Inner Circle Trader) 的核心支柱,并通过马来西亚支撑与阻力 (SnR) 入场方法和 FVG (不平衡) 区域的致命精度对其进行了强化。 无论您是在 MT4 或 MT5 上交易外汇、加密货币还是指数,该算法都能消除市场噪音,过滤虚假突破,并将高概率、高回报的交易区域直接传送到您的图表上。 CRT Indicator 的核心功能: Absolute Extreme SnR Entry Engine: 与依赖滞后吞没形态的传统指标不同,我们的系统采用了马来西亚 SnR 技术。它在严格的时间窗口内扫描绝对最高的 Buy-
True Direction Oscillator
Muhammad Elbermawi
4.85 (364)
或 (TDO),它是一种使用“ 纯动量 ”原理衡量价格变化率的指数。 当证券价格从 10 上涨到 15 时,价格变化率为 150%,但当它从 15 回落到 10 时,价格变化率仅为 33.3%。这就是为什么像“价格变化率”(ROC) 或“动量”这样的技术分析指标给出的上升价格走势读数高于下降价格走势读数的原因。 TDO 解决了这个问题,以帮助交易者正确读取动量。 重要信息 TDO 用户手册: https://www.mql5.com/en/blogs/post/717970 TDO 常见问题: https://www.mql5.com/en/blogs/post/722015 TDO 视频库: https://www.mql5.com/en/blogs/post/722018 TDO Expert Advisor 示例: https://www.mql5.com/en/blogs/post/731141 TDO 特性 TDO 以百分比计算纯动量,因此它用于比较来自不同市场的不同证券。 (例如:将 EURUSD 与 Gold & Dow Jones Industrial 进行比较)
Introducing the POWER TRADE Indicator Created by a small group of experienced traders with years of profitable experience in the financial markets, the Power Trade Indicator is a plug-and-play trading tool designed to help traders spot high-quality setups with ease and confidence. What It Does: It provides powerful entry signals, profit-taking zones, and rebound areas — giving you a complete view of where price action is most likely to move next. The indicator reacts in real time, al
Dark Support Resistance  is an Indicator for intraday trading. This Indicator is programmed to identify  Support and Resistance Lines , providing a high level of accuracy and reliability. Key benefits Easily visible lines Only the most important levels will be displayed Automated adjustment for each timeframe and instrument Easy to use even for beginners Never repaints, never backpaints, Not Lag 100% compatible with Expert Advisor development All types of alerts available: Pop-up, Email, Push
Top Bottom Tracker MT4
Rodrigo Arana Garcia
Top Bottom Tracker 是一款基于复杂算法的指标,可分析市场趋势并检测趋势的高点和低点 / MT5 版本。 价格将逐步上升,直至达到 500 美元。下一个价格 --> $99 功能特点 无重绘 新数据到来时 该指标不会改变其数值 交易货币对 所有外汇货币对 时间框架 所有时间框架 参数 ==== 指标配置 ==== 配置参数 // 40(值越高,发出的信号越少但越准确) 上水平值 // 80(上水平线的值) 下水平线值 // 20(下水平线值) 指标计算条数 // 3000(您希望指标计算多少条。数值 0 将计算所有条形图的指标) ==== 警报配置 ==== 弹出警报 // true (在终端上发出警报) 电子邮件报警 // true (通过电子邮件报警) 警报时间间隔 // 10 (警报时间间隔,以分钟为单位) 警告 我只在 MQL5.com 上销售我的产品。如果有人联系您向您推销我的产品,那么他们就是骗子,只想要您的钱。 此外,如果您从外部网站购买我的产品,我向您保证,这些产品都是假冒版本,与正版产品效果不同。
UPD1 Volume BOX
Vitaliy Kuznetsov
4.94 (16)
指标在指定区域显示水平音量分布 (BOX) 和最大音量 (POC). 产品特点 。 1. 您可以使用刻度或仅使用价格。 2. 自适应网格间距 (M1-MN) 。 3. 自适应大容量(Median)搜索步骤取决于框大小。 4. 框线和按钮的自动变色龙颜色。 5. 多个框,易于创建和删除 。 6. 70% 体积区域(在设置中启用) 。 7. 触碰最大水平音量线有提示 (POC) 。 8. VWAP 。 9. 控制面板 。 使用成交量配置指标探索市场。 我是为自己做的,但现在你也可以使用它。 主要设置 。 Calc Histo Mode – 直方图计算方法 (Market Profile – 按价格计算, Tick Volume Profile – 按刻度计算) 。 Mode Step In Pips – 按点计算中线 。 Vertical Step – 直方图的垂直步长(以点为单位的线之间的距离) 。 Data Source – 自动选择报价时间范围(最多 H1 从 M1 获取报价) 。 Touch First Bar - 打开以使扩展 POC 线在第一次触摸时停止 。 Hide B
TrendLine PRO MT4
Evgenii Aksenov
4.83 (168)
Trend Line PRO   指标是一个独立的交易策略。 它显示趋势变化,交易的入口点,以及自动计算三个级别的止盈和止损保护 Trend Line PRO  非常适合所有元交易者符号:货币,金属,加密货币,股票和指数 该指标用于真实账户交易,这证实了该策略的可靠性 您可以在这里找到使用   Trend Line PRO   和真实信号的机器人:   https://robomarket.org/product-category/signals/ 目前,Trend Line PRO指标的售价为75美元。 促销后价格为 149 美元 。 趋势线专业的优点 永远不要重绘它的信号; 将其作为独立策略的可能性; 它有三个自动水平止盈和止损水平  该指标具有iCustom信号缓冲区,允许您基于它创建交易机器人 具有通知功能 该指标已证明其在真实账户交易中的有效性 如何设置和优化趋势线PRO指标: 通过更改幅度参数以及 TP 和 SL 水平,将重点放在指标面板上的利润上 您可以使用以下方式自动优化指标参数: Optimizer Utility 详细说明(ENG): 这里 趋势线PRO指标如
PZ Trend Trading
PZ TRADING SLU
4.8 (5)
许多盈利交易者不仅知道如何识别市场趋势,而且也能把握趋势建立后的交易机会。 Pz 趋势交易 指标设计用来在趋势行情中尽可能的赚取利润。 已建立的趋势提供了一揽子交易机会,但大多数趋势交易指标完全忽视了它们,让交易者在趋势行情时完全不知道该如何做!一般趋势指标只通知有关的趋势变化,但根本不足以得到卓越的回报. Pz 趋势交易 指标比一般趋势指标显示多达 20 倍的交易 , 因为它注重所谓的市场时机。它不仅显示当前的市场趋势,也有回调,内柱线的突破和调整。它令您在趋势回调之后介入,安全的柱线内突破金字塔加仓,以及发现潜在的反转,和已知的调整。 趋势改变 一个趋势改变在市场方向变化时发生。趋势变化在图表上用带数字的彩色圆圈显示。蓝色 (1) 信号为上涨开始, 而红色 (1) 信号为下跌开始。趋势变化并非评估当前价格动作的结果, 它意味着交易设置是不定时地。如果您正确使用本指标, 在趋势变化时, 您将将已经入场 (参看下面的调整)。 回调 但凡趋势在运动中,行情上下抖动,盈利者收割利润,且其它参与者入场。趋势回调代表好的买入机会,通常是由主力获利离场导致。如果行情在回调后回归上行, 指标将
Basic Harmonic Patterns Dashboard
Mehran Sepah Mansoor
5 (3)
该仪表盘显示所选符号的最新可用谐波形态,因此您可以节省时间并提高效率 /  MT5 版本 。 免费指标:  Basic Harmonic Pattern 指标列 Symbol: 显示所选符号 Trend:   看涨或看跌 Pattern:  形态类型(Gartley、蝴蝶、蝙蝠、螃蟹、鲨鱼、Cypher 或 ABCD) Entry:   入口价格 SL: 止损价 TP1: 第一止盈价 TP2: 第二次获利价格 TP3: 第三次获利价格 Current price:  当前价格 Age (in bars): 最后绘制的模式的年龄 主要输入 Symbols : 从 "28 种主要货币对 "或 "选定符号 "中选择。 Selected Symbols : 希望监控的符号,用逗号分隔("EURUSD,GBPUSD,XAUUSD")。如果您的经纪商为货币对设置了后缀或前缀,您必须在以下两个参数中添加(货币对前缀或货币对后缀)。 Max Iteration: 调整模式的最大迭代次数(如果该值越小,则模式越少,性能越快;如果该值越大,则模式越多,性能越慢)。事实上,它的工作原理如下:如果该值
适用于 MT4 的 Crypto_Forex 指标“上吊线和倒锤线 Pro”,无需重绘,无延迟。 - “上吊线和倒锤线 Pro”指标是一款非常强大的价格行为交易指标。 - 指标可检测图表上的看涨倒锤线和看跌上吊线形态: - 看涨倒锤线 - 图表上显示蓝色箭头信号(见图)。 - 看跌上吊线 - 图表上显示红色箭头信号(见图)。 - 提供 PC 和移动端提醒。 - “上吊线和倒锤线 Pro”指标非常适合与支撑/阻力位和挂单结合使用。 - 指标具有信息显示功能 - 显示与其关联的外汇对的当前点差和隔夜利息。 - 信息显示还显示账户余额、净值和保证金。 - 信息显示可放置在图表的任意位置 . Click here to see high quality Trading Robots and Indicators! 本产品为独家产品,仅在本 MQL5 网站上提供。
Fibonacci Alert MT4 Pro
Idris Dsapi Douanla
斐波那契警报专业版 - MetaTrader 5 交易指标 斐波那契警报专业版是一款适用于 MetaTrader 5 和 4 的高级指标,能够自动监控图表上的斐波那契水平并实时发送警报。专为在技术分析中使用斐波那契回调的交易者提供专业解决方案。 高级版 FIBO ALERTS PRO 指标提供两个版本,兼容 MetaTrader 4 和 MetaTrader 5,适用于所有外汇经纪商和自营交易公司。 提供完整的用户手册,支持多国语言。 购买后,请发送私信以获取个性化跟进服务并收到详细手册。我们的支持团队将亲自指导您完成工具的设置与优化使用。 联系我们:vopiser77@gmail.com --- 核心功能 1. 多重斐波那契监控 · 同时监控最多 5 个不同的斐波那契对象 · 每个斐波那契对象可自定义名称 · 按斐波那契对象单独配置水平 2. 智能警报系统 · 终端警报:MetaTrader 5 或 4 内部通知 · 推送通知:移动设备警报(通过 MT5/MT4 应用) · 邮件警报:电子邮件通知 · 可自定义冷却时间:避免重复警报(默认 30 分钟) 3.
作者的更多信息
Extremum Reverse Bar
Yurij Izyumov
2.8 (5)
This indicator has been created for finding the probable reversal points of the symbol price. A small candlestick reversal pattern is used it its operation in conjunction with a filter of extremums. The indicator is not redrawn! If the extremum filter is disabled, the indicator shows all points that have a pattern. If the extremum filter is enabled, the condition works – if the history Previous bars 1 candles back contains higher candles and they are farther than the Previous bars 2 candle, such
FREE
First RSI level
Yurij Izyumov
4.5 (6)
First RSI level indicator analyzes and displays the level, at which the first crossing of the standard RSI maximum or minimum value took place for the subsequent definition of strong trends. The indicator allows you to track the beginning of a trend that does not follow the signals of the standard RSI trading strategy, for example, when the price rushes downwards after reaching an oversold level instead of reversing. In this case, we have to conclude that a strong trend is underway and the next
FREE
Time Levels for MT5
Yurij Izyumov
1 (1)
The indicator is designed for displaying the following price levels on the chart: Previous day's high and low. Previous week's high and low. Previous month's high and low. Each of the level types is customizable. In the indicator settings, you set line style, line color, enable or disable separate levels. Configurations ----Day------------------------------------------------- DayLevels   - enable/disable previous day's levels. WidthDayLines   - line width of daily levels. ColorDayLines   - line
FREE
Stable Trend MA
Yurij Izyumov
4.5 (2)
The indicator is based on a single Moving Average of a user-defined period. By analyzing the price movement of the price relative to this MA, and also by tracking all updates of the price Highs and Lows over the same period as the MA period, the indicator draws its own picture of the trend, avoiding the ever-breaking MA lines. Therefore, if the trend goes up, the line will also point upwards and will not change its direction even on small retracements, allowing to capture almost the entire trend
FREE
Time Levels
Yurij Izyumov
4.38 (8)
The indicator is designed for displaying the following price levels on the chart: Previous day's high and low. Previous week's high and low. Previous month's high and low. Each of the level types is customizable. In the indicator settings, you set line style, line color, enable or disable separate levels. The version of the exact same indicator but only with sound alerts there - Time Levels with Alerts . Configurations ----Day------------------------------------------------- DayLevels - enable/
FREE
Disconnect Alerts
Yurij Izyumov
5 (1)
If you execute or test an Expert Advisor on a laptop, personal computer or a VPS, you may face the situation when Internet connection is lost and the EA stops. Of course, this utility ( Disconnect Alerts ) will not help you restore the Internet connection, but it will gather the information and will send an alert to you about when and how long your terminal was without access to the Internet and did not actually work. After receiving such a notification, you can check your trades or think about
FREE
RSI vs Envelopes
Yurij Izyumov
2 (2)
This semaphore indicator is based in the standard RSI, which is applied over the Envelopes indicator that shows an envelope or envelope fluctuation borders. This is a version of RSI vs Envelopes Graph drawn in a separate window . A sell signal emerges when the upper envelope/border is broken by the RSI indicator from top to bottom. A buy signal emerges when the lower envelope/border is broken by the RSI indicator from bottom upwards. The indicator can draw arrows on the indicator, draw vertical
FREE
RSI 7TF
Yurij Izyumov
2.75 (4)
This is a multitimeframe RSI indicator defining trends, oversold/overbought zones, as well as all intersections of signal lines from different timeframes on a single chart using arrows and audio alerts. When working with standard RSI, we often need to examine data from all necessary timeframes simultaneously. RSI 7TF solves this issue. If you are only interested in audio signals when signal lines are crossed, then have a look at RSI Alerts . Attention! The indicator uses seven timeframes - M5, M
FREE
This indicator MA Alerts with Arrows gives you the opportunity to receive signals about the intersection of two moving averages (Moving Average), as well as signals about the price rollback to MA - to enter the transaction. Alert options: Sound and text alerts (alert). Push notification to the mobile terminal. Email notification (message to your e-mail).  Visual alert (arrows on the chart). The indicator has the following features: To display or hide the moving averages and arrows themselves.  T
Delta CCi MTF7
Yurij Izyumov
As the proper trading using CCI indicators requires the trader to monitor multiple timeframes and CCI indicators with different periods. For example - monitor the trend using CCI with the period of 100 or 200 ( slow CCI period ) on the H4 timeframe, and make entries based on the CCI with the period of 13 ( fast CCI period ) on the H1 timeframe. To facilitate this task, the Delta CCi MTF7 indicator was created, which implements monitoring the changes of the price movement trends as well as marks
RSI Alerts
Yurij Izyumov
5 (1)
RSI Alerts 是一款 MetaTrader 4 指标,为经典相对强弱指数(RSI)增加便捷的警报功能。您仍然可以看到 RSI 线和 30、50、70 水平,但当所选水平被突破时,指标可弹出警报、发送推送通知和邮件,不会错过可能的反转或突破。 基于什么? 该指标基于标准 RSI(Relative Strength Index)--即数百万交易者用来判断超买/超卖和动量变化的同一振荡器。RSI Alerts 不改变 RSI 公式;仅跟踪 RSI 线并在其突破所需水平时通知您。  超买区(如 70,可设)- 常用于寻找回调或做空入场  超卖区(如 30,可设)- 用于反弹或做多入场  中线(50)- 用于确认趋势或动量 您可自行选择对策略重要的突破方向。 主要功能  六种独立警报类型 - 每种可单独开关:    RSI 自下向上突破 70 水平(超买)    RSI 自上向下突破 70 水平    RSI 自下向上突破 30 水平(超卖)    RSI 自上向下突破 30 水平    RSI 自下向上突破 50 水平    RSI 自上向下突破 50 水平  时间过滤 - 仅在
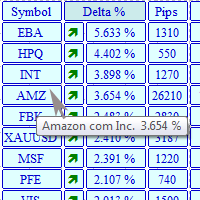
The MarketView utility is designed to display the market changes in percents as a table over the specified time interval. Every column element can be disabled. The color scheme can be easily and quickly customized for your needs. The number of symbols in columns can be adjusted ( PerColumn ). The MarketView also allows to open chart of any symbol by simply clicking its name. It can automatically apply any customized template to the newly opened chart. Attention! In order to remove any symbol fro
Extremum catcher
Yurij Izyumov
1 (1)
The Extremum catcher indicator analyzes the price action after breaking the local Highs and Lows, generates price reversal signals with the ability to plot the Price Channel. If you need the version for MetaTrader 5, see Extremum catcher MT5 . The indicator takes the High and Low of the price over the specified period - 24 bars by default (can be changed). Then, if on the previous candle the price broke the High or Low level and the new candle opened higher than the extremums, then a signal will
You can avoid constant monitoring of computer screen waiting for the DeMarker signal while receiving push notifications to a mobile terminal or a sound alert on the screen about all required events, by using this indicator - DeMarker Alerts. In fact, it is the replacement of the standard indicator with which you will never miss the oscillator signals. If you don't know the benefits of DeMarker or how to use it, please read here . If you need signals of a more popular RSI indicator, use RSI Alert
MFI Alerts
Yurij Izyumov
If you use the MFI (Money Flow Index) indicator, the waiting time till the next signal can be long enough. Now you can avoid sitting in front of the monitor by using MFI Alerts. This is an addition or a replacement to the standard MFI oscillator . Once there appears an MFI signal on the required level, the indicator will notify you with a sound or push, so you will never miss a signal. This is especially significant if you follow the indicator in different timeframes and currency pairs, which ca
CCI Alerts
Yurij Izyumov
When using CCI (Commodity Channel Index) oscillator, the waiting time till the next signal can be long enough depending on a timeframe. CCI Alerts indicator prevents you from missing the indicator signals. It is a good alternative for the standard CCI indicator. Once there appears a CCI signal on the required level, the indicator will notify you with a sound or push, so you will never miss an entry. This is especially significant if you follow the indicator in different timeframes and currency p
RSI Panel MTF
Yurij Izyumov
The RSI Panel MTF indicator has been created in order to have the ability to monitor the values of the standard RSI indicator from a multitude of timeframes and symbols on a single chart, as well as to receive timely notifications about the trading opportunities using an audio signal or a notification. The indicator can output both the indicator values, and only the indicator signals (confirmed and expected). A user-friendly feature for selecting the required symbol has been implemented - simply
This is an expanded version of the Time Levels indicator provided with sound alerts notifying of level intersection. The indicator is designed for displaying the following price levels on the chart: Previous day's high and low. Previous week's high and low. Previous month's high and low. Each of the level types is customizable. In the indicator settings, you set line style, line color, enable or disable separate levels. This version is provided with an option for alerting using an audio signal a
本指标用于绘制水平通道和信号区域,检测极值突破、反弹以及基于可自定义斐波那契水平的目标(可选声音提醒)。它会自动将您选择的斐波那契水平应用到这些极值上。当价格突破在设置中启用的斐波那契水平时,指标可播放声音、显示消息、向移动终端发送推送通知或发送电子邮件(若已启用)。 功能: 按时间范围自动构建通道,例如用于检测夜间区间的突破 自动跟踪新的反弹 反转斐波那契水平刻度 显示/隐藏/折叠控制面板 从 5 种面板界面语言中选择 为斐波那契水平添加容差,使其成为更宽的信号区域而非线条 在多个时间周期上绘制水平线和斐波那契,可保留或删除其他时间周期的通道 按 High/Low 或 Open/Close 价格构建通道;通道自动贴合价格 锁定通道(设为不可选)以防误删 设置 --------- 语言 ----------- Interface Language — 指标面板语言。English(英语)、Russian(俄语)、Spanish(西班牙语)、German(德语)、Italian(意大利语)。 --------- 设置 ----------- Auto build channel b
This is а modified oscillator CCI (Commodity Channel Index) with all sorts of signals, alerts and arrows. The indicator is designed so that any signal of crossing any specified level does not escape you. This is a supplemented version of the CCI Alerts Indicator, which does not draw the CCI indicator window, but only draws the result of its work as arrows on the symbol graph. This version of CCI Alerts with Arrows is for MetaTrader 4. If you need signals from another popular RSI indicator, then
The indicator is a modification of RSI Alerts . However, it does not have a separate RSI indicator window. Instead, it uses signal arrows on the price chart. This saves space on the symbol chart, without affecting the quality of received signals and alerts. Similar to RSI Alerts, the indicator can generate sound alert, send push notifications and email messages, as well as draw signal arrows. The display of arrow can be disabled. If the arrows are enabled, they only display the signals chosen in

本指标用于绘制水平通道和信号区域,检测极值突破、反弹以及基于可自定义斐波那契水平的目标(可选声音提醒)。它会自动将您选择的斐波那契水平应用到这些极值上。当价格突破在设置中启用的斐波那契水平时,指标可播放声音、显示消息、向移动终端发送推送通知或发送电子邮件(若已启用)。 功能: 按时间范围自动构建通道,例如用于检测夜间区间的突破 自动跟踪新的反弹 反转斐波那契水平刻度 显示/隐藏/折叠控制面板 从 5 种面板界面语言中选择 为斐波那契水平添加容差,使其成为更宽的信号区域而非线条 在多个时间周期上绘制水平线和斐波那契,可保留或删除其他时间周期的通道 按 High/Low 或 Open/Close 价格构建通道;通道自动贴合价格 锁定通道(设为不可选)以防误删 设置 --------- 语言 ----------- Interface Language — 指标面板语言。English(英语)、Russian(俄语)、Spanish(西班牙语)、German(德语)、Italian(意大利语)。 --------- 设置 ----------- Auto build channel b
RSI Alerts MT5
Yurij Izyumov
RSI Alerts 是一款 MetaTrader 5 指标,为经典相对强弱指数(RSI)增加便捷的警报功能。您仍然可以看到 RSI 线和 30、50、70 水平,但当所选水平被突破时,指标可弹出警报、发送推送通知和邮件,不会错过可能的反转或突破。 基于什么? 该指标基于标准 RSI(Relative Strength Index)--即数百万交易者用来判断超买/超卖和动量变化的同一振荡器。RSI Alerts 不改变 RSI 公式;仅跟踪 RSI 线并在其突破所需水平时通知您。 - 超买区(如 70,可设)- 常用于寻找回调或做空入场 - 超卖区(如 30,可设)- 用于反弹或做多入场 - 中线(50)- 用于确认趋势或动量 您可自行选择对策略重要的突破方向。 主要功能 - 六种独立警报类型 - 每种可单独开关:   - RSI 自下向上突破 70 水平(超买)   - RSI 自上向下突破 70 水平   - RSI 自下向上突破 30 水平(超卖)   - RSI 自上向下突破 30 水平   - RSI 自下向上突破 50 水平   - RSI 自上向下突破 50 水平
CCI Alerts MT5
Yurij Izyumov
When using CCI (Commodity Channel Index) oscillator, the waiting time till the next signal can be long enough depending on a timeframe. CCI Alerts indicator prevents you from missing the indicator signals. It is a good alternative for the standard CCI indicator. Once there appears a CCI signal on the required level, the indicator will notify you with a sound or push, so you will never miss an entry. This is especially significant if you follow the indicator in different timeframes and currency p
The Extremum catcher MT5 indicator analyzes the price action after breaking the local Highs and Lows and generates price reversal signals with the ability to plot the Price Channel. If you need the version for MetaTrader 4, see Extremum catcher . The indicator takes the High and Low of the price over the specified period - 24 bars by default (can be changed). Then, if on the previous candle, the price broke the High or Low level and the new candle opened higher than the extremums, then a signal
You can avoid constant monitoring of computer screen waiting for the DeMarker signal while receiving push notifications to a mobile terminal or a sound alert on the screen about all required events, by using this indicator - DeMarker Alerts. In fact, it is the replacement of the standard indicator with which you will never miss the oscillator signals. If you don't know the benefits of DeMarker or how to use it, please read here . If you need signals of a more popular RSI indicator, use RSI Alert
MFI Alerts MT5
Yurij Izyumov
5 (1)
If you use the MFI (Money Flow Index) indicator, the waiting time till the next signal can be long enough. Now you can avoid sitting in front of the monitor by using MFI Alerts. This is an addition or a replacement to the standard MFI oscillator . Once there appears an MFI signal on the required level, the indicator will notify you with a sound or push, so you will never miss a signal. This is especially significant if you follow the indicator in different timeframes and currency pairs, which ca
该指标是RSI警报指标的修改版本,但没有单独的RSI指标窗口,并且信号箭头直接显示在品种图表上。这样可以节省品种图表上的空间,同时不会损失接收到的信号和通知的质量。与RSI警报一样,该指标可以提供声音警报、推送通知,并增加了发送电子邮件消息的功能,以及在出现信号的位置绘制箭头。 箭头显示可以关闭。当开启时,它们只显示您在设置中激活的那些信号的箭头,例如 – 仅显示自下而上穿越70水平线和自上而下穿越30水平线,或者根据您的配置。所有设置都可以灵活调整,以满足您的任何偏好。 共有三个信号水平:上水平线(默认70)– 可根据您的需求更改,下水平线(默认30)– 可根据您的需求更改,以及中间水平线50 – 这是固定的。现在,如有必要,上下水平线不仅可以使用整数,还可以使用小数进行设置。 已实现的事件类型: 自上而下穿越水平线 – 上水平线、下水平线和中间水平线。 自下而上穿越水平线 – 上水平线、下水平线和中间水平线。 每个事件都可以根据您的交易风格,独立于其他事件启用或禁用。 指标设置 Enable alerts – 启用声音通知。 Enable arrows – 启用箭头显示。 Cros
筛选:
InspireForex Club
38
InspireForex Club 2022.03.02 18:47 
 

This is an amazing indicator if used correctly! Also, Yurij is an amazing person! I just asked him a favour and he did it without knowing me before. Thanks Yurij. You are the best!

wede
139
wede 2019.04.08 08:06 
 

用户没有留下任何评级信息

kubn2
661
kubn2 2016.12.10 13:25 
 

用户没有留下任何评级信息

回复评论