Horizontal Channel Alert with Custom Fibo MT5
- Indicateurs
- Version: 2.0
- Mise à jour: 4 février 2026
- Activations: 20

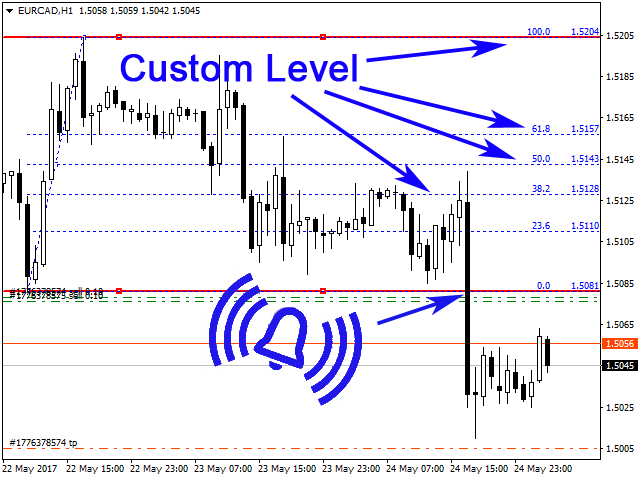
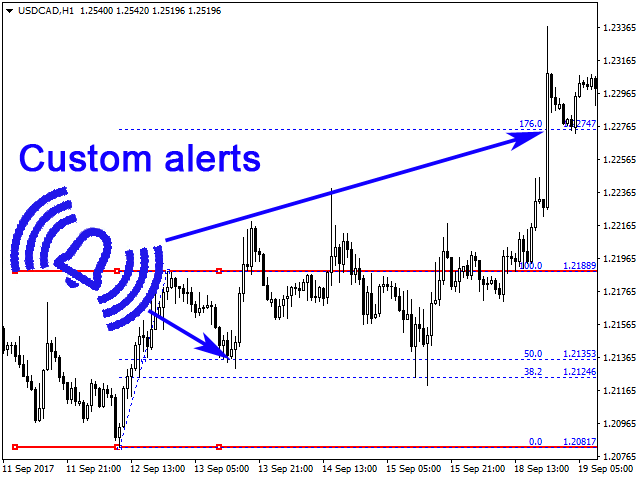
L'indicateur est conçu pour tracer des canaux horizontaux et des zones de signal, détecter les ruptures d'extrêmes, les rebonds et les objectifs basés sur des niveaux de Fibonacci personnalisables (avec ou sans alertes sonores). Il applique automatiquement les niveaux de Fibonacci choisis à ces extrêmes. Lorsque le prix franchit les niveaux de Fibonacci activés dans les paramètres, l'indicateur peut émettre un son, afficher un message, envoyer une notification push vers le terminal mobile ou un e-mail (si activé).
Fonctionnalités :
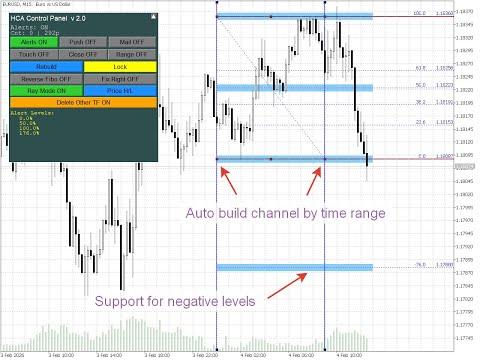
- construction automatique du canal par plage horaire, ex. pour détecter la rupture d'un range nocturne
- suivi automatique des nouveaux rebonds
- inverser l'échelle des niveaux de Fibonacci
- afficher/masquer/réduire le panneau de contrôle
- choisir l'une des 5 langues de l'interface du panneau
- ajouter une tolérance aux niveaux de Fibonacci pour en faire des zones de signal plus larges au lieu de lignes
- tracer des niveaux horizontaux et Fibonacci sur plusieurs timeframes, en conservant ou en supprimant les canaux des autres timeframes
- construire les canaux à partir des prix High/Low ou Open/Close ; le canal s'ajuste automatiquement aux prix
- verrouiller le canal (le rendre non sélectionnable) pour éviter une suppression accidentelle
Paramètres
--------- Langue -----------
- Interface Language — Langue du panneau de l'indicateur. English (anglais), Russian (russe), Spanish (espagnol), German (allemand), Italian (italien).
--------- Paramètres -----------
- Auto build channel by time range (broker time) — Construire le canal automatiquement sur une plage horaire (heure du courtier)
- Time range HH:MM-HH:MM — Plage horaire (début–fin)
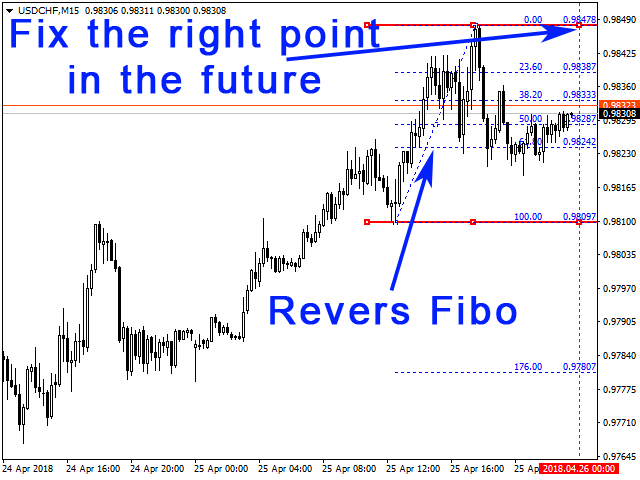
- Reverse Fibo — Inverser l'échelle de Fibonacci
- Fix the right point in the future (ignored when FixByTime) — Fixer le bord droit dans le futur (ignoré lorsque « Auto build channel by time range » est activé)
- Color Channel — Couleur du canal
- Color Fibo lines — Couleur des lignes de Fibonacci
- Channel Width — Épaisseur des lignes du canal en pixels
- Channel Length, bars — Longueur du canal en barres
- Channel ray — Tracer le canal en rayon
- Price Mode — Mode de prix : High/Low ou Open/Close
- Delete channels from other TF — Supprimer les canaux des autres timeframes
- Lock channel (prevent line movement) — Verrouiller le canal (empêcher le déplacement des lignes)
- Log channel auto-update (Experts tab) — Enregistrer la mise à jour automatique du canal (onglet Experts)
--------- Panneau de contrôle -----------
- Show control panel — Afficher le panneau de contrôle
- Panel X position (pixels from left edge) — Position X du panneau (pixels depuis le bord gauche)
- Panel Y position (pixels from top) — Position Y du panneau (pixels depuis le haut)
- Panel width (pixels) — Largeur du panneau (pixels)
- Panel height (pixels) — Hauteur du panneau (pixels)
--------- Paramètres des alertes -----------
- Alerts — Activer/désactiver les alertes
- Send Notifications — Envoyer les notifications
- Send alerts to e-mail — Envoyer les alertes par e-mail
- Alert only on first touch of level (for each direction) — Alerte uniquement au premier contact du niveau (par direction)
- Alert on candle close above/below level — Alerte à la clôture de la chandelle au-dessus/en-dessous du niveau
- Time-based alerts (N bars inside level range) — Alertes basées sur le temps (N barres dans la plage de niveaux)
- Bottom level of range, % — Niveau inférieur de la plage des alertes basées sur le temps, % (défaut 38,2)
- Top level of range, % — Niveau supérieur de la plage des alertes basées sur le temps, % (défaut 61,8)
- Number of consecutive bars inside range — Nombre de barres consécutives dans la plage des alertes basées sur le temps
- Limit Alerts — Limite des alertes
--------- Marqueurs d'alertes -----------
- Show alert markers on chart — Afficher les marqueurs d'alertes sur le graphique
- Alert marker color — Couleur du marqueur d'alerte
- Marker size (1-5) — Taille du marqueur (1–5)
- Maximum number of markers (0 = unlimited) — Nombre maximum de marqueurs (0 = illimité)
---- Lignes Fibo personnalisées (-1 = désactiver) ----
- Level 0 … Level 29, % — Valeurs pour le niveau 0 … niveau 29, %
- Alert level 0 … Alert level 29 — Activer/désactiver les alertes pour le niveau 0 … niveau 29
- Level 0 name … Level 29 name — Étiquette du niveau 0 … niveau 29
Conseils.
- Pour déplacer le canal à gauche ou à droite sans changer sa taille, faites glisser la partie centrale de la ligne supérieure ou inférieure du canal.
- Pour allonger ou raccourcir le canal, faites glisser l'extrémité gauche ou droite de la ligne supérieure ou inférieure du canal jusqu'à la position souhaitée puis relâchez.
- Si après avoir déplacé un bord du canal la ligne paraît désalignée, cliquez n'importe où sur le graphique avec le bouton gauche de la souris et le canal et les niveaux de Fibonacci se réaligneront.
- Pour inverser l'échelle de Fibonacci, activez Reverse Fibo.
- Pour suivre les rebonds automatiquement, activez Fix the right point in the future. Le bord gauche du canal reste fixe ; le bord droit suit la nouvelle barre.
- Si la construction automatique du canal par temps est activée (ex. pour la rupture d'un range), le canal n'est reconstruit automatiquement que par temps ; pour l'ajuster manuellement, désactivez ce paramètre.
- Avec Delete channels from other TF = false, le changement de timeframe conserve les canaux existants et ajoute un nouveau canal sur le timeframe sélectionné. Avec Delete channels from other TF = true (par défaut), le changement de timeframe supprime les anciens canaux et seul le nouveau canal sur le nouveau timeframe est tracé.
- Si vous utilisez les notifications Push, nous ne recommandons pas de définir Limit Alerts trop élevé ou illimité, car trop de notifications push depuis un compte peut amener le service MetaTrader à bloquer l'envoi.


Отличный инструмент! Спасибо!