Horizontal Channel Alert with Custom Fibo MT5
- 지표
- 버전: 2.0
- 업데이트됨: 4 2월 2026
- 활성화: 20

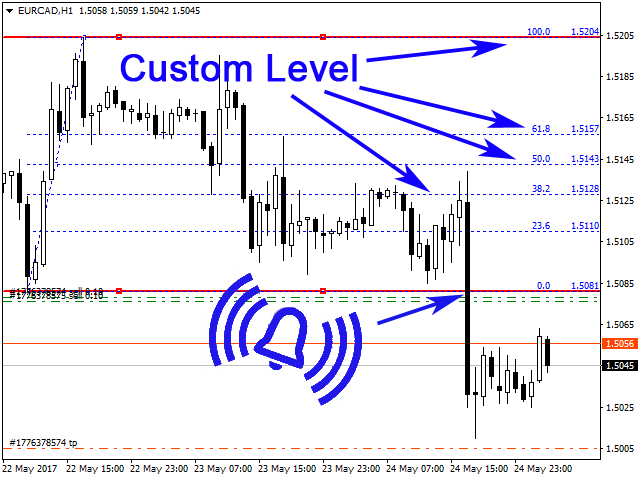
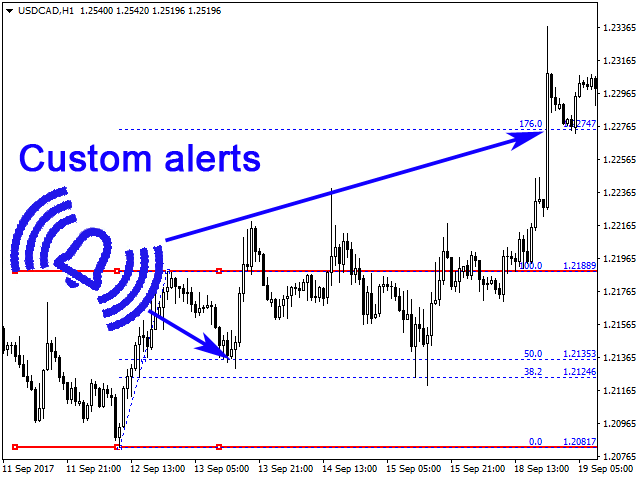
The indicator is designed for building horizontal channels and signal zones, detecting breakouts of extremes, bounces and targets based on custom Fibonacci levels (with or without sound alerts). It automatically applies your chosen Fibonacci levels to those extremes. When price breaks the Fibonacci levels enabled in the settings, the indicator can play a sound, show a message, send a push notification to your mobile terminal or an email (if enabled).
Features:
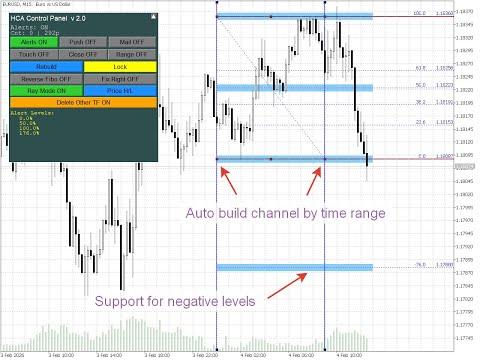
- automatic channel building by time range, e.g. for detecting breakout from overnight range
- automatic tracking of new bounces
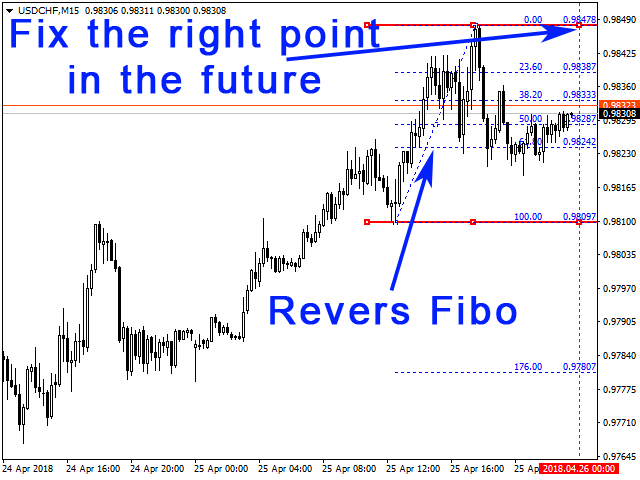
- reverse the Fibonacci level scale
- show/hide/collapse the control panel
- choose one of 5 panel interface languages
- add tolerance to Fibonacci levels so they become wider signal zones instead of lines
- draw horizontal levels and Fibonacci on several timeframes, keeping or deleting channels from other timeframes
- build channels from either High/Low or Open/Close prices; the channel snaps to prices automatically
- lock the channel (make it non-selectable) to avoid accidental deletion
Settings
--------- Language -----------
- Interface Language — Language of the indicator panel. English, Russian, Spanish, German, Italian.
--------- Settings -----------
- Auto build channel by time range (broker time) — Build channel automatically over a time range (broker time)
- Time range HH:MM-HH:MM — Time range (start–end)
- Reverse Fibo — Reverse Fibonacci scale
- Fix the right point in the future (ignored when FixByTime) — Fix the right edge in the future (ignored when Auto build channel by time range is on)
- Color Channel — Channel colour
- Color Fibo lines — Fibonacci line colour
- Channel Width — Channel line width in pixels
- Channel Length, bars — Channel length in bars
- Channel ray — Draw channel as a ray
- Price Mode — Price mode: High/Low or Open/Close
- Delete channels from other TF — Delete channels from other timeframes
- Lock channel (prevent line movement) — Lock channel (prevent moving lines)
- Log channel auto-update (Experts tab) — Log channel auto-update (Experts tab)
--------- Control Panel -----------
- Show control panel — Show control panel
- Panel X position (pixels from left edge) — Panel X position (pixels from left edge)
- Panel Y position (pixels from top) — Panel Y position (pixels from top)
- Panel width (pixels) — Panel width (pixels)
- Panel height (pixels) — Panel height (pixels)
--------- Alert settings -----------
- Alerts — Enable/disable alerts
- Send Notifications — Send notifications
- Send alerts to e-mail — Send alerts by e-mail
- Alert only on first touch of level (for each direction) — Alert only on first touch of level (per direction)
- Alert on candle close above/below level — Alert on candle close above/below level
- Time-based alerts (N bars inside level range) — Time-based alerts (N bars inside level range)
- Bottom level of range, % — Bottom level of Time-based alerts range, % (default 38.2)
- Top level of range, % — Top level of Time-based alerts range, % (default 61.8)
- Number of consecutive bars inside range — Number of consecutive bars inside Time-based alerts range
- Limit Alerts — Alert limit
--------- Alert Markers -----------
- Show alert markers on chart — Show alert markers on chart
- Alert marker color — Alert marker colour
- Marker size (1-5) — Marker size (1–5)
- Maximum number of markers (0 = unlimited) — Maximum number of markers (0 = unlimited)
---- Custom Fibo Lines (-1 = disable) ----
- Level 0 … Level 29, % — Values for level 0 … level 29, %
- Alert level 0 … Alert level 29 — Enable/disable alerts for level 0 … level 29
- Level 0 name … Level 29 name — Label for level 0 … level 29
Tips.
- To move the channel left or right without changing its size, drag the central part of the upper or lower channel line.
- To lengthen or shorten the channel, drag the left or right end of the upper or lower channel line to the desired position and release.
- If after dragging a channel edge the line looks misaligned, click anywhere on the chart with the left mouse button and the channel and Fibonacci levels will realign.
- To reverse the Fibonacci scale, enable Reverse Fibo.
- To track bounces automatically, enable Fix the right point in the future. The left edge of the channel stays fixed; the right edge stays at the new bar.
- If automatic channel building by time is enabled (e.g. for breakout from a range), the channel is only rebuilt automatically by time; to adjust it manually, disable that setting.
- With Delete channels from other TF = false, switching timeframes keeps existing channels and adds a new channel on the selected timeframe. With Delete channels from other TF = true (default), switching timeframes removes old channels and only the new channel on the new timeframe is drawn.
- If you use Push notifications, we do not recommend setting Limit Alerts very high or unlimited, because too many push notifications from one account may cause the MetaTrader service to block further delivery.


Отличный инструмент! Спасибо!