Horizontal Channel Alert with Custom Fibo MT5
- Indicatori
- Versione: 2.0
- Aggiornato: 4 febbraio 2026
- Attivazioni: 20

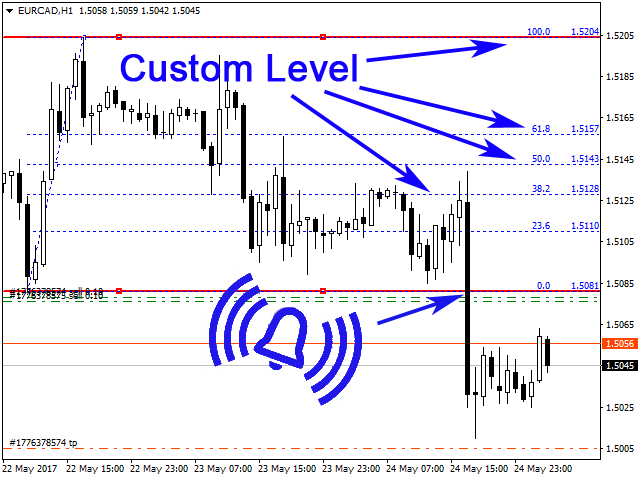
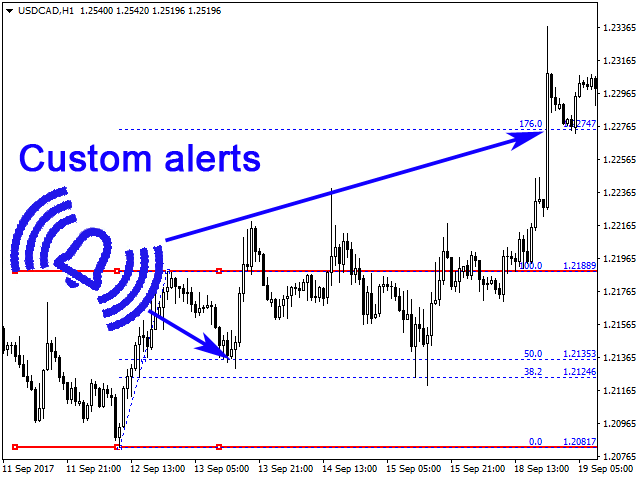
L'indicatore serve a disegnare canali orizzontali e zone di segnale, rilevare rotture di estremi, rimbalzi e obiettivi su livelli di Fibonacci personalizzabili, con o senza alert sonori. Applica automaticamente i livelli di Fibonacci scelti a tali estremi. Quando il prezzo rompe i livelli di Fibonacci attivati nelle impostazioni, l'indicatore può emettere un suono, mostrare un messaggio, inviare una notifica push al terminale mobile o un'email (se attivato).
Possibilità:
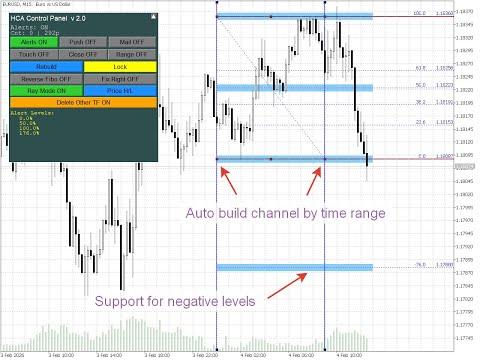
- costruzione automatica del canale per intervallo orario, ad es. per rilevare la rottura del range notturno
- seguimento automatico di nuovi rimbalzi
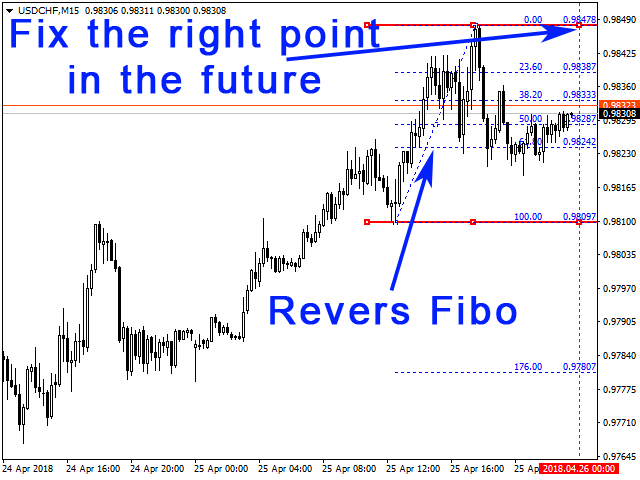
- invertire la scala di Fibonacci
- mostrare/nascondere/ridurre a icona il pannello di controllo
- scegliere una delle 5 lingue dell'interfaccia del pannello
- aggiungere tolleranza ai livelli di Fibonacci per avere zone di segnale più ampie invece di linee
- disegnare livelli orizzontali e Fibonacci su più timeframe, mantenendo o cancellando i canali degli altri timeframe
- costruire canali sia con prezzi High/Low sia Open/Close; il canale si allinea automaticamente ai prezzi
- bloccare il canale (renderlo non selezionabile) per evitare di cancellarlo per errore
Impostazioni
--------- Lingua -----------
- Interface Language — Lingua del pannello dell'indicatore. English (inglese), Russian (russo), Spanish (spagnolo), German (tedesco), Italian (italiano).
--------- Impostazioni -----------
- Auto build channel by time range (broker time) — Costruire canale automaticamente per intervallo orario (ora del broker)
- Time range HH:MM-HH:MM — Intervallo orario (inizio–fine)
- Reverse Fibo — Inverti scala di Fibonacci
- Fix the right point in the future (ignored when FixByTime) — Fissa il bordo destro nel futuro (ignorato con «Auto build channel by time range» attivo)
- Color Channel — Colore del canale
- Color Fibo lines — Colore delle linee di Fibonacci
- Channel Width — Spessore delle linee del canale in pixel
- Channel Length, bars — Lunghezza del canale in barre
- Channel ray — Disegna canale a raggio
- Price Mode — Modo prezzo: High/Low o Open/Close
- Delete channels from other TF — Elimina canali da altri timeframe
- Lock channel (prevent line movement) — Blocca canale (impedisce lo spostamento delle linee)
- Log channel auto-update (Experts tab) — Registra aggiornamento automatico del canale (scheda Esperti)
--------- Pannello di controllo -----------
- Show control panel — Mostra pannello di controllo
- Panel X position (pixels from left edge) — Posizione X del pannello (pixel dal bordo sinistro)
- Panel Y position (pixels from top) — Posizione Y del pannello (pixel dall'alto)
- Panel width (pixels) — Larghezza del pannello (pixel)
- Panel height (pixels) — Altezza del pannello (pixel)
--------- Impostazioni alert -----------
- Alerts — Attiva/disattiva alert
- Send Notifications — Invia notifiche
- Send alerts to e-mail — Invia alert via email
- Alert only on first touch of level (for each direction) — Alert solo al primo tocco del livello (per ogni direzione)
- Alert on candle close above/below level — Alert alla chiusura candela sopra/sotto il livello
- Time-based alerts (N bars inside level range) — Alert basati sul tempo (N barre nel range di livelli)
- Bottom level of range, % — Livello inferiore del range degli alert basati sul tempo, % (predefinito 38,2)
- Top level of range, % — Livello superiore del range degli alert basati sul tempo, % (predefinito 61,8)
- Number of consecutive bars inside range — Numero di barre consecutive nel range degli alert basati sul tempo
- Limit Alerts — Limite alert
--------- Marcatori alert -----------
- Show alert markers on chart — Mostra marcatori alert sul grafico
- Alert marker color — Colore del marcatore alert
- Marker size (1-5) — Dimensione del marcatore (1–5)
- Maximum number of markers (0 = unlimited) — Numero massimo di marcatori (0 = illimitato)
---- Linee Fibo personalizzate (-1 = disattiva) ----
- Level 0 … Level 29, % — Valori per livello 0 … livello 29, %
- Alert level 0 … Alert level 29 — Attiva/disattiva alert per livello 0 … livello 29
- Level 0 name … Level 29 name — Etichetta per livello 0 … livello 29
Suggerimenti.
- Per spostare il canale a sinistra o destra senza cambiarne la dimensione, trascinare la parte centrale della linea superiore o inferiore del canale.
- Per allungare o accorciare il canale, trascinare l’estremità sinistra o destra della linea superiore o inferiore del canale fino alla posizione desiderata e rilasciare.
- Se dopo aver trascinato un bordo del canale la linea risulta disallineata, cliccare con il pulsante sinistro del mouse in un punto qualsiasi del grafico e canale e livelli di Fibonacci si riallineeranno.
- Per invertire la scala di Fibonacci, attivare Reverse Fibo.
- Per seguire i rimbalzi automaticamente, attivare Fix the right point in the future. Il bordo sinistro del canale resta fisso; quello destro segue la nuova barra.
- Se è attiva la costruzione automatica del canale per tempo (es. per rottura di un range), il canale viene ricostruito solo automaticamente per tempo; per modificarlo a mano, disattivare quell’opzione.
- Con Delete channels from other TF = false, cambiando timeframe i canali esistenti restano e si aggiunge un nuovo canale sul timeframe scelto. Con Delete channels from other TF = true (predefinito), cambiando timeframe i canali vecchi vengono eliminati e si disegna solo il nuovo canale sul nuovo timeframe.
- Se si usano le notifiche push, non si consiglia di impostare Limit Alerts troppo alto o illimitato, perché troppe notifiche push da un account possono far sì che il servizio MetaTrader limiti l’invio.


Отличный инструмент! Спасибо!