Horizontal Channel Alert with Custom Fibo MT5
- Indicadores
- Versión: 2.0
- Actualizado: 4 febrero 2026
- Activaciones: 20

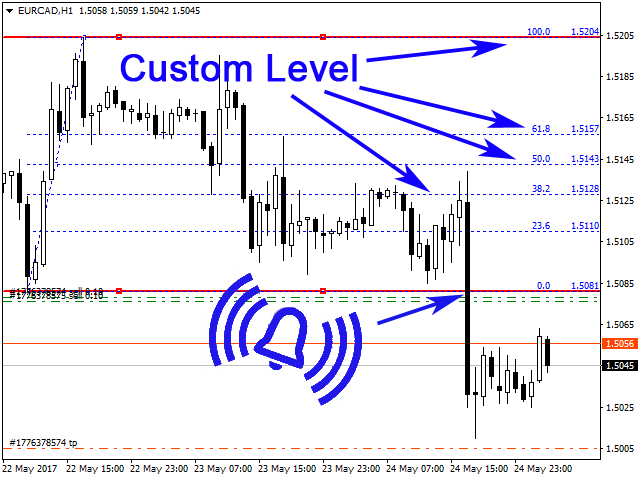
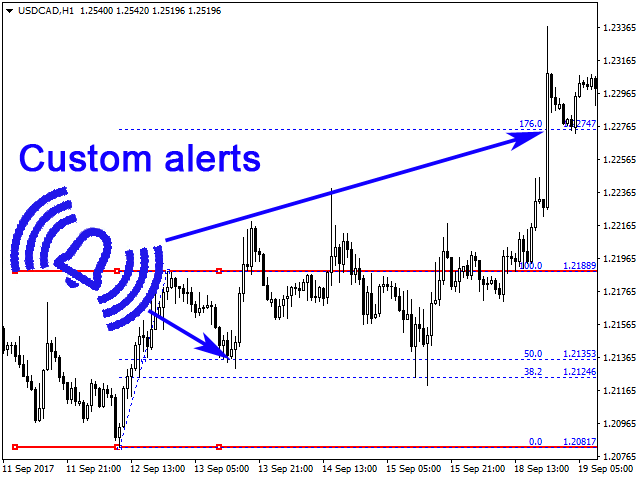
El indicador está pensado para dibujar canales horizontales y zonas de señal, detectar rupturas de extremos, rebotes y objetivos según niveles de Fibonacci personalizables, con o sin alertas sonoras. Aplica automáticamente los niveles de Fibonacci elegidos a esos extremos. Cuando el precio rompe los niveles de Fibonacci activados en los ajustes, el indicador puede emitir sonido, mostrar un mensaje, enviar una notificación push al terminal móvil o un correo electrónico (si está activado).
Posibilidades:
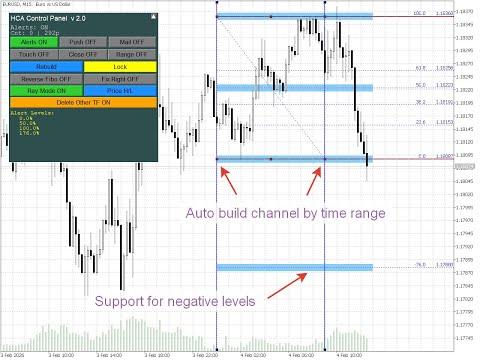
- construcción automática del canal por rango horario, por ejemplo para detectar la ruptura del rango nocturno
- seguimiento automático de nuevos rebotes
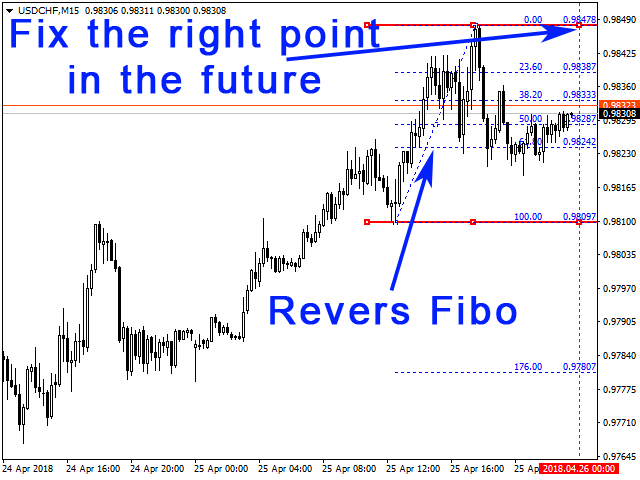
- invertir la escala de Fibonacci
- mostrar/ocultar/contraer el panel de control
- elegir uno de los 5 idiomas de la interfaz del panel
- añadir tolerancia a los niveles de Fibonacci para que sean zonas de señal más anchas en lugar de líneas
- dibujar niveles horizontales y Fibonacci en varios marcos temporales, conservando o borrando canales de otros marcos
- construir canales por precios High/Low o Open/Close; el canal se ajusta automáticamente a los precios
- bloquear el canal (hacerlo no seleccionable) para evitar borrarlo por error
Ajustes
--------- Idioma -----------
- Interface Language — Idioma del panel del indicador. English (inglés), Russian (ruso), Spanish (español), German (alemán), Italian (italiano).
--------- Ajustes -----------
- Auto build channel by time range (broker time) — Construir canal automáticamente por rango horario (hora del broker)
- Time range HH:MM-HH:MM — Rango horario (inicio–fin)
- Reverse Fibo — Invertir escala de Fibonacci
- Fix the right point in the future (ignored when FixByTime) — Fijar el borde derecho en el futuro (se ignora con «Auto build channel by time range» activado)
- Color Channel — Color del canal
- Color Fibo lines — Color de las líneas de Fibonacci
- Channel Width — Grosor de las líneas del canal en píxeles
- Channel Length, bars — Longitud del canal en barras
- Channel ray — Dibujar canal en rayo
- Price Mode — Modo de precio: High/Low u Open/Close
- Delete channels from other TF — Borrar canales de otros marcos temporales
- Lock channel (prevent line movement) — Bloquear canal (impedir mover líneas)
- Log channel auto-update (Experts tab) — Registrar actualización automática del canal (pestaña Expertos)
--------- Panel de control -----------
- Show control panel — Mostrar panel de control
- Panel X position (pixels from left edge) — Posición X del panel (píxeles desde el borde izquierdo)
- Panel Y position (pixels from top) — Posición Y del panel (píxeles desde arriba)
- Panel width (pixels) — Ancho del panel (píxeles)
- Panel height (pixels) — Alto del panel (píxeles)
--------- Ajustes de alertas -----------
- Alerts — Activar/desactivar alertas
- Send Notifications — Enviar notificaciones
- Send alerts to e-mail — Enviar alertas por correo electrónico
- Alert only on first touch of level (for each direction) — Alerta solo en el primer contacto del nivel (por cada dirección)
- Alert on candle close above/below level — Alerta al cierre de vela por encima/debajo del nivel
- Time-based alerts (N bars inside level range) — Alertas por tiempo (N barras dentro del rango de niveles)
- Bottom level of range, % — Nivel inferior del rango de alertas por tiempo, % (por defecto 38,2)
- Top level of range, % — Nivel superior del rango de alertas por tiempo, % (por defecto 61,8)
- Number of consecutive bars inside range — Número de barras consecutivas dentro del rango de alertas por tiempo
- Limit Alerts — Límite de alertas
--------- Marcadores de alertas -----------
- Show alert markers on chart — Mostrar marcadores de alertas en el gráfico
- Alert marker color — Color del marcador de alerta
- Marker size (1-5) — Tamaño del marcador (1–5)
- Maximum number of markers (0 = unlimited) — Número máximo de marcadores (0 = ilimitado)
---- Líneas Fibo personalizadas (-1 = desactivar) ----
- Level 0 … Level 29, % — Valores para el nivel 0 … nivel 29, %
- Alert level 0 … Alert level 29 — Activar/desactivar alertas para el nivel 0 … nivel 29
- Level 0 name … Level 29 name — Etiqueta del nivel 0 … nivel 29
Consejos.
- Para mover el canal a izquierda o derecha sin cambiar su tamaño, arrastre la parte central de la línea superior o inferior del canal.
- Para alargar o acortar el canal, arrastre el extremo izquierdo o derecho de la línea superior o inferior del canal hasta la posición deseada y suelte.
- Si tras arrastrar un borde del canal la línea queda desalineada, haga clic en cualquier punto del gráfico con el botón izquierdo del ratón y el canal y los niveles de Fibonacci se realinearán.
- Para invertir la escala de Fibonacci, active Reverse Fibo.
- Para seguir rebotes automáticamente, active Fix the right point in the future. El borde izquierdo del canal queda fijo; el derecho sigue a la nueva barra.
- Si está activada la construcción automática del canal por tiempo (p. ej. para ruptura de un rango), el canal solo se reconstruye automáticamente por tiempo; para ajustarlo a mano, desactive esa opción.
- Con Delete channels from other TF = false, al cambiar de marco temporal se conservan los canales existentes y se añade un nuevo canal en el marco elegido. Con Delete channels from other TF = true (por defecto), al cambiar de marco temporal se eliminan los canales antiguos y solo se dibuja el nuevo canal en el nuevo marco.
- Si usa notificaciones push, no recomendamos poner Limit Alerts muy alto o ilimitado, ya que demasiadas notificaciones push desde una cuenta pueden hacer que el servicio MetaTrader restrinja el envío.


Отличный инструмент! Спасибо!