ADR Reversal Indicator
- 指标
- 版本: 1.50
- 更新: 22 四月 2025
- 激活: 20

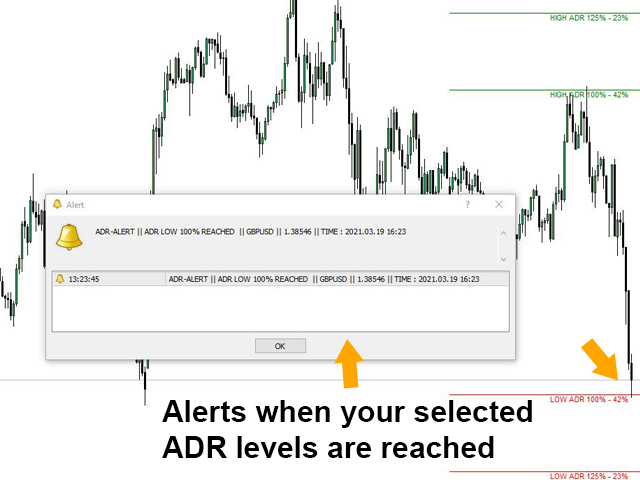
ADR 反轉指標一目了然地顯示當前價格相對於其正常平均每日範圍的交易位置。當價格超過您選擇的平均範圍和高於它的水平時,您將通過彈出窗口、電子郵件或推送獲得即時警報,以便您可以快速跳入回調和反轉。該指標在圖表上在平均每日範圍極值處繪製水平線,並在這些水平之上延伸,這些水平附加了價格超過它們的數學概率。下面的更多細節......
ADR 警報儀表板補充指標並監控所有配對也可在此處獲得:https://www.mql5.com/en/market/product/62756
MT5 版本也可在此處獲得:https://www.mql5.com/en/market/product/64477/
大約 60% 的時間價格在其正常的平均每日範圍 (ADR) 內交易並推高這些水平通常是價格急劇波動的指標,通常會出現回調(獲利了結)走勢。您可以通過交易從每日範圍的頂部或底部回落到最近的支撐位或阻力位來利用這些急劇波動。
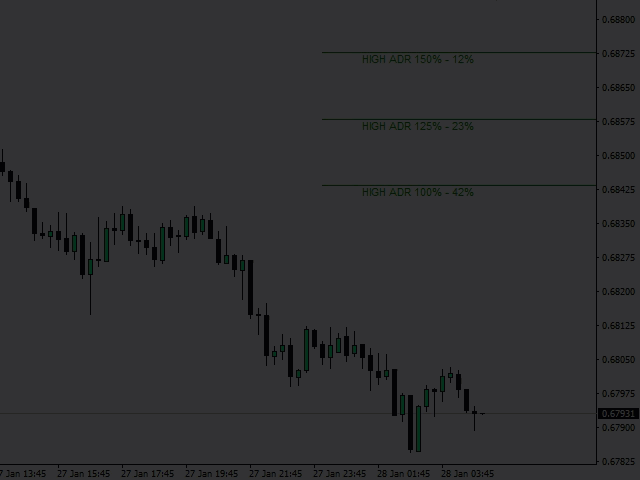
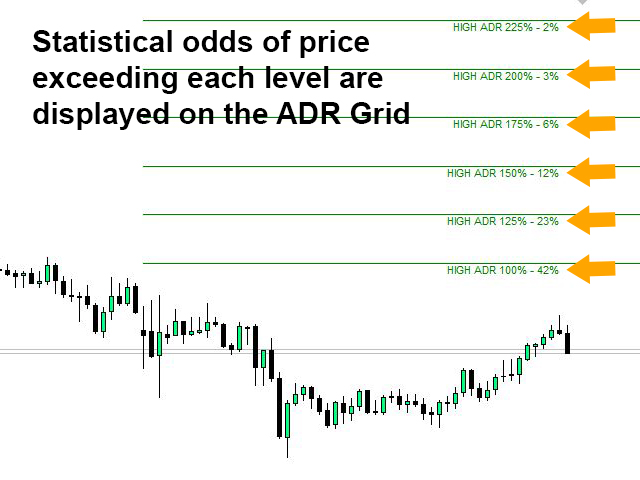
收集了超過 20 年的歷史數據,以找出主要外匯對和一系列交叉盤的價格超出特定 ADR 水平的平均百分比。該數據表明價格僅在 3% 的時間內超過其 ADR 的 200%,這意味著您在該水平反轉或回調的機率為 97%!!!
這些是數據顯示的 ADR 擴展平均值:
大約 42% 的時間,價格超過了 ADR10 的 100%。
價格在大約 23% 的時間內超過了 ADR10 的 125%。
價格在大約 12% 的時間內超過了 ADR10 的 150%。
價格在大約 6% 的時間內超過了 ADR10 的 175%。
價格在大約 3% 的時間內超過 ADR10 的 200%。
價格在大約 2% 的時間內超過 ADR10 的 225%。
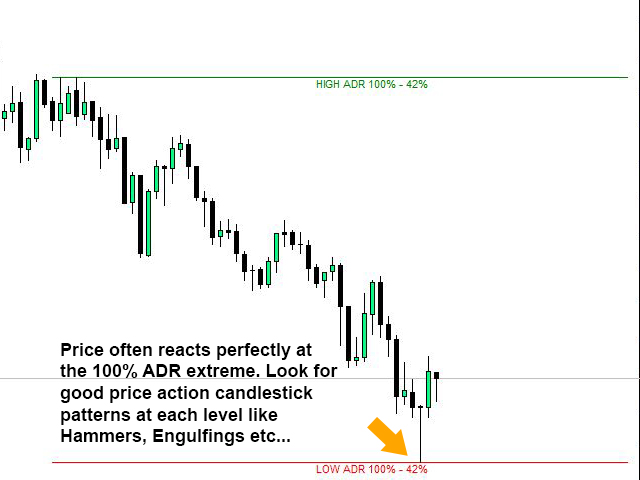
正如您從上面的水平所看到的,如果價格達到正常 ADR 的 150%,那麼它進一步上漲的機率只有 12%,從而為您帶來巨大的優勢。等待價格走勢向您顯示該水平的轉折跡象並在回調中跳入!
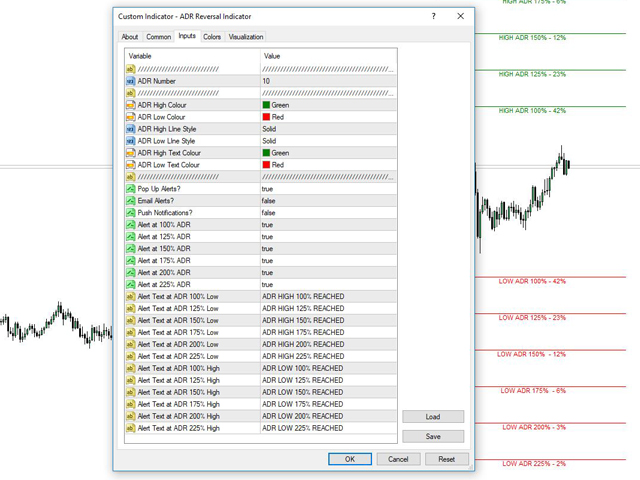
指標設置:
選擇您要使用的 ADR 編號。注:以上統計數據基於 ADR10 數據。
為 ADR 級別選擇線條的顏色和样式。
選擇您希望從彈出窗口、電子郵件或推送警報中接收的警報類型。
如果您只想在特定的 ADR 極端情況下接收警報,可選擇打開或關閉每個級別。
選擇每個級別的警報文本。
進入策略理念:
等待價格達到特定水平並收到警報。級別越高,反轉的機會就越大,但您收到的警報就越少。當您收到警報時,您可以等待形成良好的價格走勢燭台模式(吞沒、錘子、流星等),或者您可能想要使用 EMA9 等緊縮 EMA 並跳入。M5 或 M15 是使用的最佳時間框架。
這些交易旨在進行剝頭皮交易,因此理想地針對可能充當支撐或阻力水平的最近高點或低點。這些 ADR 警報通常發生在倫敦或紐約時段,因此瞄準亞洲時段的高點和低點通常是一個好主意。
網格交易 ADR 水平:
許多人使用 ADR 進行網格交易。在選定的 ADR 水平(100%、150%、200% 等)輸入小頭寸,然後隨著價格超過這些水平,您每次觸發新交易時都會獲得一個更高平均水平的頭寸。然後,這允許在回調中獲得更多利潤,並允許比僅持有的第一個頭寸更高的平均價格入場。
關於 ADR 的其他說明:
小心在基本新聞事件之後發生的 ADR 擴展。這些有時可能是新的多日推動的開始,回調或逆轉的機會較小。
當您收到 ADR 警報時,請注意價格水平。如果有一個最近的水平剛剛被突破,它通常是止損的一個指標。市場只是在推動人們止損,回調或逆轉的可能性更大。


A good Indicator. Thank you.