Stochastic Dashboard
- 指标
- 版本: 2.10
- 更新: 25 八月 2018
- 激活: 5

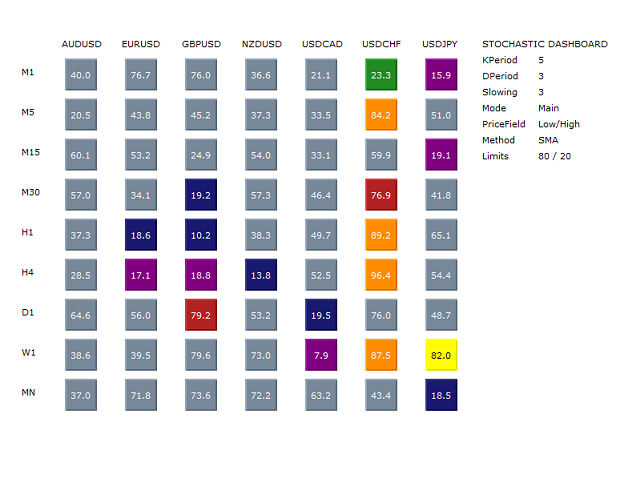
Stochastic Dashboard is an information panel which allows you to have a global market vision through a stochastic indicator.
Stochastic Dashboard analyzes and tracks all the assets you want to invest in. Take advantage of this useful dashboard where you can open in a few seconds the chart and quickly invest in it.
Main features of Stochastic Dashboard
- Graphical panel that allows you to know the situation of many assets.
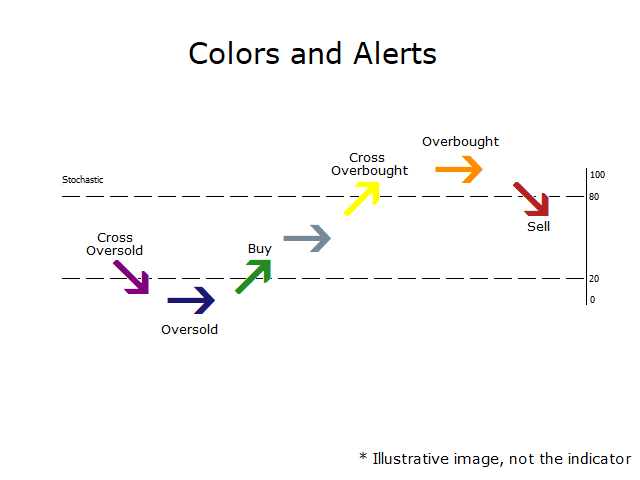
- 7 different stochastic situations to discover when an asset is overbought or oversold.
- Alerts, mails and notifications that enable the possibility to look for new market opportunities.
- All the stochastic inputs are 100% customizable, including overbought and oversold levels.
- You can also select if you want the calculation to be done when the candle has closed or you want to be done with the current candle.
How the indicator works
The colors and alert messages of the indicator, are represented by the image “Colors and Alerts”.
All alerts will notify you of the situation once per candle. If the overbought or oversold signals are activated, alerts will be sent while the indicator is in that zone. The demo version is limited to a single asset because of the limitations of the strategy tester.
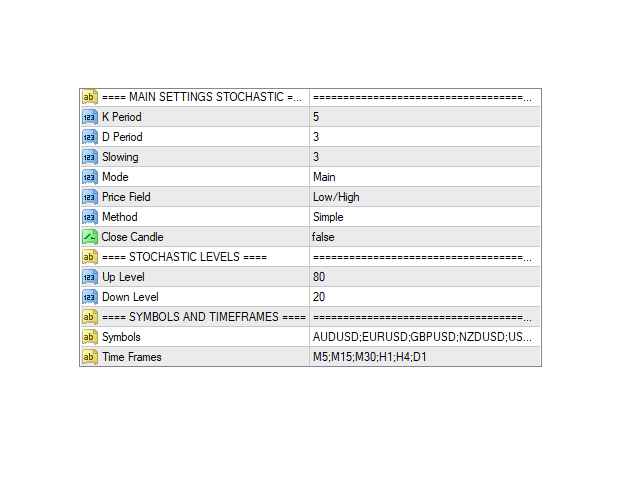
Inputs
- Main Settings Stochastic
- K Period
- D Period
- Slowing
- Mode (Main or Signal)
- Price Field (Low/High or Close/Close)
- Method (Simple, Exponential, Smoothed or Linear Weighted)
- Close Candle (Stochastics are shown with closed candle or with current candle)
- Stochastic Levels
- Up Level
- Down Level
- Symbols and TimeFrames
- Symbols (symbols to be shown separated by ";" and without spaces)
- Time Frames (timeframes to be shown separated by ";" and without spaces - M1, M5, M15, M30, H1, H4, D1, W1 and MN)
- Alerts and Mails
- Buy/Sell Alert, Mail or Notification (turn alerts on or off)
- Overbought/Sold Alert, Mail or Notification (turn alerts on or off)
- Cross Overbought/Sold Alert, Mail or Notification (turn alerts on or off)
- Graphs
- Font Color
- Display Indicator Data (activate or deactivate the lateral information relative to stochastic and its configuration)
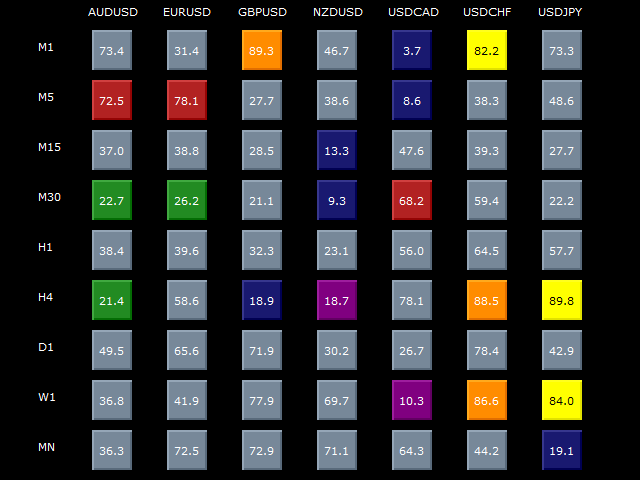


This is a great indicator to spot 'clusters' of overbought'
or 'oversold' pairs and other instruments from a stochastics point of view.
My only resrvation it the size of the indicator
- the buttons, text and spacing could be half their size
- any plans to modify / updgrade to allow more user control over these
- as inputs - that would really top off a great indicator
cheers