Pin Bar Indicator free
- 指标
- 版本: 1.0

The Free Pin Bar MT4 indicator identifies Pin Bars It will even give you sound or email alerts if want them.
If you download it and like it please leave a review! It would be wonderful
Pin Bars are purely based on price action as reflected by the candle formations created by Forex price movements.
input Parameters are
- maximum allowed body/length ratio for the Nose bar.
- Nose body should be position in top (bottom for bearish pattern) part of the Nose bar.
- tells the indicator that the Left Eye bar should be bearish for bullish Pinbar, and bullish for bearish Pinbar.
- tells the indicator that the Nose bar should be of the same direction as the pattern itself.
- tells the indicator that the Nose body should be inside the Left Eye body.
- minimum size of the Left Eye body relative to the bar length.
- minimum protrusion of the Nose bar relative to the bar length.
- maximum size of the Nose body relative to the Left eye body.
- minimum Nose length relative to the Left Eye length.
- minimum depth of the Left Eye relative to its length. Depth is length of the part of the bar behind the Nose.
Usage
The best way to use the pinbar pattern in as an early reversal indicator in conjuction with support/resistance or relative maximum or minimum. The pinbar should be utilized to identify strong supply/demand area. Best is to use the pinbar on M15 upward. Avoid trading on any pinbar if not in conjuction with support/resistance.The stop loss shoudl be positioned 10 to 15 pips above the pinbar. For take profit a trailing stop can be used as this kind of pattern can identify long movements.
Tranding pairs like EUR/USD or USD/JPY are in general good option for pinbar pattern.
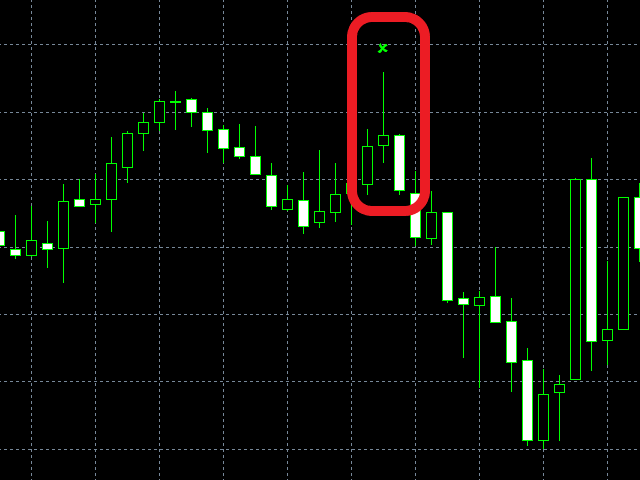


It is a tool that can detect and highlight pinbars. I am currently considering building a trading system using this tool. I will apply it after confirming the superiority in the back test. thank you.