
Chuvashov 的叉子机械交易系统
“为了产生趋势线,我们对最新的值感兴趣”——
Thomas DeMark
简介
Stanislav Chuvashov 提出了一种利用“Chuvashov 的叉子”形态的外汇交易技术。 在该技术中,市场分析的方法跟 DeMark 为最近的时间间隔绘制趋势线的方法有一些共同之处。
1. 绘制“Chuvashov 的叉子”形态线的方法
绘制“Chuvashov 的叉子”时使用了分形指标。 绘制的主趋势线经过两个邻近的分形 1 和 2,如价格图表所示(参见下图)。 主上涨趋势线基于下分形绘制,主下跌趋势线基于上分形绘制。
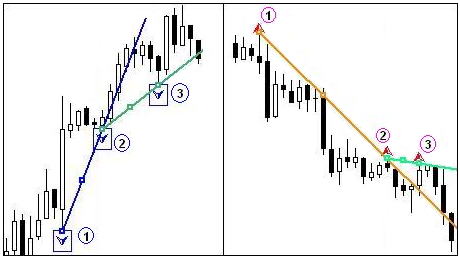
图 1 绘制“Chuvashov 的叉子”形态
主趋势线在趋势的反方向突破后形成类似的分形 3 之前,我们应该等待。 所绘制的经过分形 2 和 3 的侧线和主趋势线一起形成了“Chuvashov 的叉子”(CF)形态。 这是由发明者 Stanislav Chuvashov 给定的名称。
CF 形态的主要要求是叉子的侧线必须跟趋势方向一致。 穿越侧线会产生信号:在上涨趋势卖出以及在下跌趋势买入。
下面是“Chuvashov 的叉子”形态的形成过程,以 EURUSD 在连续 4 天内的 H1 上为例。
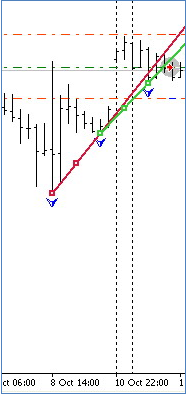
图 2 “Chuvashov 的叉子”形态的形成
图 2 显示了上涨趋势中“Chuvashov 的叉子”形态的产生,表示趋势的终结或趋势即将走平。 РњРўS 打开了卖出头寸。
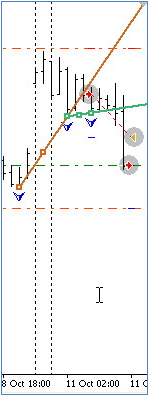
图 3 新的 CF 形态
6 个柱(小时)以后,形成了开口更宽的新 CF 形态(图 3),确认了之前所提示的趋势反转或走平。
机械交易系统在获利水平关闭了上一个卖出头寸并在 CF 形态条件下再次打开一个卖出头寸。
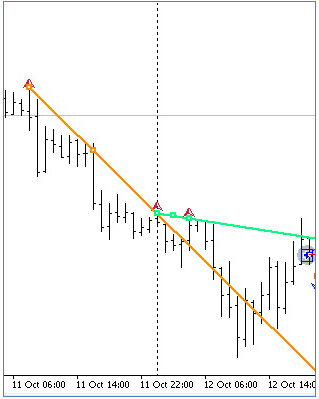
图 4 CF 形态确认
图 4 显示,在 10 月 11 日的趋势反转之后,趋势将转为向下,它于 10 月 12 日开始时由指向下方的 CF 形态进行确认。
在当天中午,新的反转趋势开始形成,因为价格向 CF 侧线移动。 在交叉侧线以后,可以关闭当前的卖出头寸并打开买入头寸。
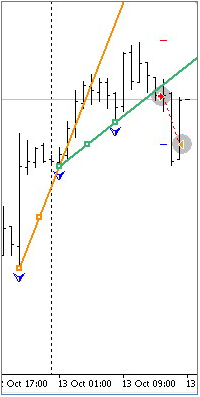
图 5 趋势逆转
从图 5 可见, 10 月 12 日的剩余时间和 10 月 13 日的开始时间保持了向上的趋势。 在接近 13 日中午时,形成了向上的 CF 形态。 在 10 月 13 日的中午,另一个趋势反转开始出现。 按照形成的信号,机械交易系统将关闭买入头寸,并打开卖出头寸。
上面的形态形成过程,可以在可视模式下使用策略测试程序慢速测试随附作为 Expert Advisor 的 Fork_Ch_ExpertH1_v2.mq4 文件进行跟踪。
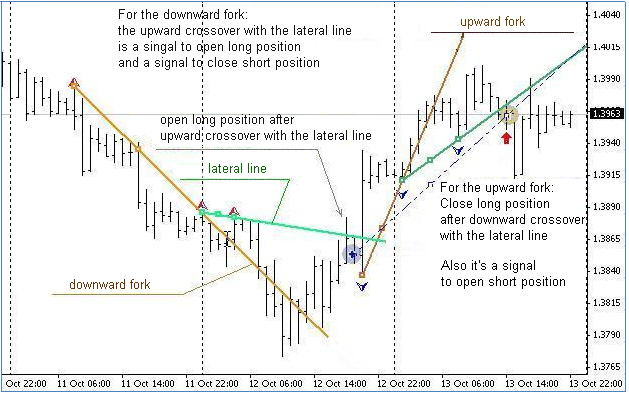
图 6 交易信号
图 6 对用于打开和关闭头寸的信号提供了一些说明。
2. 在 MQL4 中“Chuvashov 的叉子”建议代码的一些特点
在下面的代码中,没有对变量、用于打开和关闭订单的函数以及绘制标记和趋势线的函数进行注释,本文也没有提供,因为它们可以在本文附件中的程序中找到,并且非常容易理解。
注意:一些变量包含在主程序函数 Start() 中,因为它们在每次价格变动时应该进行归零。
我们开始搜索沿着(例如)下降趋势的最后三个连续分形。 在该情况下,我们得到一个朝下的叉子。 如果向上穿越侧线,就可以打开买入头寸。
// ===================================================================
// Loop for searching for the last three consecutive fractals (BUY case)
// lying along the DOWNtrend for the Chuvashov's Fork construction
// ==================================================================+
   for (i=M;i<=N;i++)
    {//loop
    if(High[i]>High[i+1] && High[i]>High[i+2] && High[i]>High[i-1] && High[i]>High[i-2])
     {
      VFN++; // counter of the found fractal.
     // -------------------------------------------------------------+
      if(VFN==1)               // if the 1st fractal is found, store the following values: Max[i], candlestick no.[i], time[i]:
      { // f1
        Vnf1=i;                // store the Max bar number of the found fractal.
        VMF1=High[i];          // store the Max value of the 1st found fractal.
        tim1=iTime(NULL,0,i);  // store the time of the 2nd reference point.
      } //-f1

    // --------------------------------------------------------------+
      if(VFN==2)                // if the 2nd fractal is found, store the following values: Max[i], candlestick no.[i], time[i]:
      { VMF2=High[i];           // store the Max value of the 2nd found fractal.
        if(VMF2>VMF1)           // if the Max value of the 2nd fractal is higher than that of the 1st fractal (i.e. directed downwards),
        { Vnf2=i;               // store the Max bar number of the found fractal.
          tim2=iTime(NULL,0,i); // store the time of the 2nd reference point.
        }
      }
    // --------------------------------------------------------------+
    if(VFN==3)                  // if the 3rd fractal is found, store the following values: Max[i], candlestick no.[i], time[i]:
    {
      VMF3=High[i];             // store the Max value of the 3rd found fractal.
      if(VMF3>VMF2)             // if the Max value of the 3rd fractal is higher than that of the 2nd fractal,
       {Vnf3=i;                 // store the Max bar number of the 3rd fractal.
        tim3=iTime(NULL,0,i);   // store the time of the 3rd reference point.
       }
    }
// ------------------------------------------------------------------+
   if(VFN==3) break; // all three fractals are found, exit the loop.
// ------------------------------------------------------------------+
    }
   }//-loop
在上面的循环中,我们找到三个以特定方式排布的分形,即第一个分形低于第二个分形,第二个分形低于第三个分形。 第三个和第二个分形是构建主趋势线的参考点,并成为其中的基础。
但是,第三个分形(其值)可能低于主趋势线在第一个分形垂直线上的投影:
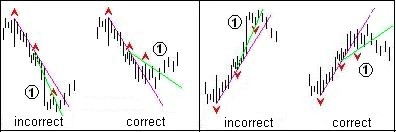
图 7 参考点位置的改善
根据形态构建要求,我们引入了改善第三个参考点位置的几个运算符。
// ------------------------------------------------------------------+
   if(VMF3>VMF2 && VMF2>VMF1)
    {
    // Let us define whether the lateral (2) trend line is HIGHER than the projection of the MAIN(1)
    // trend line? For this purpose, we calculate the price value of the projection of the MAIN(1) trend line
    // on the vertical of the Max value of the 1st fractal:
    V_down1=((VMF3-VMF2)/(Vnf3-Vnf2));      // speeds of falling of the MAIN(1) trend line over 1 bar.
    PricePrL1_1f=VMF2-(Vnf2-Vnf1)*V_down1;  // price of the projection of the MAIN(1) trend line on the vertical of the 1st fractal.
    // now compare the price value of the 1st fractal with the price of the projection of the MAIN(1) trend line
    // on the vertical of the Max value of the 1st fractal, and if the Max price of the 1st fractal is higher than the price of the projection of the
    // MAIN(1) trend line on the same fractal, then the Chuvashov's Fork construction requirements are met.
    if(VMF1>PricePrL1_1f) // if the pattern for opening a Buy position has emerged
     {
     V_down2=((VMF2-VMF1)/(Vnf2-Vnf1));  // speeds of falling of the lateral trend line over 1 bar.
     PricePrL2_1b=VMF1-Vnf1*V_down2;     // price of the projection of the Lateral(2) trend line on the current 1st BAR.
     PricePrL1_1b=VMF2-Vnf1*V_down1;     // price of the projection of the MAIN(1) trend line on the current 1st BAR
     // keep in mind that the pattern for opening a Buy position has emerged
     patternBuy = true; patternSell = false;   // pattern for opening a Buy position has emerged
     // draw marks and lines of the "Chuvashov's Fork" pattern
     DelLine(); CreateLine(); CreateArrow();   // draw marks and lines having deleted the preceding ones
     }
    }
// ==================================================================+
如果第一个分形的最高价格高于 MAIN(1) 趋势线在同一个分形上投影的价格,就符合 Chuvashov 的叉子的构建要求。
已经确定了“Chuvashov 的叉子”形态之后,我们可以在图表上绘制相应的形态标记和线。
现在,我们应该确定打开买入头寸的条件和参数。
// ==================================================================+
//                    Opening BUY positions                           +
// ==================================================================+
   if(OrdersTotal()<1) // we place one (or 2..3..etc.) orders
    {  //open a position
// ------------------------------------------------------------------+
   if(patternBuy==true)
    { //patternBuy
如果最后 25 个柱上的价格范围至少有 50 个点,则会更好。
我们来添加额外条件,例如,在最近 24 或 48 个小时(柱)上的 150 周期移动平均线将朝下,价格将低于该指标(Fibo89s 水平)89 个点。
 // 1st additional condition - price range over the last 25 bars is at least 50 points.
if((High[iHighest(Symbol(),Period(),MODE_HIGH,25,0)]-Low[iLowest(Symbol(),Period(),MODE_LOW,25,0)])>=50*Point)
  {// price range
   // 2nd additional condition e.g. if the price is lower than 89 pip below the level of Ma144 (MA of 12 squared)
  if(Bid<Ma144_1-89*Point &&       // price is lower than Fibo89s level
     (Ma144_1-Ma144_48)<0)         // Ma144 slope is negative
   {//2nd additional condition
打开头寸的主要条件是价格交叉形态侧线。
例如,可以如下所示:
if((High[1]>PricePrL2_1b ||                          // Max of the candlestick is higher than the lateral projection of the 1st Bar
    Close[1]>PricePrL2_1b ||                         // any candlestick closed above the projection of the 1st Bar
    (Open[1]<Close[1] && Close[1]>PricePrL2_1b) ||   // white candlestick crossed the projection of the 1st Bar
    Bid>PricePrL2_1b) && Bid<PricePrL2_1b+3*Point)   // not higher than 3 pip of the price of the projection of the 1st Bar
   {
此外,我们来定义止损和获利参数。 将止损设置等于从“0”柱到第二个分形柱的间隔上的最小价格值,即第一个分形的最低水平。 将获利设置在价格范围的 0.6 水平。
因为该策略根据上涨趋势的下分形进行跟踪,我们将获利设置为大于两个最小价格范围,例如 100 - 200 点。
  {// opening a Buy position.
   // Calculate Stop Loss as the Min price value over the interval from the "0" bar to the bar of the 2nd fractal.
  SL_B=(Bid-Low[iLowest(Symbol(),Period(),MODE_LOW,Vnf2,0)])/Point;
  if(SL_B<StopLevel) SL_B=Bid-(StopLevel+2)*Point; // if SL_B is less than StopLevel
  TP_B=120;
  Print("  OP_BUY Chuvashov's Fork","  VMF1 = ",VMF1," < ",PricePrH1_1f);
  Op_Buy_Ch();
  return;
  }//- opening a Buy position.
对沿着上涨趋势的最后三个连续分形的搜索是基于下分形,构建上涨趋势形态的整个过程跟构建下跌趋势的形态遵循相同的逻辑。
//+=======================================================================+
//                   proceed to TRACING opened positions            +
//+=======================================================================+
for (i=OrdersTotal()-1; i>=0; i--)        // loop for selection of BUY orders
   {//loop for selection of positions Buy
  if(!OrderSelect(i, SELECT_BY_POS, MODE_TRADES))
    {Print("Order selection error = ", GetLastError()); }
   if(OrderType()==OP_BUY )                // if the Buy order is placed
    { //2-type_Buy
如果打开买入头寸时已经出现上涨趋势形态,意味着价格已经反转并开始下跌。 应该关闭买入头寸。
//+=======================================================================+
//|  Conditions for closing BUY positions                                     +
//+=======================================================================+
   if(patternSell==true)         //  a pattern for opening a Sell position emerged
    {
    Print(" closing the BUY position as the opposite pattern has emerged");
    Close_B_Ch();         // close the position SELL
    return;
    }
//+=======================================================================+
我们继续对打开买入头寸进行修改。
修改过程分为三步。 第一步,绘制较靠近‘零亏损’的止损线。 第二步,当价格达到大于或等于止损的正利润后,将止损移动到开仓水平。
// ---- 1st stage ------------------------------------------ 1st stage ---+
    // The first modification stage: when the price reaches the profit
    // equal to the Stop Loss value, we move SL_B by 1/2 value of Stop Loss
    // i.e. closer to the position opening level. (+StopLevel)
   if((Bid-OrderOpenPrice())>SL_B*Point        // if the difference between the price and the opening value is >SL_B
       && OrderStopLoss()<OrderOpenPrice())    // and if Stop Loss is less than the position opening level.
    {// modif-1
     OrderModify(OrderTicket(),                // order #.
     OrderOpenPrice(),                         // opening price.
     OrderStopLoss()+(SL_B/2)*Point,           // New value of Stop Loss.
     OrderTakeProfit()+1*Point,                // New value of Take Profit.
     0,                                        // Deferred order expiration time.
     Red);                                     // Color of modification marks (dashes).
     return;
    }//-modif-1
// --- end of 1st stage -----------------------------------------------------+
// ---- 2nd stage ------------------------------------------ 2nd stage ---+
    // The second modification stage: when the price repeatedly reaches profit
    // equal to the Stop Loss value, we move SL_B to the 'zero-loss'
    // level, i.e. to the position opening level (+StopLevel).
   if((Bid-OrderOpenPrice())>SL_B*Point        // if the difference between the price and the position opening value is >SL_B
       && OrderStopLoss()<OrderOpenPrice())    // and if Stop Loss is less than the position opening level
    {// modif-1
     OrderModify(OrderTicket(),                // order #.
     OrderOpenPrice(),                         // opening price.
     OrderStopLoss()+(SL_B+StopLevel)*Point,   // New value of Stop Loss.
     OrderTakeProfit()+1*Point,                // New value of Take Profit.
     0,                                        // Deferred order expiration time.
     Magenta);                                 // Color of modification marks (dashes).
     return;
    }//-modif-1
// --- end of 2nd stage -----------------------------------------------------+
当价格达到超过止损值 1.5 倍的利润时,我们将 SL_B 绘制到最近的下分形,它应该高于之前的止损并继续沿着上涨趋势的上升下分形。
// ---- 3rd stage --------------------------------------- 3rd stage ------+
   //  When the price reaches the profit of more than 1.5 times the Stop Loss value
   //  draw SL_B to the nearest lower fractal that should be higher than the preceding Stop Loss
   if((Bid-OrderOpenPrice())>=(SL_B+SL_B/2)*Point  // if the difference between the price and the opening value is >SL_B+SL_B/2
       && OrderStopLoss()>=OrderOpenPrice())       // and if Stop Loss is already at the 'zero-loss' level.
    {// modif2
     // move SL_B to the level of the nearest lower fractal,
     // for this purpose, find the nearest lower fractal:
    for (k=3;k<=24;k++)
     {//loop-M
     if(Low[k]<Low[k+1] && Low[k]<Low[k+2] && Low[k]<Low[k-1] && Low[k]<Low[k-2])
      { // fractal Low
      VlFl_L=Low[k];             // Min value of the nearest fractal
     if(VlFl_L>OrderStopLoss())  // fractal that should be higher than the preceding Stop Loss
      {// fractal higher than SL_B
      tim1_L=iTime(NULL,0,k);    // Time of this fractal
         ///  string Time1_L=TimeToStr(tim1_L,TIME_DATE|TIME_MINUTES);
         ///  Print("  Modif-2 ====== ","  Fractal = ","Frak"+k,VlFl_L,"  time = ",Time1_L);
      // shift Stop Loss to the formed lower fractal Min value level
      OrderModify(OrderTicket(),            // order #
      OrderOpenPrice(),                     // opening price
      VlFl_L+2*Point,                       // New value of Stop Loss. // in zero-loss
      OrderTakeProfit()+1*Point,            // New value of Take Profit.
      0,                                    // Deferred order expiration time.
      Aqua);                                // Color of Stop Loss and/or Take Profit modification arrows
      if(VlFl_L!=0)  break;                 // if the fractal is found, exit the loop
      return;
// --- end of 3rd stage ------------------------------------------------------+
总结
简单的总结一下,经不同的经纪人测试,所介绍的机械交易系统样本均取得了积极成果。
所描述的技术可供交易者作为交易系统的组成部分。 但是,在打开头寸的过滤器方面,还需要进一步的开发。 上面提到的过滤器可以根据该技术的发明者 Stanislav Chuvashov 的建议进行改善。
Stanislav Chuvashov 的建议可以参阅其书籍 17 free lessons(俄语)。
附件备注:
- Fork_Ch_ExpertH1_v1.mq4 - “Chuvashov 的叉子”机械交易系统
- Fork_Ch_MTS_v2.mq4 - “Chuvashov 的叉子”机械交易系统,程序文本中没有注释。
本文由MetaQuotes Ltd译自俄文
原文地址: https://www.mql5.com/ru/articles/1352
注意: MetaQuotes Ltd.将保留所有关于这些材料的权利。全部或部分复制或者转载这些材料将被禁止。
本文由网站的一位用户撰写,反映了他们的个人观点。MetaQuotes Ltd 不对所提供信息的准确性负责,也不对因使用所述解决方案、策略或建议而产生的任何后果负责。
 合成柱 - 显示价格图形信息的新视角
 交易者的工具箱: 拖动交易库(Drag Trade Library)
 关于技术分析和市场预测的方法
