NosTraderMusLR
- Göstergeler
- Sürüm: 1.0
- Etkinleştirmeler: 5

LINEAR REGREESION INDICATOR ==>
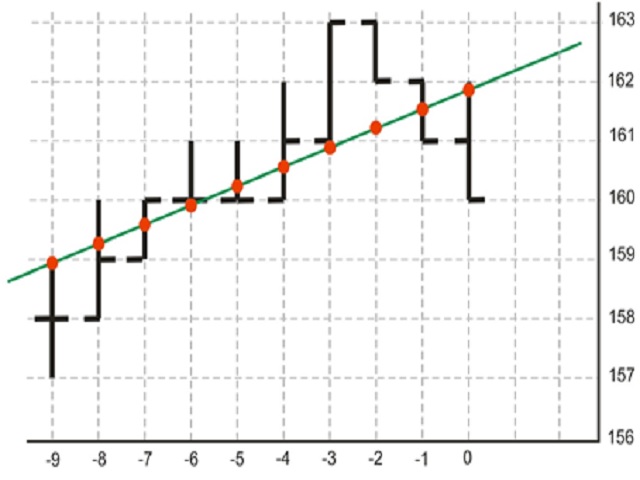
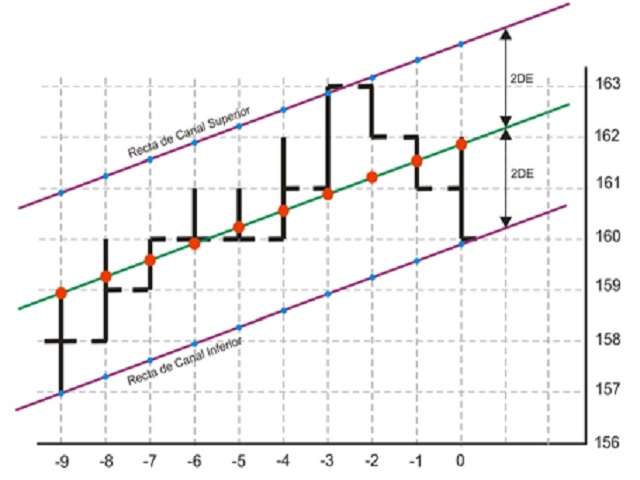
The indicator represents the Linear Regression Line and the Support and Resistance lines, obtained based on the standard deviation with respect to the Linear Regression. Customization: The following values can be adjusted:
- Rango Tendencia: The number of bars or periods, within the considered time frame, taken as a reference for the indicator.
- AmpDesv: The amplitude or number of times to consider the standard deviation of the linear regression for its representation.
- Colores: It is possible to choose colors from a palette for the representation of each line.
The Linear Regression indicator is used to measure the relationship between two variables, in this case, price and time. The indicator plots a straight line through the closing prices of an asset over a specified period and is used to identify the direction of the market trend. If the regression line is rising, it indicates that the market is in an uptrend, and if it is falling, it indicates a downtrend.
The main advantage of using the Linear Regression indicator is that it allows traders to identify entry and exit points in the market more accurately. Additionally, it is also useful for establishing support and resistance levels, which can help traders determine profit targets and stop losses.
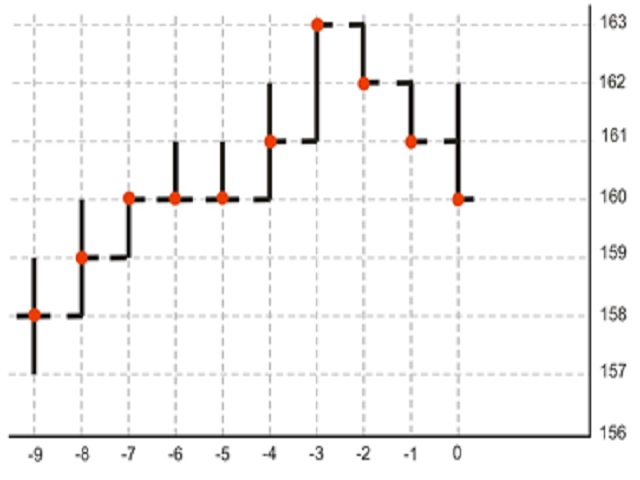
Linear Regression Line
A linear regression line is a mathematical model used in statistics to describe the relationship between two variables (in our case, prices and time). It is a straight line that fits the data points (closing prices) and represents the central tendency of the data. This line is used to predict the value of one variable (price) based on the value of the other variable (time), assuming that the behavior of future prices is based on past prices.
To calculate the linear regression line, the least squares method is used, which involves minimizing the distance between the points and the line. The slope of the line represents the change in the dependent variable for each change in the independent variable, while the intercept represents the value of the dependent variable when the independent variable is zero.
Standard deviation of a linear regression
The standard deviation of a linear regression is a measure used in statistics to measure the variability of data around the regression line. The deviation is calculated from the residuals, which are the differences between the observed values and the values predicted by the regression line. The standard deviation of a linear regression is important because it provides information about the accuracy of the regression line. A low standard deviation indicates that the data is very close to the regression line and that it is a good approximation of the data. A high standard deviation indicates that the data is very scattered and that the regression line is not a good approximation of the data. However, in the case of trading financial instruments and considering market dynamics, the magnitude of the standard deviation should be interpreted as follows: a low standard deviation indicates low volatility and a high standard deviation indicates higher volatility in the instrument or asset subject to analysis for the considered period.