Discrete Fourier Transform of Price

This indicator is a useful tool for visualising cyclic components in price. It calculates the Discrete Fourier Transform (DFT) of a price chart data segment selected by the user. It displays the cycles, the spectrum and the synthesised signal in a separate window.  The indicator is intended as a learning tool only, being unsuitable for providing actual trade signals. Download the file -  it is a free toy. Play with it to understand how signals can be transformed by controlling their cyclic components . This is the essential operation performed by digital filters. Many standard indicators  like moving averages and oscillators (SMA, LWMA, EMA, MACD, CCI, DPO, AWSOME OSC,and Momentum, etc.), all  have the form of such linear digital filters. This tool helps visualise the functioning of these indicators. The description contains very little mathematical equations  as the goal is to concentrate on a conceptual framework and understanding.

Relation to electronic Digital Signal Processing (DSP): If we think of price as a signal in a digital electronic system, without complicating the situation with too much engineering detail, we can define price as a discrete time digital signal that is sampled once at repeating periodic linearintervals. The two main differences between price and the electronic digital signal is: first the price is always a positive definite quantity,and second the electronic signal is usually sampled at a much faster rates than price (for humans that is, not HFT systems).   So, for example, the digital price signal will be the daily, hourly or quarter-hourly closing price, as it is conventionally represented.

 If one inspects almost any price chart, one can see that the price changes in two readily discernible fashions, a fast erratic price change between consecutive periods, and a slower change in the overall price graph over many periods. In electronic systems, we identify the fast changes as “noise”, and the slower change as the actual “signal”.  In trading language these are called “volatility” and “trend”, respectively. So, is there a "correct" way to decouple these two features, to obtain the desired trend on its own, which indicates the longer-term sustained price change?  One approach is to apply the DFT. 

The Discrete Fourier Transform DFT (sometimes called FFT):  This method is one of the techniques used to analyse and process a discrete time signals in electronic systems (but it has vast application in many other fields), and it is not even the best technique at doing this in circuits, but it is simple enough to consider here .  We will not go into the lengthy mathematics, rather, we concentrate on a conceptual description which we hope you will find to be sufficient and satisfying.

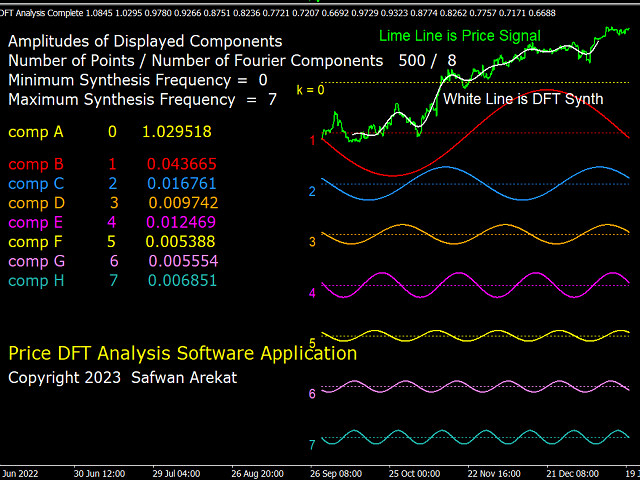
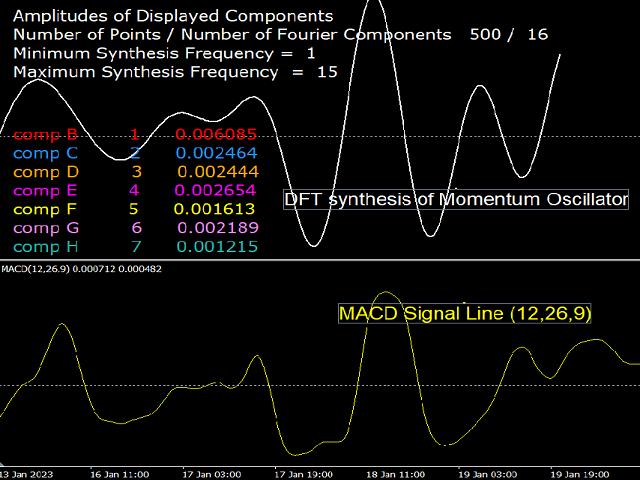
Brief Description of DFT: Any digital signal (or time series) having a length of N samples can be "Analysed" into N/2+1 sinusoidal oscillation components (cycles) of sequentially increasing period (decreasing frequency). The smallest period is twice the sampling length (i.e. two samples), and the largest period is N/2 samples.  The amplitude of the cycles are different from each other, depending on the shape of the signal. The original signal can be "Synthesised" by adding all N/2+1 such cycles. If only a subgroup of cycles is used in the synthesis, then a different signal will be obtained. One can therefore customise the synthesis according to the desired signal. This is the essence of the "filter banks" technique in DSP.

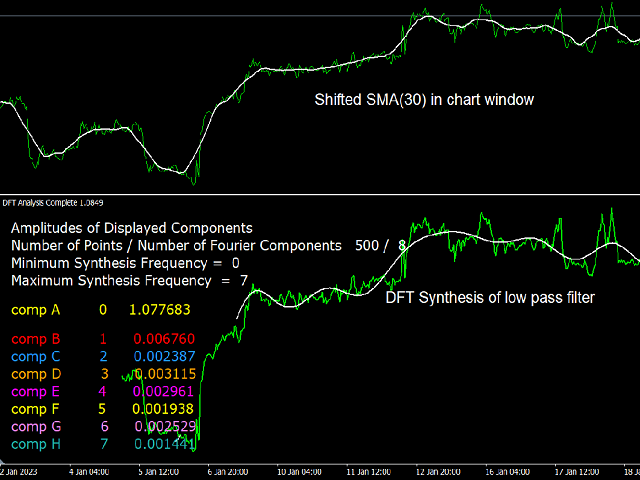
A Low Pass Filter: This filter can be obtained by using the dc (k=0) component, and a a range of low frequencies up to a certain cutoff (for example k=0 to k=7).  This has the effect of the cancellation of all higher frequencies, hence the name low-pass. Because the trend signal is associated with low frequencies, and volatility to high frequency, the resulting signal corresponds to a de-noised trend signal. Thus a smoothed signal whose value and slow variation correspond to original signal .

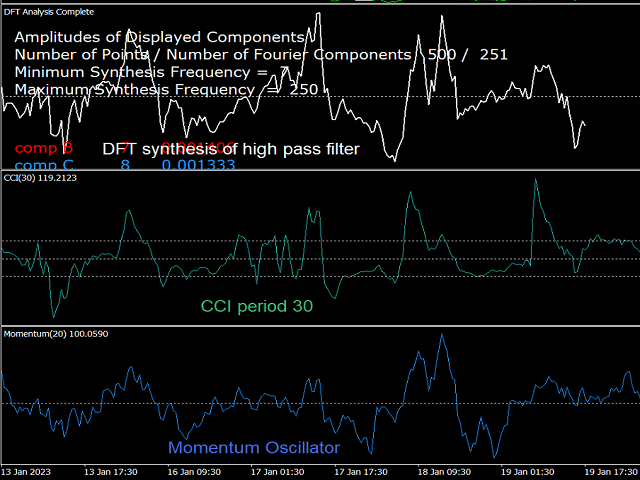
A High Pass Filter: This filter can be obtained by adding all frequencies above a certain minimum-pass frequency (for example k=7 to k=N/2). In any situation where the dc (k=0) component is eliminated, the resulting signal will be an oscillator. For the the high pass, the oscillator only includes the higher frequency components, thus the trend component is eliminated. Some standard indicators are high pass filter oscillators, such as the DPO and CCI oscillator, since their signal is obtained by subtracting a moving average from the original signal, thereby removing the dc component while keeping the high frequencies. 

A Band Pass Filter: This filter uses a range of frequencies that does not include the highs and lows. For example k=7 to k=30. The resulting signal is an oscillator since the k=0 has been removed. Many oscillators in technical analysis have the form of a band pass oscillator, the most famous being the MACD, which is meant to function as a momentum oscillator. But the momentum oscillator adds the frequencies in a prescribed manner, as will bed clarified in other free indicators by this developer.. 

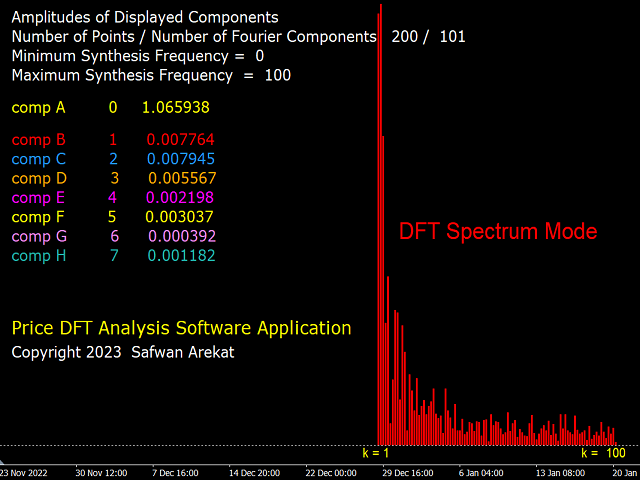
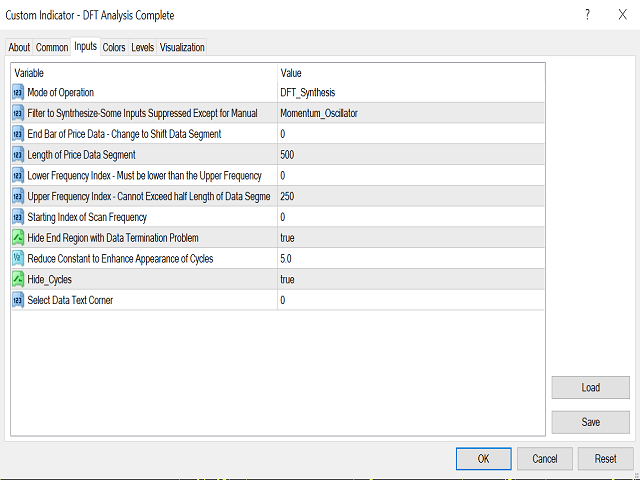
The Indicator Controls: An attempt has been made to keep the inputs parameters easy to understand and use. There are three modes of operation: 1) DFT Analysis, which displays the cycles present in the signal. 2) The synthesis mode where the filters described above can be customised. 3) DFT spectrum mode which displays the relative strength of each cycle.  The user can "play" with this system with the goal of gaining a better understanding of the meaning and function of digital filters and how they are related to many of the technical indicators in common use. 


Wishing you a great learning experience and . . . Enjoy !


Önerilen ürünler
Çoklu zaman dilimi desteği, özelleştirilebilir görsel sinyaller ve yapılandırılabilir uyarı sistemi ile Balance of Power (BOP) göstergesi. Serbest programlama hizmetleri, güncellemeler ve diğer TrueTL ürünleri MQL5 profilimde mevcuttur. Geri bildirim ve değerlendirmeler çok takdir edilmektedir! BOP nedir? Balance of Power (BOP), fiyattaki değişimi mum aralığıyla karşılaştırarak alıcıların satıcılara karşı gücünü ölçen bir osilatördür. Gösterge (Kapanış - Açılış) / (Yüksek - Düşük) olarak hesa
FREE
Volatility Limit Trend
Safwan Rushdi Khalil Arekat
Volatility Limit Trend Indicator (VLT), an original indicator by this developer,  is a trend indicator based on setting a fixed volatility limit as a percentage of price. Volatile price is allowed to wander between two channel lines defining the fixed volatility about a central line. The price crossing one of the channel lines defines an exceeding of the allowed volatility, and ushering in one of two situation : either a continuation or a reversal of trend. The first buffer of the indicator (not
FREE
Çoklu zaman dilimi desteği, özelleştirilebilir görsel sinyaller ve yapılandırılabilir uyarı sistemi ile Average True Range (ATR) göstergesi. Serbest programlama hizmetleri, güncellemeler ve diğer TrueTL ürünleri MQL5 profilimde mevcuttur. Geri bildirim ve değerlendirmeler çok takdir edilmektedir! ATR nedir? J. Welles Wilder tarafından geliştirilen Average True Range (ATR), piyasa volatilitesini ölçen bir teknik göstergedir. Belirli bir dönem boyunca True Range'in ortalamasını hesaplar. True R
FREE
Smart FVG Indicator MT4 – MetaTrader 4 için Gelişmiş Fair Value Gap Tespiti Smart FVG Indicator MT4, MetaTrader 4 grafikleri üzerinde Fair Value Gap (FVG) alanlarını profesyonel düzeyde tespit eder, izler ve uyarılar üretir. ATR tabanlı filtreleme ile piyasa yapısını dikkate alan akıllı bir algoritmayı birleştirerek gürültüyü azaltır, likiditeye uyum sağlar ve sadece en önemli dengesizlikleri bırakarak daha net işlem kararları almanıza yardımcı olur. Başlıca avantajlar Doğru FVG tespiti: Sadec
FREE
Quantum Falcon Signal Free is a smart visual trading indicator for MetaTrader 4 designed for Forex and Gold traders. The indicator combines: • Trend analysis • RSI momentum confirmation • MACD momentum filtering • ATR volatility filtering • Higher timeframe confirmation • Smart exit signal detection Main Features: • Smart Buy and Sell signals • Exit Buy / Exit Sell alerts • Real-time dashboard on chart • Professional candle arrows • Multi-timeframe trend confirmation • ATR market volatility filt
FREE
Gold Trader Pro Indicator
Massimiliano Tuzzolino
4.4 (5)
Gold Trader Pro is an advanced analytical tool specifically engineered for professional trading on XAUUSD (Gold). It provides an immediate comprehensive overview of market structure across 7 different timeframes, allowing traders to identify flow direction and signal strength through a modern, draggable, and interactive interface. Key Features Multi-Timeframe Analysis: Real-time monitoring of M1, M5, M15, M30, H1, H4, and D1. Two Operational Modes: MODE_SCALPING: Optimized for fast-paced analys
FREE
FRM Half Trend
Noiros Tech
3.5 (2)
YOU CAN NOW DOWNLOAD FREE VERSIONS OF OUR PAID INDICATORS . IT'S OUR WAY OF GIVING BACK TO THE COMMUNITY ! >>>    GO HERE TO DOWNLOAD   The system is a free open source pine script originally published on TradingView by everget   . It was converted to Mt4 by Forex Robot Makers. This system is a  popular trend indicator based on ATR ( Average True Range ) , Moving Averages and the Donchian channel . System BackGround ATR The average true range is an indicator of the price volatility of an asse
FREE
Rainbow MT4 is a technical indicator based on Moving average with period 34 and very easy to use. When price crosses above MA and MA changes color to green, it’s a signal to buy. When price crosses below MA and MA changes color to red, it’s a signal to sell. The Expert advisor ( Rainbow EA MT4) based on Rainbow MT4 indicator, as you can see in the short video below is now available here .
FREE
Discover the power of precision and efficiency in your trading with the " Super Auto Fibonacci " MT4 indicator. This cutting-edge tool is meticulously designed to enhance your technical analysis, providing you with invaluable insights to make informed trading decisions. Key Features: Automated Fibonacci Analysis: Say goodbye to the hassle of manual Fibonacci retracement and extension drawing. "Super Auto Fibonacci" instantly identifies and plots Fibonacci levels on your MT4 chart, saving you tim
FREE
High Pass Filter Candlesticks
Safwan Rushdi Khalil Arekat
This indicator applies the  biquad high pass filter to the price-chart data, and displays the filter output for the OHLC as candlesticks. The candlesticks corresponds to the actual calculations of the filter value  during the formation of each price bar (not from all historical highs lows or closes). The shape of the bars therefore corresponds directly to the shape of each price bar. High pass filters are an underappreciated type of oscillator that are seldom used in technical analysis in the st
FREE
Master the Forex Market with Powerful Currency Analysis! LIVE MONITORING OF SIGNAL USING CCY POWER Take your forex trading to the next level with a comprehensive and fully customizable tool designed to analyze currency trends, identify strong and weak currencies , and enhance your decision-making process. Key Features: Multi-Timeframe Analysis Analyze currency strength from short-term (1-minute) scalping to long-term (1-month) trends—adaptable to any trading style. Customizable Ca
FREE
YOU CAN NOW DOWNLOAD FREE VERSIONS OF OUR PAID INDICATORS . IT'S OUR WAY OF GIVING BACK TO THE COMMUNITY ! >>>    GO HERE TO DOWNLOAD Momentum channel is a simple momentum based system yet with a great degree of accuracy in detecting turning points. The market momentum are defined by Average True Range Channels . When price breaks these channels most times , it is an indication of a shift in market momentum and thus a possible new trend formation. The system can be traded on any time frame and
FREE
Sentinel Arrow
Dmytro Kasianov
1 (1)
Sentinel Arrow Temel Özellikler: ⊗Trendleri, dönüşleri ve momentum değişikliklerini hızlı ve doğru bir şekilde belirlemek için özel bir algoritma. ⊗Profesyonel kullanım için tasarlanmış olup, gecikmeleri veya hatalı güncellemeleri ortadan kaldıran güçlü bir sinyal mantığına sahiptir. ⊗Çeşitli zaman dilimleri için uygundur. ⊗Geçmiş sinyalleri yeniden çizmez, silmez veya değiştirmez. ⊗Tüm AL ve SAT sinyalleri mum çubuğunun kendisinde üretilir ve sabit kalır. ⊗Gerçek alım satımda yeniden çizim yo
FREE
Candle Pattern Finder Candle Pattern Finder is a powerful MT4 indicator designed to help traders easily detect key candlestick patterns in real-time. Whether you're trading trends, reversals, or consolidations, this tool highlights important price action signals directly on the chart — helping you make faster and more confident trading decisions. Detects popular candlestick patterns: Bullish/Bearish Engulfing Hammer & Inverted Hammer Shooting Star & Hanging Man Three White Soldiers Three Black
FREE
Double HMA lines MTF
Pavel Zamoshnikov
5 (1)
This is a multi-timeframe version of the popular Hull Moving Average (HMA). The Double HMA MTF Light indicator combines two timeframes on a single chart. The HMA of the higher timeframe defines the trend, and the HMA of the current timeframe defines short-term price movements. The indicator is freely distributed and hasn't audio signals or messages. Its main function is the visualization of price movements. If you need advanced functionality of the HMA multi-timeframe indicator (information ab
FREE
FisherYur4ik by Yuri
Nnamdi Kennedy Ifeorah
Fisher Yur4ik Indicator is a momentum indicator originated by Yuri Prokiev (Russian). I combined the Fisher Test indicator with other indicators to sieve/filter signals. It is not used as a standalone indicator but in combination to filter out Price Action signals.  I have uploaded this indicator (Fisher test) for download alongside the 3Bar_Play signal indicator for signals to appear. It is free.
FREE
SX Supply Demand Zones accurately identifies and draws high-probability Supply and Demand zones using a sophisticated algorithm. Unlike traditional indicators that clutter your chart, this indicator is designed with a focus on performance and a clean user experience. New Unique Feature: Interactive Legend System What truly sets this indicator apart from everything else is the Interactive Control Legend. You have a professional dashboard directly on your chart that allows you to: Show/Hide: Ins
FREE
The Follow The Labels Indicator is a multi-functional MT4 indicator designed to give traders a comprehensive visual overview of market conditions across multiple dimensions. It combines trend analysis, previous day levels, stochastic momentum, and rejection signals in one easy-to-read interface. Key Features: Multi-Timeframe MA200 Trend Filter (H1→M15) Displays the alignment of the MA200 (LWMA) across three timeframes: H1, M30, M15. Shows an overall trend label: Bullish, Bearish, or Mixed. Optio
FREE
The indicator allows you to trade binary options. The recommended time frame is М1 and the expiration time is 1,2,3 minutes. The indicator suitable for auto and manual trading. A possible signal is specified as a arrows above/under a candle. You should wait until the candle closes! Arrows are not re-painted Trade sessions: TOKYO section (Half-end) Currency pairs: USD/JPY Working time frame: M1 Expiration time: 1,2,3 minutes. The indicator also shows good results when using the martingale strateg
FREE
TRADING STRATEGY GUIDE DELIVERY The full Trading Strategy Guide will be sent directly to you after purchase. Just message me on MQL5 and ask for it — you'll receive it instantly, along with priority support and setup help. Powered Market Scanner for Smart Trading Decisions Keypad Support & Resistance is a next-generation MT4 trading system built for serious traders who demand precision, reliability, and clarity. It combines advanced smart filters with real-time price structure logic to gener
FREE
Sorsawo Magic Signal Pro is an advanced technical analysis tool designed to identify high-probability entry points by combining adaptive momentum logic with smart volatility filtering. Core Features Adaptive WPR Logic : Unlike standard oscillators, Sorsawo Magic uses a dynamic calculation period that automatically adjusts based on market volatility. Volatility-Filtered Signals : The indicator analyzes price gaps and momentum surges to ensure signals are only generated when there is sufficient ma
FREE
Free automatic Fibonacci is an indicator that automatically plots a Fibonacci retracement based on the number of bars you select on the BarsToScan setting in the indicator. The Fibonacci is automatically updated in real time as new highest and lowest values appears amongst the selected bars. You can select which level values to be displayed in the indicator settings. You can also select the color of the levels thus enabling the trader to be able to attach the indicator several times with differe
FREE
Email Drawdown Alert
Roman Starostin
5 (12)
Free informative Indicator-helper. It'll be usefull for traders who trade many symbols or using grid systems (Averaging or Martingale). Indicator counts drawdown as percent and currency separate. It has a number of settings: Count deposite drawdown according equity value and send e-mail or notifications to user if DD more than set; Sending e-mail when max open orders reached; Shows price and remaining pips amount before MarginCall on current chart and Account generally; Display summary trade lot
FREE
Fibonacci SR Indicator This indicator creates support and resistance lines. This indicator is based on Fibonacci Retracement and Extension levels. It will consider many combinations of the Fibonacci levels and draw support/resistance lines based on these. This indicator uses tops and bottoms drawn by the ZigZag indicator in its calculations. The ZigZag can also be drawn on the chart, if necessary. The indicator considers many combinations of past reversal points and Fibonacci ratio levels, and w
FREE
Ppr PA
Yury Emeliyanov
4.75 (4)
"Ppr PA" is a unique technical indicator created to identify "PPR" patterns on the currency charts of the MT4 trading platform. These patterns can indicate possible reversals or continuation of the trend, providing traders with valuable signals to enter the market. Features: Automatic PPR Detection:   The indicator automatically identifies and marks PPR patterns with arrows on the chart. Visual Signals:   Green and red arrows indicate the optimal points for buying and selling, respectively. Ar
FREE
MZZ Beta Arrows
Aleksey Usachev
1 (1)
An indicator based on non repainting ZigZag and some filters. This indicator is available free on market (also need to be specified in the parameters): https://www.mql5.com/ru/market/product/152748 It is a first version to test and adjust. Maybe get some feedback. There is only one parameter: MaxBars to limit history calculation. If value is zero than it uses all available bars. It works only on these timeframes: from M1 to H1. As soon as it doesn't repaint live behavior is the same as on back t
FREE
THE BRAIN SMC ULTIMATE   "Trade Like an Institution, Analyze Like a Professional" Are you tired of cluttered charts, lagging indicators, and conflicting signals? Welcome to the era of Clean Trading. The Brain SMC Ultimate is engineered for traders who prioritize visual clarity without sacrificing data accuracy. Utilizing the latest Smart Money Concepts (SMC) algorithms, this indicator maps institutional footprints directly onto your MetaTrader 5 chart. CORE PREMIUM FEATURES Smart Entry Guidan
FREE
Adjustable Fractal MT4
Dmitry Timin
4.77 (26)
Adjustable Fractal MT4 is a modification of Bill Williams' Fractals indicator. The fractal consists of a two sets of arrows - up (upper fractals) and down (lower fractals). Each fractal satisfies the following conditions: Upper fractal - maximum (high) of a signal bar exceeds or is equal to maximums of all bars from the range to the left and to the right; Lower fractal - minimum (low) of a signal bar is less or equal to minimums of all bars from the range to the left and to the right. Unlike a s
FREE
Alpha Trend sign has been a very popular trading tool in our company for a long time. It can verify our trading system and clearly indicate trading signals, and the signals will not drift. Main functions: Based on the market display of active areas, indicators can be used to intuitively determine whether the current market trend belongs to a trend market or a volatile market. And enter the market according to the indicator arrows, with green arrows indicating buy and red arrows indicating se
Fxland Price Reversal Zones (MT4) FXLAND Smart Reversal Indicator is a professional technical analysis tool designed to help traders identify potential price reversal zones and key market turning points with clarity and precision. The best reversal indicator and price return by choosing only one ceiling or floor in each time frame A masterpiece of combining mathematics and Gann, fractal matrix, Fibonacci, movement angle and time. Completely intelligent Key Features Detects potential pr
Bu ürünün alıcıları ayrıca şunları da satın alıyor
Gann Made Easy
Oleg Rodin
4.83 (162)
Gann Made Easy , bay teorisini kullanarak ticaretin en iyi ilkelerine dayanan, profesyonel ve kullanımı kolay bir Forex ticaret sistemidir. WD Gann. Gösterge, Zararı Durdur ve Kâr Al Seviyeleri dahil olmak üzere doğru SATIN AL ve SAT sinyalleri sağlar. PUSH bildirimlerini kullanarak hareket halindeyken bile işlem yapabilirsiniz. Satın alma işleminden sonra, alım satım talimatlarını ve harika ek göstergeleri ücretsiz olarak almak için lütfen benimle iletişime geçin! Muhtemelen Gann ticaret yöntem
Genesis Matrix Pro is a professional multi-timeframe trend detection indicator designed to help traders identify high-quality market alignment with clarity and structure. It combines 12 different technical indicators into one visual alignment matrix, allowing traders to quickly see when market conditions are bullish, bearish, or neutral. A signal is generated only when the selected strategies are aligned, helping reduce noise and improve decision-making. PLEASE CONTACT ME AFTER PURCHASE TO GET
The Propfolio Master Suite is the ultimate all-in-one analytical workstation for professional traders. Combining the power of the Beat The Market Maker (BTMM) methodology, Smart Money Concepts (SND/Liquidity), and Advanced Volume Profile, this suite replaces multiple different indicators with one optimized engine. Monitor up to 14 pairs simultaneously from a single chart, instantly identify market cycles, and seamlessly map institutional footprints with the click of a button. The Command Center
Scalper Inside PRO
Alexey Minkov
4.74 (69)
Scalper Inside PRO Scalper Inside PRO is an intraday trend and scalping indicator for MetaTrader 4 that uses an exclusive algorithm to quickly detect market direction and key target levels. It automatically calculates entry, exit and multiple profit targets, and shows detailed performance statistics so you can see how different instruments and strategies performed. This helps you choose the most suitable trading instruments for the current market conditions. Additionally, you can easily integrat
M1 Sniper
Oleg Rodin
5 (23)
M1 SNIPER kullanımı kolay bir işlem göstergesi sistemidir. M1 zaman dilimi için tasarlanmış bir ok göstergesidir. Gösterge, M1 zaman diliminde scalping için bağımsız bir sistem olarak kullanılabilir ve mevcut işlem sisteminizin bir parçası olarak kullanılabilir. Bu işlem sistemi özellikle M1'de işlem yapmak için tasarlanmış olsa da, diğer zaman dilimleriyle de kullanılabilir. Başlangıçta bu yöntemi XAUUSD ve BTCUSD ticareti için tasarladım. Ancak bu yöntemi diğer piyasalarda işlem yaparken de ya
PZ Harmonacci Patterns
PZ TRADING SLU
3.17 (6)
Trade smarter, not harder: Empower your trading with Harmonacci Patterns This is arguably the most complete harmonic price formation auto-recognition indicator you can find for the MetaTrader Platform. It detects 19 different patterns, takes fibonacci projections as seriously as you do, displays the Potential Reversal Zone (PRZ) and finds suitable stop-loss and take-profit levels. [ Installation Guide | Update Guide | Troubleshooting | FAQ | All Products  ] It detects 19 different harmonic pric
PRO Renko Sistemi, RENKO grafikleri ticareti için özel olarak tasarlanmış son derece hassas bir ticaret sistemidir. Bu, çeşitli ticaret araçlarına uygulanabilen evrensel bir sistemdir. Sistemi etkin piyasa sana doğru ters sinyallerine erişim hakkı denilen ses nötralize eder. Göstergenin kullanımı çok kolaydır ve sinyal üretiminden sorumlu tek bir parametreye sahiptir. Aracı, seçtiğiniz herhangi bir ticaret aracına ve renko çubuğunun boyutuna kolayca uyarlayabilirsiniz. Yazılımımla karlı bir
Auto Optimized Parabolic RSI: Gelişmiş 3D Momentum Motoru Çoğu perakende indikatörü, piyasa volatilitesi değiştiği an çöken statik girdilere dayandığı için başarısız olur. Auto Optimized Parabolic RSI, kendi matematiksel avantajını sürekli olarak yeniden hesaplayarak "indikatör körelmesi" (indicator decay) sorununu çözer ve kurumsal düzeyde kantitatif adaptasyonu doğrudan MT5 terminalinize getirir. Temel Avantaj: Özel Bellek İçi (In-Memory) 3D Optimizasyon   Standart otomatik optimize ediciler,
NAM Order Blocks
NAM TECH GROUP, CORP.
3.67 (3)
MT4 Multi-timeframe Order Blocks detection indicator. Features - Fully customizable on chart control panel, provides complete interaction. - Hide and show control panel wherever you want. - Detect OBs on multiple timeframes. - Select OBs quantity to display. - Different OBs user interface. - Different filters on OBs. - OB proximity alert. - ADR High and Low lines. - Notification service (Screen alerts | Push notifications). Summary Order block is a market behavior that indicates order collection
Quants HL Break
Ferhat Mutlu
5 (2)
LH ve HL kesintilerini bulmak için saf fiyat eylemiyle yapılan gelişmiş hesaplama. Piyasada size büyük bir geri dönüş noktası verecektir.LH ve HL sinyalleri trengle çıkışları için de kullanılabilir. Koparma gerçekleştiğinde, güçlü bir geri dönüş olduğunu gösterir.Hareketli Ortalamalar için güzel bir filtre.Bunu trend göstergeleriyle kullanmanızı şiddetle tavsiye ederim. Destek ve direnç, arz talep göstergeleri için ekstra bir onay olarak kullanılabilir. Daha fazla ayrıntı aşağıdaki forex iş p
Dynamic Forex28 Navigator
Bernhard Schweigert
4.43 (7)
Dynamic Forex28 Navigator - Yeni Nesil Forex Ticaret Aracı. ŞU ANDA %49 İNDİRİM. Dynamic Forex28 Navigator, uzun zamandır popüler olan göstergelerimizin evrimidir ve üçünün gücünü tek bir göstergede birleştirir: Gelişmiş Döviz Gücü28 Göstergesi (695 inceleme) + Gelişmiş Döviz İMPULS ve UYARI (520 inceleme) + CS28 Kombo Sinyalleri (Bonus). Gösterge hakkında ayrıntılar https://www.mql5.com/en/blogs/post/758844 Yeni Nesil Güç Göstergesi Ne Sunuyor?  Orijinallerde sevdiğiniz her şey, şimdi yeni
RFI levels PRO
Roman Podpora
5 (1)
Bu gösterge, fiyat dönüş noktalarını ve fiyat geri dönüş bölgelerini doğru bir şekilde gösterir.       Başlıca oyuncular   . Yeni trendlerin nerede oluştuğunu görüyorsunuz ve her işlem üzerinde kontrolü elinizde tutarak, azami hassasiyetle kararlar alıyorsunuz. TREND LINES PRO   göstergesiyle birlikte kullanıldığında maksimum potansiyelini ortaya koyar.  VERSION MT5 Göstergenin gösterdiği şey: Yeni bir trendin başlangıcında aktivasyonla birlikte tersine dönüş yapıları ve tersine dönüş seviyeler
Trend Catcher ind
Ramil Minniakhmetov
TREND YAKALAYICI GÖSTERGE Trend Yakalayıcı Gösterge, yazarın tescilli ve özelleştirilmiş uyarlanabilir trend analiz göstergelerinin bir kombinasyonunu kullanarak piyasa fiyat hareketlerini analiz eder. Kısa vadeli gürültüyü filtreleyerek ve temel momentum gücüne, volatilite genişlemesine ve fiyat yapısı davranışına odaklanarak gerçek piyasa yönünü belirler. Ayrıca, hareketli ortalamalar, RSI ve volatilite filtreleri gibi yumuşatma ve trend filtreleme özelleştirilmiş göstergelerinin bir kombina
Apollo SR Master , Destek/Direnç bölgelerinde alım satımı daha kolay ve güvenilir hale getiren özelliklere sahip bir Destek/Direnç göstergesidir. Gösterge, yerel fiyat zirvelerini ve diplerini tespit ederek Destek/Direnç bölgelerini herhangi bir gecikme olmadan gerçek zamanlı olarak hesaplar. Ardından, yeni oluşan Destek/Direnç bölgesini doğrulamak için, Destek/Direnç bölgesinin dikkate alınabileceğini ve gerçek bir SAT veya AL sinyali olarak kullanılabileceğini gösteren özel bir sinyal gösterir
Bu indikatörü satın alırsanız, Profesyonel Trade Manager’ımı  + EA   ÜCRETSİZ olarak alacaksınız. Öncelikle, bu Ticaret Sistemi'nin Non-Repainting, Non-Redrawing ve Non-Lagging Göstergesi olduğunu vurgulamak önemlidir, bu da hem manuel hem de robot ticareti için ideal hale getirir. Online kurs, kılavuz ve ön ayarları indir. "Smart Trend Trading System MT5", yeni ve deneyimli tüccarlar için özelleştirilmiş kapsamlı bir ticaret çözümüdür. 10'dan fazla premium göstergeyi birleştiriyor ve 7'den faz
GoldRush Trend Ok Sinyali GoldRush Trend Ok Sinyali göstergesi, XAU/USD'de yüksek hızlı, kısa vadeli scalperlar için özel olarak tasarlanmış hassas, gerçek zamanlı trend analizi sağlar. 1 dakikalık zaman dilimi için özel olarak tasarlanan bu araç, net giriş noktaları için yön okları gösterir ve scalper'ların değişken piyasa koşullarında güvenle hareket etmelerini sağlar. Gösterge, PRIMARY ve SECONDARY uyarı oklarından oluşur. PRIMARY sinyalleri, trend yönündeki değişikliği gösteren Beyaz ve
Introduction to Fractal Pattern Scanner Fractal Indicator refers to the technical indicator that makes use of the fractal geometry found in the financial market. Fractal Pattern Scanner is the advanced Fractal Indicator that brings the latest trading technology after the extensive research and development work in the fractal geometry in the financial market. The most important feature in Fractal Pattern Scanner is the ability to measure the turning point probability as well as the trend probabi
ŞU ANDA %40INDIRIMLI Yeni Başlayanlar veya Uzman Tüccarlar için En İyi Çözüm! Bu Gösterge benzersiz, yüksek kaliteli ve uygun fiyatlı bir ticaret aracıdır çünkü bir dizi tescilli özellik ve yeni bir formül ekledik. Sadece BİR grafik ile 28 Forex çifti için Döviz Gücünü okuyabilirsiniz! Yeni bir trendin veya scalping fırsatının tam tetik noktasını belirleyebildiğiniz için ticaretinizin nasıl gelişeceğini hayal edin? Kullanım kılavuzu: buraya tıklayın Bu ilk olan, orijinal! Değersiz bir özent
Market Structure Patterns MT4
Samuel Manoel De Souza
5 (18)
Market Structure Patterns ,   smart money concepts   (akıllı para kavramları) temelinde geliştirilen ve   SMC/ICT   öğelerini grafik üzerinde gösteren bir göstergedir. Bu öğeler, işlem kararlarınızı bir üst seviyeye taşımanıza yardımcı olur. Grafikte bir unsur oluştuğunda, fiyat bir seviyeyi geçtiğinde veya bir kutu/bölgeye girdiğinde,   uyarılar ,   bildirimler   ve   e-posta mesajları   aracılığıyla anında bilgilendirilirsiniz. Geliştiriciler,   global variables   (küresel değişkenler) aracılı
Advanced Supply Demand
Bernhard Schweigert
4.91 (300)
Özel Ticaret –%40 İndirim Yeni Başlayanlar veya Uzman Yatırımcılar İçin En İyi Çözüm! Bu gösterge, bir dizi özel özellik ve yeni bir formül içerdiği için benzersiz, yüksek kaliteli ve uygun fiyatlı bir işlem aracıdır. Bu güncelleme ile çift zaman dilimi bölgeleri gösterebileceksiniz. Sadece daha yüksek bir zaman dilimini değil, hem grafik zaman dilimini hem de daha yüksek zaman dilimini gösterebileceksiniz: İÇ İÇE GEÇMİŞ BÖLGELER GÖSTERİYOR. Tüm Arz Talep yatırımcıları buna bayılacak. :) Önem
Advanced UT BOT ALERTS for MT4 Profesyonel Çok Katmanlı Trend Tespit Sistemi | Geliştirilmiş UT BOT Motoru Yalnızca yüksek kaliteli göstergeler sunuyoruz. Advanced UT BOT , profesyonel kullanım için tasarlanmıştır. Kararlı sinyal mantığı ve güvenli hesaplama yapısı sayesinde gecikme veya hatalı güncelleme olmaz. Geçmiş sinyalleri yeniden çizmez, değiştirmez veya silmez. Tüm BUY ve SELL sinyalleri mum kapanışı gerçekleştikten sonra oluşturulur ve sabitlenir. Canlı işlem sırasında repaint yoktur
Bu göstergeye dayalı bonus EA'yı almak için satın aldıktan sonra benimle iletişime geçin. Self Optimizing Double MA Strategy, parametre tahminlerini ortadan kaldırmak için tasarlanmış profesyonel düzeyde bir ticaret aracıdır. Yerleşik bir otomatik optimizasyon motoruyla desteklenen bu sistem, istatistiksel bir avantajı korumak için arka planda binlerce parametre kombinasyonunu simüle ederek değişen piyasa koşullarına sürekli olarak uyum sağlar. Statik ve güncelliğini yitirmiş ayarlara güvenmek
Eğer Forex piyasasında işlem yapıyorsanız, döviz gücü ve döviz çiftleri arasındaki korelasyon hakkında ayrıntılı bilgi sahibi olmak, işlem performansınızı yeni bir seviyeye taşıyabilir. Korelasyon, riskinizi yarıya indirmenize yardımcı olurken, güç analizi kârınızı maksimize etmenizi sağlar. Bu gösterge, döviz gücü analizi ile döviz çiftleri korelasyonunu birleştirerek en uygun döviz çiftlerini seçmek için hibrit bir yaklaşım sunar. Döviz Gücü Analizi Nasıl Kullanılır Örneğin, işlem stratejiniz
CRT Candle Range Theory HTF MT4.   Ultimate CRT Indicator: Advanced ICT Concepts and Malaysian SnR Trading System Discounted   Price   $50  !!     Secure your lifetime access   now   before it switches to   subscription-only ! Master the Market Maker's Footprints with the Most Advanced Candle Range Theory Indicator Unlock the true power of   Smart Money Concepts (SMC)   and trade precisely like the institutions with the   Ultimate CRT Indicator . Built exclusively for serious traders, this indic
Day Trader Master , günlük tüccarlar için eksiksiz bir ticaret sistemidir. Sistem iki göstergeden oluşmaktadır. Bir gösterge, satın almak ve satmak için bir ok işaretidir. Aldığınız ok göstergesidir. Size ikinci göstergeyi ücretsiz olarak sağlayacağım. İkinci gösterge, bu oklarla birlikte kullanılmak üzere özel olarak tasarlanmış bir trend göstergesidir. GÖSTERGELER TEKRARLAMAYIN VE GEÇ KALMAYIN! Bu sistemi kullanmak çok basittir. İki renkli bir çizgi olarak görüntülenen mevcut trend yönündeki o
KURAMA GOLD SIGNAL PRO (MT4) — 7 Katmanlı Filtre, Otomatik TP/SL ve Kalite Puanı ile Komple XAUUSD Trading Sistemi REPAINT YOK. YENİDEN ÇİZİM YOK. GECİKME YOK. Her sinyal kalıcıdır. Gördüğün, aldığındır. BONUS: Ömür boyu lisansı al ve AI Zone Radar ($59 değerinde) + tam PDF kılavuzunu ÜCRETSİZ al. Satın aldıktan sonra bana mesaj gönder. AI Zone Radar: https://www.mql5.com/en/market/product/175834 TRADERLAR GÜVENİYOR: Aktif bir Altın trader topluluğu tarafından zaten kullanılıyor. Hassasiyet
" Dynamic Scalper System " göstergesi, trend dalgaları içinde işlem yapmak için scalping yöntemi için tasarlanmıştır. Başlıca döviz çiftleri ve altın üzerinde test edilmiştir, diğer işlem araçlarıyla uyumluluğu mümkündür. Ek fiyat hareketi desteğiyle trend boyunca pozisyonların kısa vadeli açılması için sinyaller sağlar. Göstergenin prensibi. Büyük oklar trend yönünü belirler. Küçük oklar şeklinde scalping için sinyaller üreten bir algoritma trend dalgaları içinde çalışır. Kırmızı oklar yüksel
Master head and shoulders patterns for better trading decisions A head and shoulders pattern is a chart formation that resembles a baseline with three peaks, the outside two are close in height and the middle is highest. It predicts a bullish-to-bearish trend reversal and is believed to be one of the most reliable trend reversal patterns. It is one of several top patterns that signal, with varying degrees of accuracy, that a trend is nearing its end. [ Installation Guide | Update Guide | Trouble
Trade double tops and bottoms effectively The PZ Double Top/Bottom Indicator is a technical analysis tool that helps traders identify potential price reversal patterns in the market. These patterns, known as double tops and bottoms, are characterized by two consecutive peaks or valleys in the price of an asset. Double tops and bottoms are often seen as potential reversal patterns because they can signal a change in the direction of the current trend. [ Installation Guide | Update Guide | Troubl
Apex Break PRO, MetaTrader 4 için yeniden çizim yapmayan bir pivot trend çizgisi kırılım göstergesidir. Pivot yükseklerini ve pivot düşüklerini tespit eder, ardışık pivotlar arasında dinamik eğimli trend çizgileri çizer ve fiyat onaylanmış bir bar kapanışında bu trend çizgilerini kırdığında alım ve satım sinyalleri üretir. Her sinyal en fazla dört bağımsız konfluans katmanından geçirilerek filtrelenir — EMA trendi, RSI sınırları, hacim ani artış tespiti ve ADX trend gücü — ve yıldız derecelendir
Yazarın diğer ürünleri
True Momentum LPD
Safwan Rushdi Khalil Arekat
MT5 Version : Pre Note : The indicator uses the Open price value for calculations. This indicator represents a genuine momentum oscillator according to the true definition of "Momentum", and as realised by the techniques of digital filters. Scholarly papers   on the subject   by the current developer can be found   here  and here , but in this description we shall borrow only the minimum of conceptual and mathematical framework needed. In the process, we expose some long-held myths about indica
FREE
True Momentum
Safwan Rushdi Khalil Arekat
5 (7)
This indicator represents a genuine momentum oscillator according to the true definition of "Momentum", and as realised by the techniques of digital filtering. ( Note : download a complete set of true momentum oscillators  here ). A scholarly paper on the subject   by the current developer can be found here , but in this description we shall borrow only the minimum of conceptual and mathematical framework needed. In the process, we expose some long-held myths about indicators supposedly measurin
FREE
Jerk Indicator
Safwan Rushdi Khalil Arekat
5 (1)
In physics, "Jerk" is the third time-derivative of position, with acceleration being the second derivative and velocity the first derivative. In technical analysis, the first derivative of price is the price momentum, with the second derivative,acceleration, being seldom used and the third derivative virtually unknown. The magnitude frequency response of a digital differentiator is a positive-slope straight line passing through zero frequency. Therefore, every instance of a digital signal differ
FREE
Top Gun Oscillators
Safwan Rushdi Khalil Arekat
5 (2)
Note : New in 1.6: the indicator now exports the trade signal (but not displayed). Go long with light blue. Go short with red. Exit otherwise. Signal to be imported to your EA using iCustom. This indicator provides Best of the Best linear filter momentum oscillators that I am aware of (Low Pass Differentiators, LPD's) . All of them are  recent developments by this developer, or other researchers. The oscillator line is the first buffer of the indicator, and can be called  in other indicators or
FREE
This indicator does not process the price chart data and does not provide trading signals. Instead, it is  an application to compute and display the frequency response of many conventional indicators. Moving averages like the SMA, LWMA and EMA, and  oscillators like the MACD, CCI, Awsome Osc, all have the form of digital filters. Electronic engineers use a special method to characterise the performance of these filters by studying their frequency response. Two important quantities of the freque
FREE
Commodity Channel Index Corrected
Safwan Rushdi Khalil Arekat
5 (1)
This indicator resolves an unrecognised defect in the Commodity Channel Index Oscillator (CCI). The CCI is based on a high pass filter calculated by subtracting the p-period simple moving average of a price signal (usually typical value) from the price signal itself. Then, the result is divided by the absolute mean deviation of the same period. The frequency response of a signal minus its simple moving average is shown in the first screen shot (in Blue). (see my free indicator : Q n D Frequency
FREE
Price Rectifier Signals
Safwan Rushdi Khalil Arekat
This indicator provides trading signals based on the polarity of the dynamical parameters of two digital signals. The dynamical parameters (momentum-acceleration) are derived by applying a high quality momentum oscillator, MTEMA LPD ( see Top Gun Oscillators ) to two digital signals. The MTEMA momentum oscillator is first applied to the price itself. Then, a rectification procedure is applied to the price based on the signals from the momentum oscillator yielding a rectified price signal. This s
FREE
Price Change Distributions
Safwan Rushdi Khalil Arekat
This indicator demonstrates that the price change of financial instruments is NOT a random walk process, as advocated by the "Random Walk Hypothesis", and as popularised by the bestselling book "A Random Walk Down Wall Street". I wish that were the case!  It is shown here that the real situation with price change is actually much worse than a random walk process!  Deceptive market psychology, and the bulls-bears tug of war, stack up the odds against traders in all instruments, and all time frame
FREE
Latest Changes in 1.6 :  Added Signal Modes input. Mode 1 : HPF positive go long blue, HPF negative go short red. Mode 2 : slow envelope only, HPF above upper envelope go long blue, HPF below lower envelope go short red. Mode 3 : HPF above both upper envelopes - go long blue, HPF below both lower envelopes go short red. Mode 4 : Go long blue if HPF crosses above upper slow, but fast upper should be below slow upper at the time, exit when HPF crosses below upper fast, reverse logic for short red
FREE
High Pass Filter Candlesticks
Safwan Rushdi Khalil Arekat
This indicator applies the  biquad high pass filter to the price-chart data, and displays the filter output for the OHLC as candlesticks. The candlesticks corresponds to the actual calculations of the filter value  during the formation of each price bar (not from all historical highs lows or closes). The shape of the bars therefore corresponds directly to the shape of each price bar. High pass filters are an underappreciated type of oscillator that are seldom used in technical analysis in the st
FREE
Volatility Limit Trend
Safwan Rushdi Khalil Arekat
Volatility Limit Trend Indicator (VLT), an original indicator by this developer,  is a trend indicator based on setting a fixed volatility limit as a percentage of price. Volatile price is allowed to wander between two channel lines defining the fixed volatility about a central line. The price crossing one of the channel lines defines an exceeding of the allowed volatility, and ushering in one of two situation : either a continuation or a reversal of trend. The first buffer of the indicator (not
FREE
MUST READ CAUTION BEFORE PURCHASE This  one-of-a-kind indicator displays the instantaneous high resolution High Time Frame Relative Strength Index  (HTF RSI), where  up to three higher time-frame RSI's can be displayed simultaneously on the current chart. The indicator differs drastically from previous multi-time-frame RSI indicators in that it displays  the high resolution bar-by-bar calculation of the HTF RSI - and not just the discrete values at the HTF bar closings. This allows for earlier
Filtrele:
Elijah Montefalco
185
Elijah Montefalco 2024.05.31 03:42 
 

Kullanıcı değerlendirmeye herhangi bir yorum bırakmadı

Değerlendirmeye yanıt