MACD Divergence Full
- Göstergeler
-
Mihails Babuskins
 Senior developer for financial markets.
Contact me: Forex.terminology@outlook.com
🔵 Telegram group link: https://t.me/CommunityAndChat - Sürüm: 1.5
- Güncellendi: 8 Ocak 2025
- Etkinleştirmeler: 19
- Contact me after payment to send you the User-Manual PDF File.
Divergence detection indicator with a special algorithm.
But finding opportunities for trading with the eyes is very difficult and sometimes we lose those opportunities.
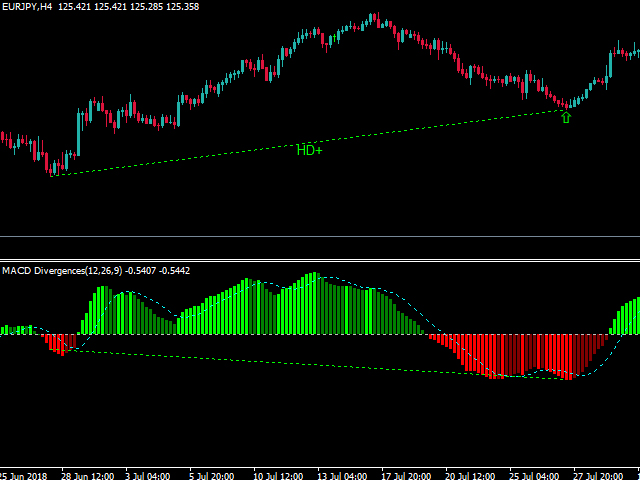
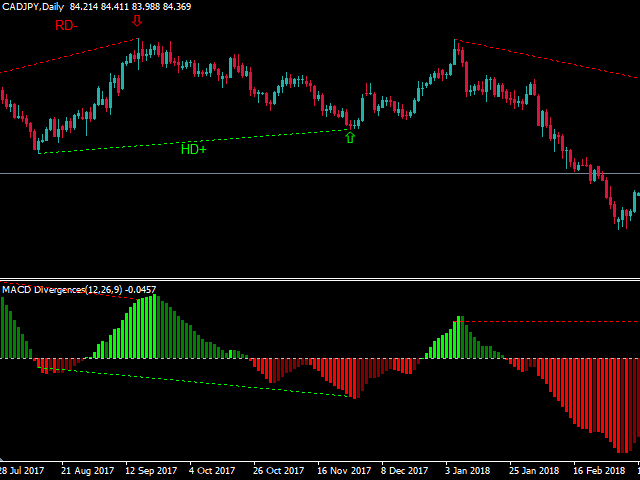
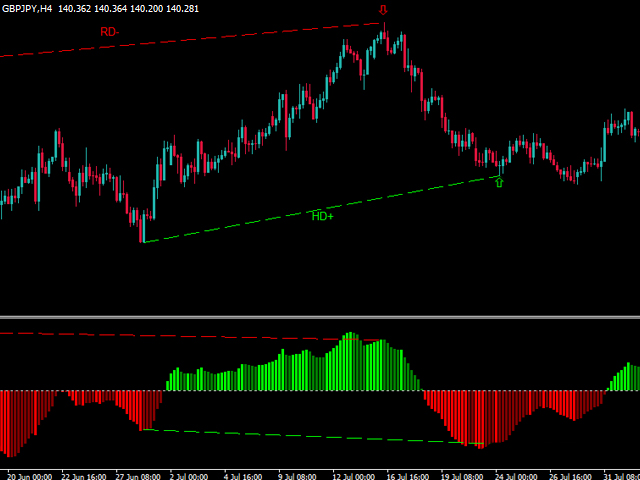
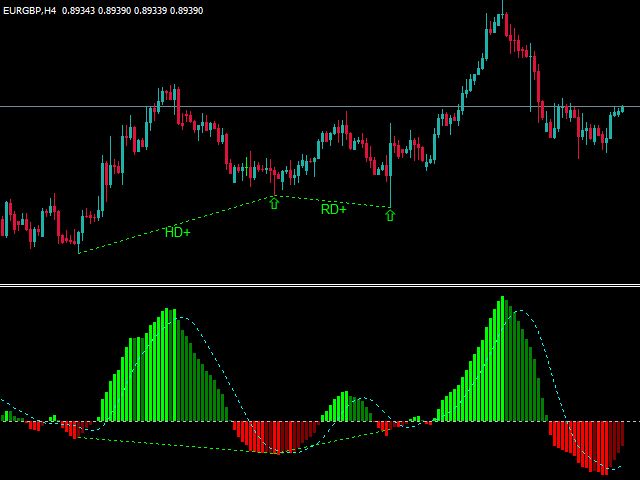
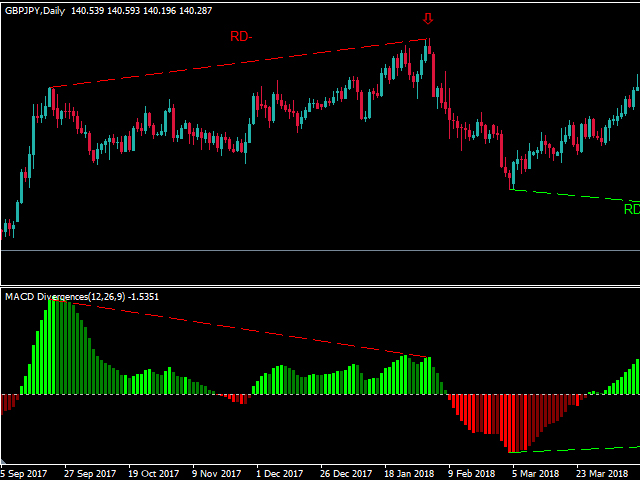
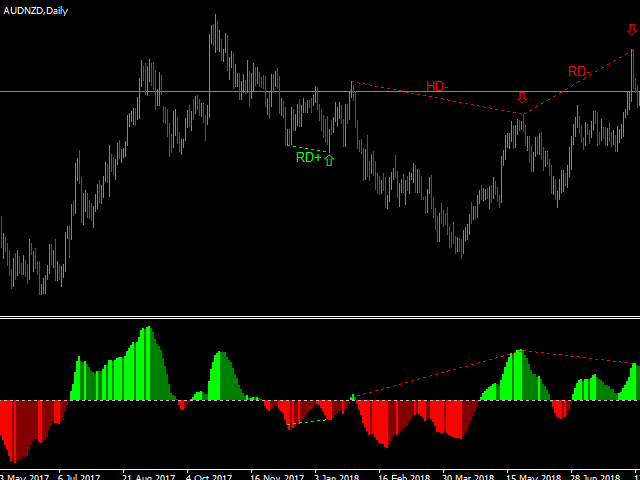
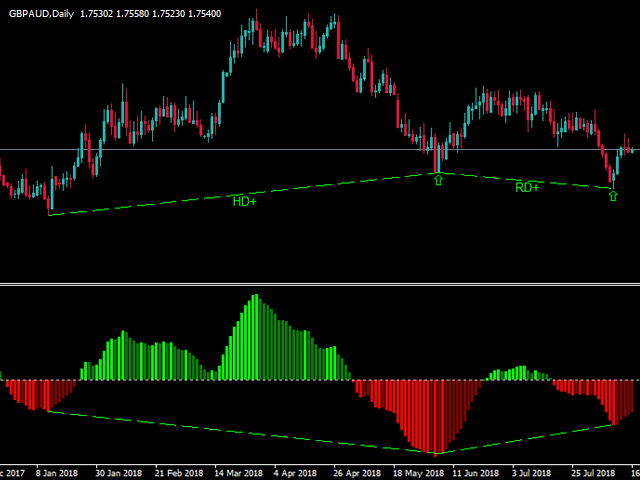
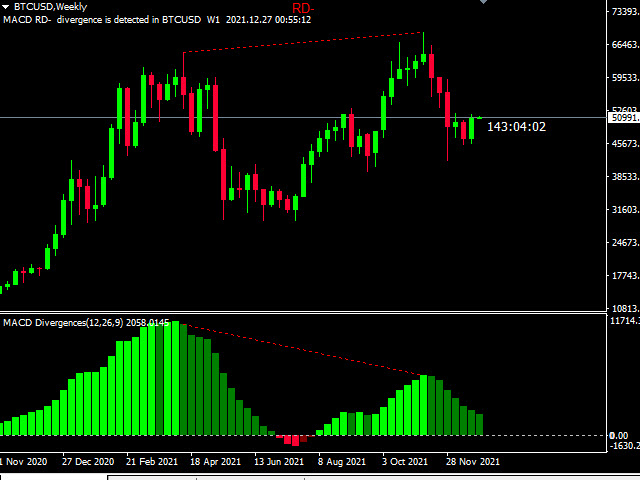
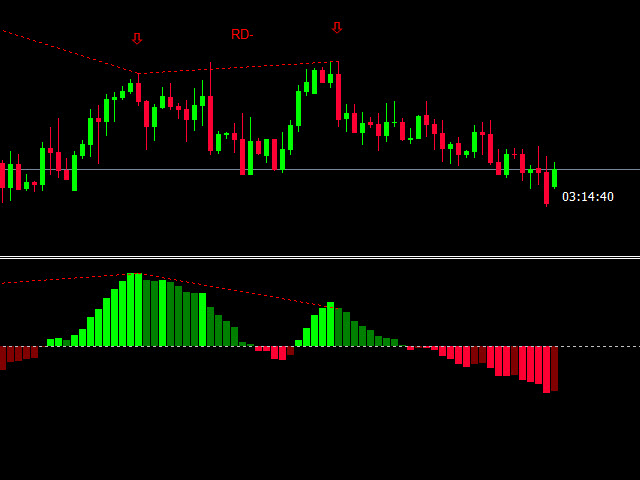
The indicator finds all the regular and hidden divergences. (RD & HD)
It uses an advanced method to specify divergence.
This indicator is very functional and can greatly improve the outcome of your trading.
This is a multi-time-frame indicator (Under M15 is not recommended).
You can change colors as you like.
Detection method:
Indicator detects price pivots and checks the corresponding value of pivots on MACD (12,26,9) indicator.
When a divergence is detected (price movement and oscillator in the opposite direction), it is plotted bylines in the chart and oscillator.
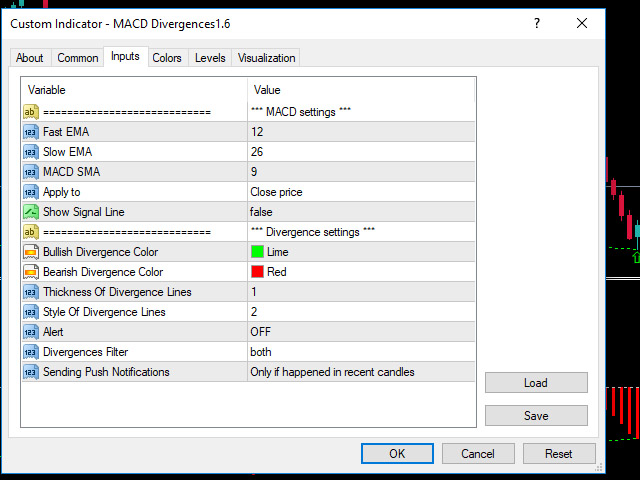
Indicator Parameters
- MACD Settings:
- Fast EMA
- Slow EMA
- MACD SMA
- Apply to
- Show Signal Line
- Divergence Settings:
- Bullish Divergence Color
- Bearish Divergence Color
- Thickness Of Divergence Lines
- Style Of Divergence Lines
- Alert (You can enable or disable Alert)
- Divergences Filter (You can choose to show regular or hidden divergences or both)
- Sending Push Notifications (the user can choose to send push notifications or not)
How to test the MACD Divergences indicator?
If you want to test the indicator, download the demo version , that is free and fully functional for EURAUD.


It's a great indicator which so far has been very accurate. Again, support from the author is amazing. This diserves 5*****