Harmonic Pattern Dashboard

4.2

harmonic patterns  

Harmonic patterns can be used to spot new trading opportunities and pricing trends – but only if you know exactly what you are looking for.

Harmonic patterns are formed by combining geometric shapes and Fibonacci levels. As a result, Fibonacci levels are the key concept of these patterns. Identifying harmonic patterns requires more practice than other market classical patterns. But by learning these patterns, you can recognize the future trend of the price chart.

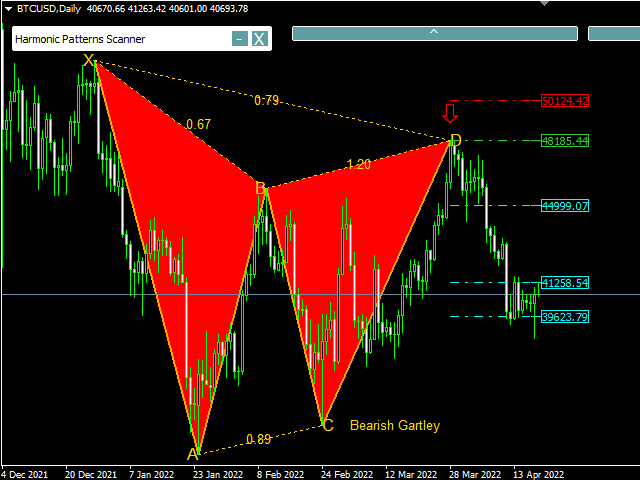
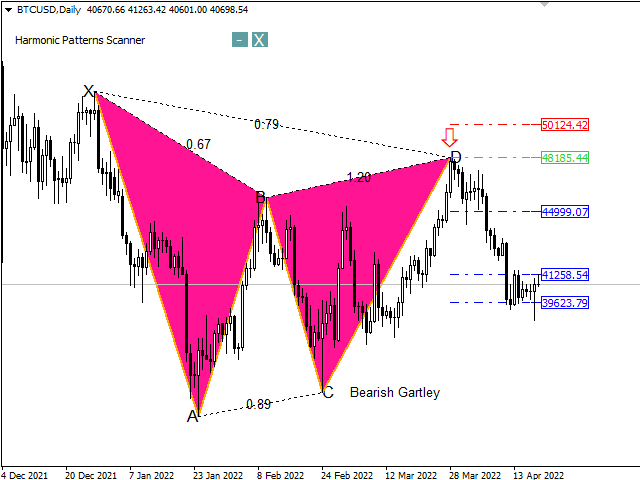
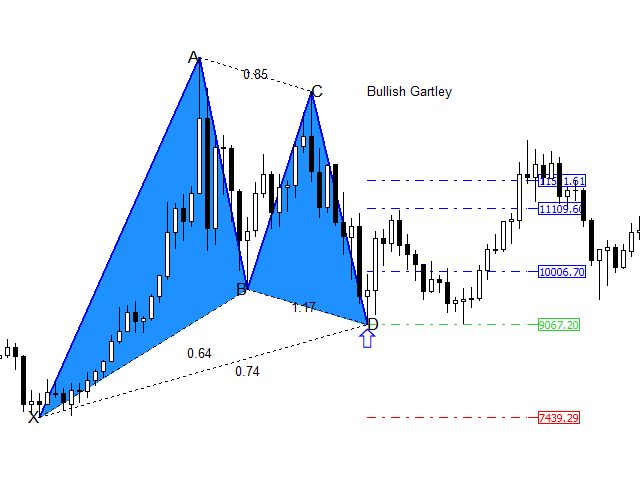
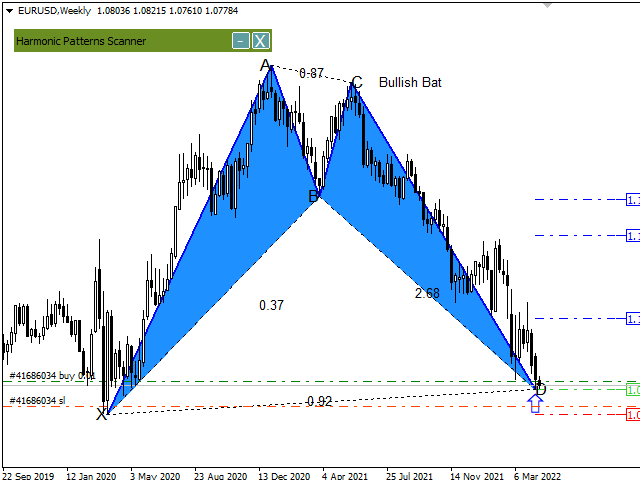
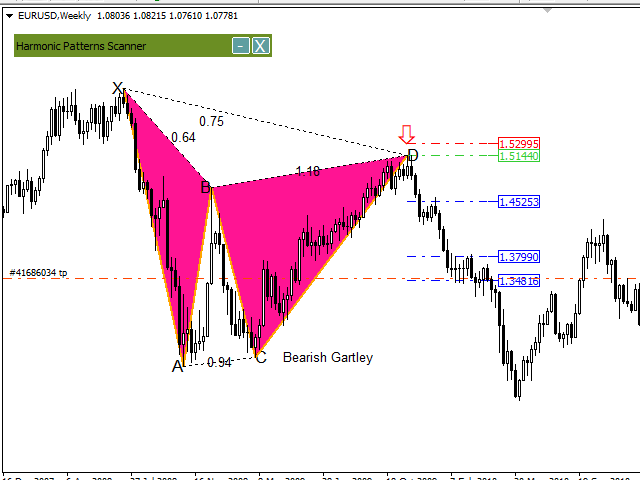
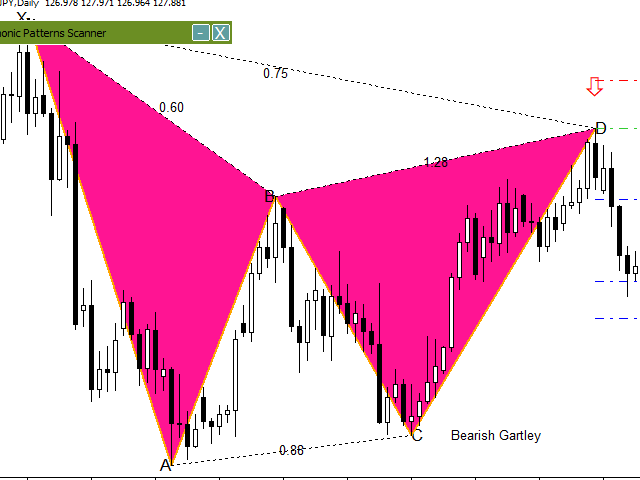
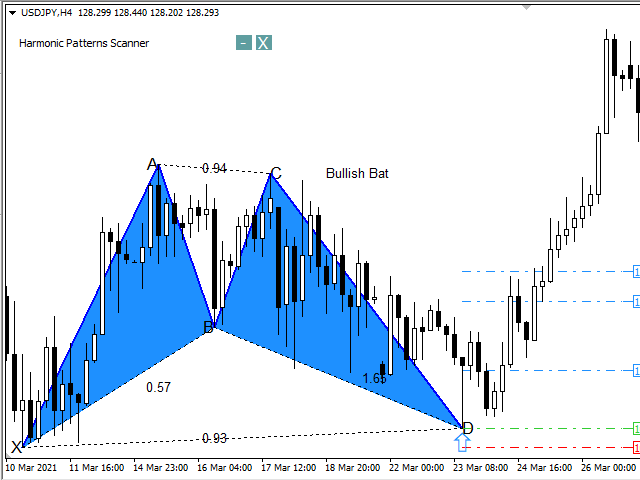
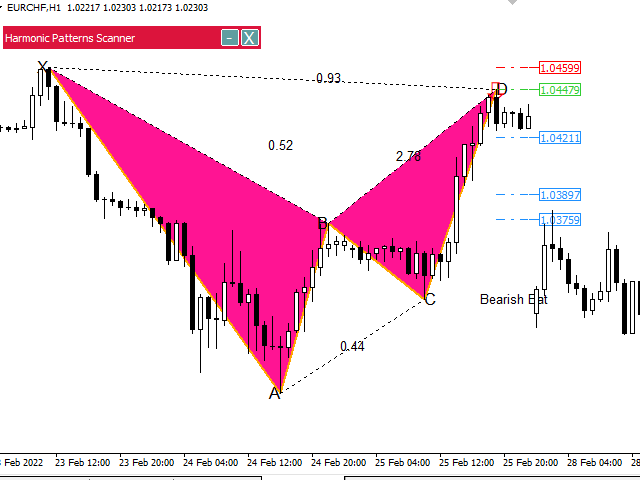
These patterns often appear as M and W figures, or a combination of both. By calculating Fibonacci ratios between important points in the pattern, you can estimate price growth or decline.
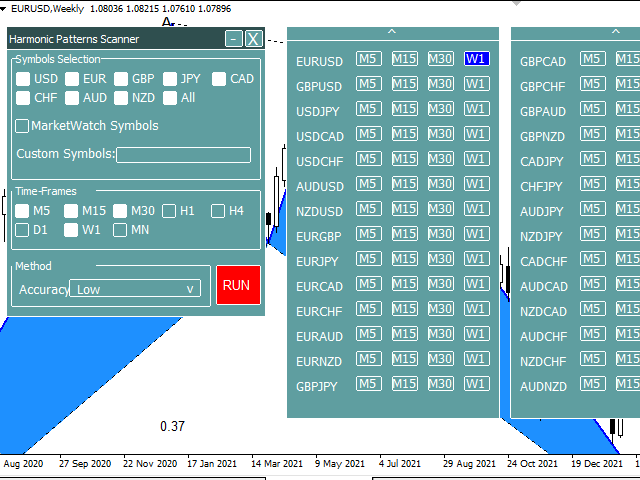

Full Chart Scanner

Recognition of harmonic patterns requires high calculations and accuracy. For this reason, it is relatively difficult for a trader. This indicator automatically does this for you, Select the symbols and timeframes, then press the “RUN” button, that's all.

This indicator scans the chart to find the following patterns:

  •  The Batpattern       
  •  The Gartley pattern
  •  The Butterfly pattern
  •  The Crab pattern
  •  The Deep Crab pattern
  •  The Shark pattern
  •  The ALT Batpattern

Why are harmonic patterns so popular in forex trading?

Forex traders love harmonic patterns, as they are particularly well suited to the real-time dynamics of the foreign exchange markets. When they are correctly used, they can warn a trader when underlying conditions are likely to result in a price drop, based on historical data.


Which time frame and symbols can the indicator be used?

You will be able to use this indicator in all time frames and all symbols.

The indicator can be used in Forex market, Stock, Crypto and Commodities market.


Indicator features

·           Do not repaint.

·           High Win Rate 

·           With a golden dashboard. Select your favorite symbols and timeframes with just a few clicks.

·           Special user interface, easy to use.

·           Full simultaneous scan of up to 1600 symbol-timeframes.

·           High speed compared to similar products on the market (using optimal search algorithms)

·           Drawing ordering guide lines.

·           Send alerts and notifications if pattern is detected.

·           Ability to customize the user interface


İncelemeler 6
Tuanyer De Los Santos
1478
Tuanyer De Los Santos 2023.05.18 17:08 
 

The Scanner is very good and fast. I tested and Im using other tecnical indicator and analisys as a second confirmation and is realy good. I like beacuse i can see all timeframe as per selection. Now , I bougth 123 patter scanner, wait for my comment, but for sure will be good. Your are doing a great job and put all easy for the traders.

NITINAN SHOTNITICHAIYASAN
99
NITINAN SHOTNITICHAIYASAN 2022.12.13 16:44 
 

It's the best Harmonic Pattern, it's an accurate reversal point, thank you.

lauro1956
5742
lauro1956 2022.10.07 08:26 
 

Good indicator, it fulfills its function and does not load the system. Good price too.

Önerilen ürünler
PZ Harmonacci Patterns
PZ TRADING SLU
3.17 (6)
Trade smarter, not harder: Empower your trading with Harmonacci Patterns This is arguably the most complete harmonic price formation auto-recognition indicator you can find for the MetaTrader Platform. It detects 19 different patterns, takes fibonacci projections as seriously as you do, displays the Potential Reversal Zone (PRZ) and finds suitable stop-loss and take-profit levels. [ Installation Guide | Update Guide | Troubleshooting | FAQ | All Products ] It detects 19 different harmonic pric
Volume Compair
Thiago Pereira Pinho
Professional Cumulative Delta & Volume Median Indicator Track   real buying/selling pressure   with this powerful volume analysis tool. The   Volume Compare Indicator   combines   Cumulative Delta   and   Volume Medians   to help you identify institutional activity, imbalances, and potential reversals. Key Features: Cumulative Delta Histogram   – Visualizes net buying vs. selling volume in real-time. Buy/Sell Volume Medians   – Horizontal lines showing average buy & sell volume levels. Smart Vo
The Visual Volatility Clustering indicator clusters the market based on volatility. The indicator does not redraw and gives accurate data, does not use closing prices. Uses the opening prices or the highs or lows of the previous completed bar. Therefore, all information will be clear and unambiguous. The essence of the indicator is to divide the price market into certain areas according to a similar type of volatility. This can be done in any way. In this example, the indicator is configured fo
Monster Harmonic Indicator
Paul Geirnaerdt
4.59 (29)
Monster Harmonics Indicator is a harmonic pattern indicator. It recognizes Gartley, Bat, Crab, Butterfly, Cypher, White Swan, Black Swan, Shark and several other patterns. Projected patterns that are not yet completed are recognized, too. Monster even shows the PRZ (Potential Reversal Zone). Users can add their own user defined patterns to Monster. Besides the current pattern, Monster also shows all patterns in the symbols history. Monster will provide alerts for developing patterns. Introduced
Overview Harmonic Patterns MT4 is a technical analysis indicator designed for the MetaTrader 5 platform. It identifies and displays harmonic price patterns, such as Butterfly, Cypher, Crab, Bat, Shark, and Gartley, in both bullish and bearish directions. The indicator calculates key price levels, including entry, stop loss, and three take-profit levels, to assist traders in analyzing market movements. Visual elements and customizable alerts enhance usability on the chart. Features Detects six ha
UPD1 Volume Pixel
Vitaliy Kuznetsov
5 (3)
Gösterge, verilen katsayılara göre düşük, yüksek, aşırı hacim bulur ve bunları belirtilen renklerle boyar. Metatrader terminalindeki standart hacim çizim işlevinin yerini alır. Mumlar ayrıca hacim renginde boyanabilir. Aşırı hacimli mumlarda maksimum yatay hacim (küme/POC) belirlenir. Konumuna bağlı olarak (itme, nötr, durdurma) kümenin de kendi rengi vardır. Küme gölgede ise ve mum aşırı hacme sahipse, o zaman oku tersine çeviririz. Uyarıyı ayarlardan etkinleştirebilirsiniz. Ayrıca, göstergede
Overview  Market Structure Analysis Indicator MT4 Structure Analysis Indicator   automatically identifies Market Structure based on Smart Money Concepts (SMC). It clearly displays Break of Structure (BoS), Change of Character (CHoCH), Higher Highs, Higher Lows, Lower Highs, and Lower Lows in real-time. Key Features Automatic Market Structure Detection   Break of Structure (BoS)   - Price breaks previous structure in trend direction   Change of Character (CHoCH)   - Trend reversal sig
Indicator (includes Volume Profile + Order Blocks) - a revolutionary indicator that combines two of the most powerful concepts of modern technical analysis: volume profiles and institutional players' order blocks. This tool allows you to see what is hidden from most traders and gives you a significant advantage in the market. Key benefits of the indicator: Visualization of "smart money": Clearly shows the areas of concentration of large players, highlighting areas with maximum volume in bright
İşlem hacimlerine ilişkin okumaları hesaplayan teknik bir gösterge. Histogram biçiminde, ticaret enstrümanının hareket gücünün birikimini gösterir. Yükseliş ve düşüş yönleri için bağımsız hesaplama sistemlerine sahiptir. Herhangi bir ticaret enstrümanı ve zaman dilimi üzerinde çalışır. Herhangi bir ticaret sistemini tamamlayabilir. Gösterge değerlerini yeniden çizmez, sinyaller mevcut mum üzerinde görünür. Kullanımı kolaydır ve grafiği yüklemez, ek parametre hesaplamaları gerektirmez. Değiştiril
This is a new strategy for SUPPLY DEMAND areas It is based on a calculation using the tick volume to detect the big price action in market for both bear /bull actions this smart volume action candles are used to determine the supply and demand areas prices in between main supply and demand lines indicate sideway market  up arrows will be shown when prices moves above the main supply and the secondary supply lines Down arrows will be shown when prices moves below the main demand and the secondary
Turkish Avantajların Açıklaması (Koddan bahsetmeden) 1. Detaylı Piyasa Ayrımı (3 Boyutlu) Sadece Yukarı/Aşağı değil, "Yatay" (Sideways) hareketleri de ayırır. Alış baskısı (Boğa). Satış baskısı (Ayı). Önemli: Piyasanın yönsüz olduğu zamanları gösterir. 2. Osilatör ile Güç Ölçümü (0-100) Aşırı Bölgeler: Aşırı Alım/Aşırı Satım bölgelerini (örn. >80, <20) belirler. Alan Dolgusu: Kritik bölgeleri renklendirerek görselleştirir. 3. Gürültü Filtreleme Esnekliği (Yumuşatma) Sinyal Temizleme: Piyasa gürü
The new update makes this indicator a complete tool for studying, analyzing and operating probabilistic patterns. It includes: On-chart Multi-asset percentage monitor. Configurable martingales. Twenty-one pre-configured patterns , including Mhi patterns and C3. An advanced pattern editor to store up to 5 custom patterns. Backtest mode to test results with loss reports. Trend filter. Hit operational filter. Martingale Cycles option. Various types of strategies and alerts. Confluence between patte
Sweet Waffle
Christophe Godart
The arrows are calculated with: -     2 Parabolic  parameters -     2 ADX parameters -     4 Stochastic parameters We recommend to combine it with Parabolic, ZigZag or Elliot waves indicator. Always trade the trend! If you make sure to draw your trend lines and support/resistance zones you will just have to wait for the signal to appear. Take the trade. For Binary Options it is advisable to set the expiry time to 5-15 min in M1 chart. THIS INDICATOR IS ZERO REPAINT Best assets to trade: - EUR
Bu, bir mumun kapanış fiyatını tahmin eden bir göstergedir. Gösterge öncelikle D1 çizelgelerinde kullanılmak üzere tasarlanmıştır. Bu gösterge hem geleneksel forex ticareti hem de ikili opsiyon ticareti için uygundur. Gösterge, bağımsız bir ticaret sistemi olarak kullanılabilir veya mevcut ticaret sisteminize ek olarak hareket edebilir. Bu gösterge, mevcut mumu analiz ederek mumun gövdesi içindeki belirli güç faktörlerini ve önceki mumun parametrelerini hesaplar. Böylece gösterge, piyasa hareket
Trend Bilio - an arrow indicator without redrawing shows potential market entry points in the form of arrows of the corresponding color: upward red arrows suggest opening a buy, green down arrows - selling. The entrance is supposed to be at the next bar after the pointer. The arrow indicator Trend Bilio visually "unloads" the price chart and saves time for analysis: no signal - no deal, if an opposite signal appears, then the current deal should be closed. It is Trend Bilio that is considered
The   Fibonacci Confluence Toolkit   is a technical analysis tool designed to help traders identify potential price reversal zones by combining key market signals and patterns. It highlights areas of interest where significant price action or reactions are anticipated, automatically applies Fibonacci retracement levels to outline potential pullback zones, and detects engulfing candle patterns. Its unique strength lies in its reliance solely on price patterns, eliminating the need for user-define
The indicator detects and displays Shark harmonic pattern (see the screenshot). The pattern is plotted by the extreme values of the ZigZag indicator (included in the resources, no need to install). After detecting the pattern, the indicator notifies of that by a pop-up window, a mobile notification and an email. The indicator highlights the process of the pattern formation and not just the complete pattern. In the former case, it is displayed in the contour triangles. After the pattern is comple
SMC Venom Model BPR göstergesi, Akıllı Para (SMC) konseptinde çalışan yatırımcılar için profesyonel bir araçtır. Fiyat grafiğinde iki temel modeli otomatik olarak belirler: FVG   (Adil Değer Açığı), ilk ve üçüncü mum arasında boşluk bulunan üç mumun birleşimidir. Hacim desteğinin olmadığı seviyeler arasında bir bölge oluşturur ve bu da sıklıkla fiyat düzeltmesine yol açar. BPR   (Dengeli Fiyat Aralığı), bir "köprü" oluşturan iki FVG modelinin birleşimidir - bir kırılma bölgesi ve fiyatın düşük
EARLY REMINDER: The Starting price is 65 price will rise soon up to 365$ and then 750$ after first 10 copies of sales. Grab this offer now! Introduction Hello, traders! Welcome to the demonstration of the Forex Beast Indicator , a comprehensive tool designed to assist aspiring traders in navigating the complexities of the forex market. This indicator incorporates seven essential components to provide a well-rounded trading experience: Moving Averages Colored Zones Support and Resistance Levels
PZ Penta O MT4
PZ TRADING SLU
2.33 (3)
The Penta-O is a 6-point retracement harmonacci pattern which usually precedes big market movements. Penta-O patterns can expand and repaint quite a bit. To make things easier this indicator implements a twist: it waits for a donchian breakout in the right direction before signaling the trade. The end result is an otherwise repainting indicator with a very reliable trading signal. The donchian breakout period is entered as an input. [ Installation Guide | Update Guide | Troubleshooting | FAQ | A
FREE
Most of those who trade in Forex are aware of the Elliott Wave Analysis System. So what is this wave analysis: This is the study and analysis of price, and not its derivatives (various indicators); The ability to determine price targets using Fibonacci tools (Elliott waves are closely related to Fibonacci numbers). You can get a clear picture of the market at all time scales; With EWA, it is possible to build a trading system with a clear description of the inputs and outputs. For simplicity, t
Reversal Pattern Pro
Boonyapagorn Rodvattanajinda
Reversal Patterns Pro Reversal Patterns Pro is a Price Action (PA) analytical tool that scans the reversal patterns.  - Finds and marks the most dependable Japanese candlestick patterns in real-time. - Supports all time frames (Best for Scalping) - Doesn't repaint making it an exceptional indicator for Expert Advisors. Input parameters : - Support & Resistance Mode ( true or false ) for enabling advanced filtering - Donchian Period - RSI Period - RSI Oversold Level - RSI Overbought Level - Al
Super Arrow Indicator for MetaTrader 4 The Super Arrow indicator is a popular signal tool designed for the MetaTrader 4 platform. It combines multiple technical indicators—such as the RSI , Bollinger Bands , Moving Averages , and a Magic Filter —to identify key market reversal points and pivot highs and lows. On the chart, green arrows highlight pivot lows, while red arrows mark pivot highs. By merging these indicators into one system, Super Arrow provides a strong filtering mechanism capable of
The Super Arrow Indicator provides non-repainting buy and sell signals with exceptional accuracy. Key Features No repainting – confirmed signals remain fixed Clear visual arrows: green for buy, red for sell Real-time alerts via pop-up, sound, and optional email Clean chart view with no unnecessary clutter Works on all markets: Forex, gold, oil, indices, crypto Adjustable Parameters TimeFrame Default: "current time frame" Function: Sets the time frame for indicator calculation Options: Can be set
ProEngulfing
Ashkan Hazegh Nikrou
4.5 (2)
ProEngulfing Tanıtımı - MT4 için Profesyonel Engulf Model Göstergeniz ProEngulfing ile hassasiyetin gücünü keşfedin, forex piyasasındaki nitelikli engulf modellerini tanımlamak ve vurgulamak üzere tasarlanmış son teknoloji bir göstergedir. MetaTrader 4 için geliştirilen ProEngulfing, forex piyasasındaki engulf modellerini tanımlama konusunda titiz bir yaklaşım sunarak, ticaret kararlarınız için yalnızca en güvenilir sinyalleri almanızı sağlar. ProEngulfing Nasıl Çalışır: ProEngulfing, engulf mo
PZ Wolfe Waves
PZ TRADING SLU
1 (1)
Precision trading: leverage wolfe waves for accurate signals Wolfe Waves are naturally occurring trading patterns present in all financial markets and represent a fight towards an equilibrium price. These patterns can develop over short and long-term time frames and are one of the most reliable predictive reversal patterns in existence, normally preceding strong and long price movements. [ Installation Guide | Update Guide | Troubleshooting | FAQ | All Products ] Clear trading signals Amazingly
Fair value gap (FVG) = Imbalance zone Fair value gap Indicator MT4 is the most accurate and customizable indicator on the market. It was developed to facilitate the analysis of operations based on candlestick patterns and supply-demand zones. These zones are possible movement reversal points. For this indicator is generated by the order block of smart money concept. High Time Frame (HTF) To Find High Quality Order Block Low Time Frame (LTF) To Find a secure Entry W1 D1, H4 D1 H4, H1, M30 H4 H1
Blahtech Market Profile
Blahtech Limited
4.53 (15)
Was: $249  Now: $99   Market Profile defines a number of day types that can help the trader to determine market behaviour. A key feature is the Value Area, representing the range of price action where 70% of trading took place. Understanding the Value Area can give traders valuable insight into market direction and establish the higher odds trade. It is an excellent addition to any system you may be using. Blahtech Limited presents their Market Profile indicator for the MetaTrader community. Ins
The indicator allows you to trade binary options. The recommended time frame is М1 and the expiration time is 1,2,3 minutes. The indicator suitable for auto and manual trading. A possible signal is specified as a arrows above/under a candle. You should wait until the candle closes! Arrows are not re-painted Trade sessions: TOKYO section (Half-end) Currency pairs: USD/JPY Working time frame: M1 Expiration time: 1,2,3 minutes. The indicator also shows good results when using the martingale strateg
FREE
Voenix
Lorentzos Roussos
4.58 (12)
Harmonik desen tarayıcı ve tüccar. Bazı Grafik desenleri de Dahil edilen desenler: ABCD deseni Gartley deseni yarasa deseni şifre deseni 3Sürücü deseni Siyah Kuğu deseni Beyaz Kuğu deseni Quasimodo deseni veya Üzeri Alt deseni Alternatif Yarasa deseni kelebek deseni Derin Yengeç deseni Yengeç deseni Köpekbalığı deseni FiveO deseni baş ve omuzlar desen Artan Üçgen deseni bir iki üç desen Ve 8 özel desen Voenix, 25 çizelge ve fibonacci modelini destekleyen çok zaman dilimli ve çok çiftli bir harm
Bu ürünün alıcıları ayrıca şunları da satın alıyor
Miraculous Göstergesi – Gann Dokuz Kareye Dayalı %100 Tekrarlamayan Forex ve İkili Araç Bu video, Forex ve İkili Opsiyon traderları için özel olarak geliştirilmiş son derece doğru ve güçlü bir ticaret aracı olan Miraculous Göstergesi 'ni tanıtıyor. Bu göstergeyi benzersiz kılan, efsanevi Gann Dokuz Karesi ve Gann Titreşim Yasası 'na dayanmasıdır; bu da onu modern ticarette mevcut en hassas tahmin araçlarından biri yapmaktadır. Miraculous Göstergesi tamamen tekrarlamaz ; yani mum kapandıktan son
Gann Made Easy
Oleg Rodin
4.83 (155)
Gann Made Easy , bay teorisini kullanarak ticaretin en iyi ilkelerine dayanan, profesyonel ve kullanımı kolay bir Forex ticaret sistemidir. WD Gann. Gösterge, Zararı Durdur ve Kâr Al Seviyeleri dahil olmak üzere doğru SATIN AL ve SAT sinyalleri sağlar. PUSH bildirimlerini kullanarak hareket halindeyken bile işlem yapabilirsiniz. LÜTFEN ÜCRETSİZ OLARAK TİCARET İPUÇLARI, BONUSLAR VE GANN MADE EA ASİSTANI ALMAK İÇİN SATIN ALIMDAN SONRA BENİMLE İLETİŞİME GEÇİN! Muhtemelen Gann ticaret yöntemlerini b
M1 Sniper
Oleg Rodin
5 (17)
M1 SNIPER kullanımı kolay bir işlem göstergesi sistemidir. M1 zaman dilimi için tasarlanmış bir ok göstergesidir. Gösterge, M1 zaman diliminde scalping için bağımsız bir sistem olarak kullanılabilir ve mevcut işlem sisteminizin bir parçası olarak kullanılabilir. Bu işlem sistemi özellikle M1'de işlem yapmak için tasarlanmış olsa da, diğer zaman dilimleriyle de kullanılabilir. Başlangıçta bu yöntemi XAUUSD ve BTCUSD ticareti için tasarladım. Ancak bu yöntemi diğer piyasalarda işlem yaparken de ya
RFI levels PRO
Roman Podpora
5 (1)
Önceden gösterge   Piyasa dönüş seviyelerini ve bölgelerini belirler , fiyatın seviyeye geri dönmesini beklemenize ve yeni bir trendin başlangıcında, sonunda değil, işleme girmenize olanak tanır. Gösteriyor   tersine çevirme seviyeleri       Piyasanın yön değişikliğini teyit ettiği ve daha fazla hareket oluşturduğu yer. Bu gösterge yeniden çizim gerektirmeden çalışır, her türlü enstrüman için optimize edilmiştir ve en yüksek potansiyelini bir enstrümanla birlikte kullanıldığında ortaya koyar.
TPSpro RFI Levels
Roman Podpora
4.85 (27)
TALİMATLAR RUS  /  TALİMATLAR   ENG  /  Sürüm MT5 Ana fonksiyonları: Satıcı ve alıcıların aktif bölgelerini görüntüler! Gösterge, satın alma ve satışlar için tüm doğru ilk dürtü seviyelerini/bölgelerini görüntüler. Giriş noktaları arayışının başladığı bu seviyeler/bölgeler etkinleştirildiğinde, seviyeler renk değiştirir ve belirli renklerle doldurulur. Ayrıca, durumun daha sezgisel bir şekilde algılanması için oklar görünür. LOGIC AI - Bir şablonu etkinleştirirken giriş noktalarını aramak için
Volatility Trend System - girişler için sinyaller veren bir ticaret sistemi. Oynaklık sistemi, trend yönünde doğrusal ve noktasal sinyaller ve ayrıca yeniden çizme ve gecikme olmaksızın trendden çıkmak için sinyaller verir. Trend göstergesi, orta vadeli trendin yönünü izler, yönünü ve değişimini gösterir. Sinyal göstergesi volatilitedeki değişikliklere dayalıdır ve piyasa girişlerini gösterir. Gösterge, çeşitli uyarı türleri ile donatılmıştır. Çeşitli alım satım araçlarına ve zaman dilimlerine
First 25 copies at $80, after that price becomes $149 (3 copies left) Gold Signal Pro is a powerful MT4 indicator designed to help traders spot strong price reactions in the market. It focuses on clear wick rejections , showing when price strongly rejects a level and often continues in the same direction. Gold Signal Pro is mainly built for scalping gold (XAUUSD) and works best on lower timeframes like M5 and M15 , where timing matters most. That said, it can also be used on any forex pair, a
PRO Renko Sistemi, RENKO grafikleri ticareti için özel olarak tasarlanmış son derece hassas bir ticaret sistemidir. Bu, çeşitli ticaret araçlarına uygulanabilen evrensel bir sistemdir. Sistemi etkin piyasa sana doğru ters sinyallerine erişim hakkı denilen ses nötralize eder. Göstergenin kullanımı çok kolaydır ve sinyal üretiminden sorumlu tek bir parametreye sahiptir. Aracı, seçtiğiniz herhangi bir ticaret aracına ve renko çubuğunun boyutuna kolayca uyarlayabilirsiniz. Yazılımımla karlı bir
GoldRush Trend Ok Sinyali GoldRush Trend Ok Sinyali göstergesi, XAU/USD'de yüksek hızlı, kısa vadeli scalperlar için özel olarak tasarlanmış hassas, gerçek zamanlı trend analizi sağlar. 1 dakikalık zaman dilimi için özel olarak tasarlanan bu araç, net giriş noktaları için yön okları gösterir ve scalper'ların değişken piyasa koşullarında güvenle hareket etmelerini sağlar. Gösterge, PRIMARY ve SECONDARY uyarı oklarından oluşur. PRIMARY sinyalleri, trend yönündeki değişikliği gösteren Beyaz ve
Scalper Inside PRO
Alexey Minkov
4.74 (69)
An exclusive indicator that utilizes an innovative algorithm to swiftly and accurately determine the market trend. The indicator automatically calculates opening, closing, and profit levels, providing detailed trading statistics. With these features, you can choose the most appropriate trading instrument for the current market conditions. Additionally, you can easily integrate your own arrow indicators into Scalper Inside Pro to quickly evaluate their statistics and profitability. Scalper Inside
Trend indicator AI
Ramil Minniakhmetov
4.7 (79)
Trend Ai göstergesi, trend tanımlamasını işlem yapılabilir giriş noktaları ve geri dönüş uyarılarıyla birleştirerek bir yatırımcının piyasa analizini geliştirecek harika bir araçtır. Bu gösterge, kullanıcıların forex piyasasının karmaşıklıklarında güvenle ve hassasiyetle yol almalarını sağlar. Birincil sinyallerin ötesinde, Trend Ai göstergesi geri çekilmeler veya düzeltmeler sırasında ortaya çıkan ikincil giriş noktalarını belirleyerek, yatırımcıların belirlenen trend içindeki fiyat düzeltmele
Trend Screener
STE S.S.COMPANY
4.79 (95)
Trend Göstergesi, Trend Alım Satım ve Filtreleme için Çığır Açan Benzersiz Çözüm, Tüm Önemli Trend Özellikleriyle Tek Bir Araç İçinde Yerleştirildi! Forex, emtialar, kripto para birimleri, endeksler ve hisse senetleri gibi tüm sembollerde/araçlarda kullanılabilen %100 yeniden boyamayan çoklu zaman çerçevesi ve Çoklu para birimi göstergesidir. SINIRLI SÜRELİ TEKLİF: Destek ve Direnç Tarama Göstergesi sadece 50$ ve ömür boyu mevcuttur. (Orijinal fiyat 250$) (teklif uzatıldı) Trend Screener, grafik
Trend Lines PRO
Roman Podpora
5 (1)
TREND ÇİZGİLERİ PRO     Piyasanın gerçek yön değişimini anlamaya yardımcı olur. Gösterge, gerçek trend dönüşlerini ve büyük oyuncuların piyasaya yeniden girdiği noktaları gösterir. Anlıyorsun     BOS hatları  Daha yüksek zaman dilimlerindeki trend değişiklikleri ve önemli seviyeler, karmaşık ayarlar veya gereksiz gürültü olmadan gösterilir. Sinyaller yeniden çizilmez ve çubuk kapandıktan sonra grafikte kalır. VERSION MT 5     -    RFI LEVELS PRO  göstergesiyle birlikte kullanıldığında maksimum p
System Trend Pro
Aleksandr Makarov
5 (2)
System Trend Pro - This is the best trend trading indicator!!! The indicator no repaint!!!  The indicator has   MTF   mode, which adds confidence to trading on the trend (   no repaint   ). How to trade? Everything is very simple, we wait for the first signal (big arrow), then wait for the second signal (small arrow) and enter the market in the direction of the arrow. (See screens 1 and 2.) Exit on the opposite signal or take 20-30 pips, close half of it, and keep the rest until the opposite
Smc Blast Signal
Mohit Dhariwal
5 (3)
Full Fledged EA and Alert plus for alerts will also be provided in this offer along with the purchase of Indicator. Limited copies only at this price and Ea too. Grab your copy soon Alert plus for indicator with set file is kept in comment section with the image  SMC Blast Signal with FVG, BOS and trend Breakout The SMC Blast Signal is a Precise trading system for Meta Trader 4 that uses Smart Money Concepts (SMC), including Fair Value Gaps (FVG) and Break of Structure (BOS), to identify high-pr
Currency Strength Wizard , başarılı ticaret için size hepsi bir arada çözüm sağlayan çok güçlü bir göstergedir. Gösterge, birden çok zaman dilimindeki tüm para birimlerinin verilerini kullanarak şu veya bu forex çiftinin gücünü hesaplar. Bu veriler, şu veya bu para biriminin gücünü görmek için kullanabileceğiniz, kullanımı kolay para birimi endeksi ve para birimi güç hatları biçiminde temsil edilir. İhtiyacınız olan tek şey, işlem yapmak istediğiniz tabloya göstergeyi eklemektir ve gösterge size
Gold Scalper Super
Aleksandr Makarov
5 (2)
Gold Scalper Super is an easy-to-use trading system. The indicator can be used as a standalone scalping system on the M1 time frame, as well as part of your existing trading system. Bonus: when purchasing an indicator, Trend Arrow Super is provided free of charge, write to us after purchase. The indicator 100% does not repaint!!! If a signal appears, it does not disappear! Unlike indicators with redrawing, which lead to the loss of a deposit, because they can show a signal and then remove it.
Presenting one-of-a-kind Gann Indicator for XAUUSD IQ Gold Gann Levels is a non-repainting, precision tool designed exclusively for XAUUSD/Gold intraday trading. It uses W.D. Gann’s square root method to plot real-time support and resistance levels, helping traders spot high-probability entries with confidence and clarity. William Delbert Gann (W.D. Gann) was an exceptional market analyst whose trading technique was based on a complex blend of mathematics, geometry, astrology, and ancient calcul
Pulse Scalping Line - an indicator for identifying potential pivot points. Based on this indicator, you can build an effective Martingale system. According to our statistics, the indicator gives a maximum of 4 erroneous pivot points in a series. On average, these are 2 pivot points. That is, the indicator shows a reversal, it is erroneous. This means that the second signal of the indicator will be highly accurate. Based on this information, you can build a trading system based on the Martingale
Pip Storm Signal
Camila Bernardez Camero
PIP STORM Sinyali PIP STORM , volatil piyasa koşullarında ultra sık işlem yapılmasını sağlamak üzere tasarlanmış, ok tabanlı gelişmiş bir sistemdir. Ana amacı, geciken veya aşırı kullanılan göstergelere dayanmadan sürekli işlem yapılabilir scalping sinyalleri üretmektir. Tahmin etmez — fiyat geçiş bölgelerine kesin şekilde tepki verir, mikro kırılmaları ve likidite dengesizliklerini gerçek zamanlı, minimalist bir onay motoruyla tespit eder. Güncel Kalın Yeni sürümler ve güncellemelerden habe
Apollo SR Master , Destek/Direnç bölgelerinde alım satımı daha kolay ve güvenilir hale getiren özelliklere sahip bir Destek/Direnç göstergesidir. Gösterge, yerel fiyat zirvelerini ve diplerini tespit ederek Destek/Direnç bölgelerini herhangi bir gecikme olmadan gerçek zamanlı olarak hesaplar. Ardından, yeni oluşan Destek/Direnç bölgesini doğrulamak için, Destek/Direnç bölgesinin dikkate alınabileceğini ve gerçek bir SAT veya AL sinyali olarak kullanılabileceğini gösteren özel bir sinyal gösterir
Bu gösterge paneli, seçilen semboller için mevcut en son harmonik kalıpları gösterir, böylece zamandan tasarruf edersiniz ve daha verimli olursunuz / MT5 sürümü . Ücretsiz Gösterge: Basic Harmonic Pattern Gösterge sütunları Symbol : seçilen semboller görünecektir Trend: yükseliş veya düşüş Pattern : desen türü (gartley, kelebek, yarasa, yengeç, köpekbalığı, cypher veya ABCD) Entry : giriş fiyatı SL: zararı durdur fiyatı TP1: 1. kar alma fiyatı TP2: 2. kar alma fiyatı TP3: 3. kar alma fiyatı
Şu anda %40 İNDİRİMLİ! Herhangi bir Acemi veya Uzman Tüccar için En İyi Çözüm! Bu gösterge paneli yazılımı 28 döviz çifti üzerinde çalışıyor. Ana göstergelerimizden 2'sine (Gelişmiş Para Birimi Gücü 28 ve Gelişmiş Para Birimi Dürtüsü) dayanmaktadır. Tüm Forex piyasasına harika bir genel bakış sağlar. Gelişmiş Para Birimi Gücü değerlerini, para birimi hareket hızını ve tüm (9) zaman dilimlerinde 28 Forex çifti için sinyalleri gösterir. Trendleri ve / veya scalping fırsatlarını belirlemek için
Advanced Arrow
Alfred Kamal
3.9 (39)
This indicator depends on some secrets equations to draw Signals with Stop loss and maximum 4 Take profits. There is a free EA depends on this indicator as a gift when you purchase/rent it. Features Simply it gives you entry point as Ready sign (Buy / Sell) and arrow (Buy / Sell) after candle closed, also SL line and 4 TP lines or less. Once SL-TP lines are shown with the arrow, they remains as they are until signal change. It is historical indicator. No Repaint. user manual for V5 please click
Slayer Scalping
Abdulkarim Karazon
5 (2)
Bu gösterge, iki kar alma seviyesine ve çok sıkı stoploss noktasına odaklanır; tüm amaç, m15 ve daha yüksek zaman dilimlerinde piyasayı skalize etmek; çünkü bu zaman dilimleri spread ve broker komisyonu tarafından çok fazla etkilenmez; gösterge, fiyat ayrışması stratejisine dayalı olarak al/satım sinyalleri verir ve bir yükseliş divergens koşulları tam olarak sağlandığında tp/sl seviyeleriyle bir satın alma oku çizer. Aynı şey satış okları için de geçerli, ok mum kapanışında baskı yapar ve canlı
MetaForecast M4
Vahidreza Heidar Gholami
5 (2)
MetaForecast, fiyat verilerindeki harmonileri kullanarak herhangi bir piyasanın geleceğini tahmin eder ve görselleştirir. Piyasa her zaman tahmin edilemezken, fiyatlarda bir desen varsa, MetaForecast geleceği mümkün olduğunca doğru bir şekilde tahmin edebilir. Benzer ürünlere göre, MetaForecast piyasa eğilimlerini analiz ederek daha kesin sonuçlar üretebilir. Giriş Parametreleri Past size (Geçmiş boyut) MetaForecast'ın gelecekteki tahminler oluşturmak için kullandığı çubuk sayısını belirtir. Mo
ICT, SMC, Akıllı Para Kavramı, Destek ve Direnç, Trend Analizi, Fiyat Hareketi, Piyasa Yapısı, Emir Blokları, Kırıcı Bloklar, Momentum Değişimi, Güçlü Dengesizlik, HH/LL/HL/LH, Adil Değer Boşluğu, FVG, Prim ve İndirim Bölgeleri, Fibonacci Retracement, OTE, Alış Tarafı Likidite, Satış Tarafı Likidite, Likidite Boşlukları, Piyasa Oturumları, NDOG, NWOG, Gümüş Mermi, ict şablonu Finansal piyasada doğru piyasa analizi yatırımcılar için çok önemlidir. Yatırımcıların piyasa trendlerini ve likiditeyi d
Bu indikatörü satın alırsanız, Profesyonel Trade Manager’ımı  + EA   ÜCRETSİZ olarak alacaksınız. Öncelikle, bu Ticaret Sistemi'nin Non-Repainting, Non-Redrawing ve Non-Lagging Göstergesi olduğunu vurgulamak önemlidir, bu da hem manuel hem de robot ticareti için ideal hale getirir. Online kurs, kılavuz ve ön ayarları indir. "Smart Trend Trading System MT5", yeni ve deneyimli tüccarlar için özelleştirilmiş kapsamlı bir ticaret çözümüdür. 10'dan fazla premium göstergeyi birleştiriyor ve 7'den faz
ŞU ANDA %40INDIRIMLI Yeni Başlayanlar veya Uzman Tüccarlar için En İyi Çözüm! Bu Gösterge benzersiz, yüksek kaliteli ve uygun fiyatlı bir ticaret aracıdır çünkü bir dizi tescilli özellik ve yeni bir formül ekledik. Sadece BİR grafik ile 28 Forex çifti için Döviz Gücünü okuyabilirsiniz! Yeni bir trendin veya scalping fırsatının tam tetik noktasını belirleyebildiğiniz için ticaretinizin nasıl gelişeceğini hayal edin? Kullanım kılavuzu: buraya tıklayın Bu ilk olan, orijinal! Değersiz bir özent
Special offer : ALL TOOLS , just $35 each! New tools   will be   $30   for the   first week   or the   first 3 purchases !  Trading Tools Channel on MQL5 : Join my MQL5 channel to update the latest news from me Volumetrik Sipariş Blokları Çoklu Zaman Çerçevesi göstergesi, önemli piyasa katılımcılarının siparişleri biriktirdiği kilit fiyat bölgelerini belirleyerek piyasa davranışına daha derin bir içgörü arayan tüccarlar için tasarlanmış güçlü bir araçtır. Bu bölgeler, Volumetrik Sipariş Bloklar
Yazarın diğer ürünleri
Contact me after payment to send you the user manual PDF file. Monitoring the EA in real time: Signal 1 Full Automated trading robot, for the first time on the market, an Expert Advisor is designed based on divergence. Using divergences is one of the most common and practical trading methods. Because we see a divergence in most places where there is potential for price return. Diagnosis and trading based on them has a higher efficiency than many methods based on static indicators. You can downl
RSI Divergence Full
Mihails Babuskins
4.63 (27)
RSI Divergence Full   +10 other divergence indicators Contact me after payment to send you the User-Manual PDF File. Download the MT5 version here. Also you can download the >>>  Hybrid Trading EA  <<< that is designed and implemented based on RSI Divergence Indicator. RSI is a pretty useful indicator in itself but it's even more effective when you trade divergence patterns with that. Because the divergence signal of the RSI indicator is one of the most powerful signals among the indicators. Di
Contact me after payment to send you the user manual PDF file. Download the MT4 version here. Volume Profile Indicator A functional and useful tool that can improve your trading plan. This indicator calculates volume in price levels(typical volume indicator shows only candle volumes). With the volume of price levels, you can identify important areas that have the potential to reverse. You can also see the volume of support and resistance levels and decide on them. Using volume profiles along
Greedy Red
Mihails Babuskins
4.34 (29)
Contact me after payment to send you the user manual PDF file Real monitoring signals:    Please see links on my profile Greedy Red is an Expert Advisor is designed based on Volume Profile FR . Volume Profile FR  calculates volume in price levels (typical volume indicator shows only candle volumes). With the volume of price levels, you can identify important areas that have the potential to reverse. You can also see the volume of support and resistance levels and decide on them. Greedy Red(GR)’
Contact me after payment to send you the User-Manual PDF File. 5W Pattern  introduction The 5W pattern occurs when the price forms an alternating 5-wave cycle with its volatility. In fact, the 5W  pattern is a price series of alternating HH or LL (higher high or lower low), which is the main characteristic of a trend. The pattern of 5W should have the characteristic of non-overlapping waves, also the points of the pattern are usually formed in Fibonacci levels. The completed pattern of 5W actua
Greedy Golden MT4
Mihails Babuskins
4.8 (5)
Recommended:  it's better to  use in accounts with lower swap or swap-free accounts. SEE AND COMPARE WITH OTHER EA's , Real monitoring signals link on my profile. Contact me after payment to send you the user manual PDF file See the real monitoring signal in my profile. Use only on gold and on the  BUY direction. Trading gold is attractive to many traders due to the high volatility and depth of the market. Should we invest in gold or just scalp it? Answering this question is a big challenge for
MACD Divergence Full
Mihails Babuskins
5 (2)
Contact me after payment to send you the User-Manual PDF File. Divergence detection indicator with a special algorithm. Using divergences is very common in trading strategies. But finding opportunities for trading with the eyes is very difficult and sometimes we lose those opportunities. The indicator finds all the regular and hidden divergences. (RD & HD) It uses an advanced method to specify divergence. This indicator is very functional and can greatly improve the outcome of your trading. Thi
Calculator of Lot Size
Mihails Babuskins
4.52 (23)
Calculation of Lot Size for many traders is a big challenge. A case that is very important in money management. What many traders ignore. Choosing an appropriate Lot Size in trades can improve results and it will ultimately lead to success. This indicator calculates the authorized Lot Size for your trades. The indicator uses the following values to get the appropriate Lot Size for positioning: The distance of Stop Loss. The Pip Value. The amount of Risk Allowed For Each Trade. The amoun
FREE
Contact me after payment to send you the User-Manual PDF File. Triangle Pattern Sometimes the price cannot make higher highs or lower lows and it moves in a converging price range and waves are shorter than before until the movement creates a geometric shape of a symmetrical triangle, which indicates It is maybe the end of the trend. The triangle pattern is a well-known in forex and the trading plan and strategy of many traders is based on it. The Triangle Pattern Scanner Indicator It is usu
Currency Strength Gauge incicator The currency strength gauge is an indicator to measure of the strength or weakness of currencies in the Forex market. Comparing the strength of currencies in a graphic representation will lead to a good overview of the market and its future trends. You will see in a graphic chart both the strength of the currencies and their correlation, and this will help you in your decisions to get better trades.   -To easy detection of over Overbought and Oversold points,
Contact me after payment to send you the user manual PDF file. Download the MT4 version here. Unlocking Trading Insights Dive into the heart of market dynamics with Advance Divergence Scanner designed for traders seeking a competitive edge. The Divergence Indicator is your key to identifying crucial divergences across various charts, empowering you to make informed decisions in the dynamic world of financial markets. The Divergence A Divergence signals a potential reversal point because directi
Contact me after payment to send you the User-Manual PDF File. Harmonic Trading The secret is the Fibonacci. It has been proven in the markets that price always reacts to Fibonacci levels. Fibonacci levels are one of the most important indicators of price changes. Sometimes the sequence of reactions to these levels in the chart make geometric shapes, which are called harmonic patterns. The price creates harmonic patterns with its fluctuation and reaction to Fibonacci levels. Harmonic patterns c
See my other products here. One Click Order This product helps you to send your order as quickly and easily as possible. Send your order as fast as possible: Just set your position parameter values(Price, TP, SL, Ex Date) with just a few simple mouse drags. On the other hand, the calculation of the losses and profits value before ordering is always a big challenge for traders; This expert is very useful in taking a position and calculating the amount of the stop loss/the take profit(in the curr
FREE
Candle Time indicator
Mihails Babuskins
5 (2)
Sometimes a trader needs to know when a candle will close and a new one appears to make the right decisions, this indicator calculates and displays the remaining of current candle time . It is simple to use, just drag it on the chart. Please use and express your opinion, expressing your opinions will promote the products. To see other free products, please  visit  my page.  
FREE
Contact me after payment to send you the user manual PDF file. Introduction The moving average indicator is the most well-known and one of the most popular indicators among traders. It is very simple to work with, but a basic question has always become a big challenge among traders: What is the most optimal setting of the moving average for each chart-time frame? The answer to this question is very difficult, you have to try different settings of the moving average indicator for different chart
Contact me after payment to send you the User-Manual PDF File. How To Test You can test the indicator by free version, to get the free version please contact me   (  the free version scans charts in W1 and MN1 time-frames )  it's free. 123 Pattern Breakout Trend is your friend, trade along the trend, but how do we identify trends? Sometimes the simplest methods have the best results. Pattern 123 is based on the breakout important price levels, when the price is trying to break the previous h
MACD Signals Dashboard
Mihails Babuskins
4 (4)
Download directly the indicator file here. (if you can't open on MT4) MACD Indicator is one of the most popular momentum indicators among users. Searching and detecting MACD signals by the eye may not be easy. Scan Full Charts Dashboard Indicator with simple user interface and search customization panel saves time and scans all charts for MACD signals search and notifies the user with high accuracy. After finding the signal, the user was aware of the result by alerts and notifications. This ind
FREE
RSI Signals Scanner
Mihails Babuskins
4.75 (4)
RSI Signal Scanner The primary trend of the stock or asset is an important tool in making sure the indicator's readings are properly understood. For example, some of the technical analysts, have promoted the idea that an oversold reading on the RSI in an uptrend is likely much higher than 30%, and an overbought reading on the RSI during a downtrend is much lower than the 70% level. This indicator notifies you of RSI important levels breakouts (30% and 70%) by searching among the symbols and chec
FREE
This utility manage your position risk by trailing stop with "Parabolic SAR" indicator value. Indicator Parameters SAR step(Parabolic SAR step value) SAR maximum(Parabolic SAR maximum value) Timeframes(Choose timeframes). Stop Place(put SL in current(open) candle or last close candle). Is the spread considered?(Set SL with considering to Spread or not, the choice is with you). Working with this utility is very simple, Just drag it onto the chart. There is no problem with multi-part trades. It is
FREE
Ichimoku Signal Scanner
Mihails Babuskins
4 (1)
Ichimoku Signals Dashboard To test the indicator please download demo version  here. Find Ichimoku signals as easy as you can. Ichimoku is one of the most powerful trends recognition indicators. And it has valid signals for the trades. This indicator scans several symbols and time-frames by the Ichimoku to find all the signals that you want and show in a dashboard. It's easy to use, just drag it onto the chart. It's better to add  Ichimoku indicator  to chart before adding this indicator. Ichimo
Waves Follower
Mihails Babuskins
Contact me after payment to send you the User-Manual PDF File. This indicator gives a signal when the probability of starting a trend is high. To calculate entry points, it uses a combination of some indicators like "Moving Average", "ADX", RSI with support and resistance points. This indicator is a trend follower and it doesn't determine that TP because it is not necessary, it uses the stop-loss trailing system (Of course, the indicator determines the SL, but you have to move it yourself becau
Quasimodo Pattern QM MT4
Mihails Babuskins
4.18 (33)
Contact me after payment to send you the User-Manual PDF File. ADVANCE PRICE ACTION TRADING CONCEPT. To test the indicator, you can download the demo version on my product list. it’s free (only shows patterns that have occurred in the past of the market). Quasimodo is  a reversal trading pattern  that appears at the end of an uptrend. As a price formation, the Quasimodo pattern is depicted by three peaks and two valleys, where: First, the middle peak is the highest, while the outside two peaks
Contact me after payment  to send you the  User-Manual PDF  File. Volume Profile Indicator A functional and useful tool that can improve your trading plan. This indicator calculates volume in price levels(typical volume indicator shows only candle volumes). With the volume of price levels, you can identify important areas that have the potential to reverse. You can also see the volume of support and resistance levels and decide on them. Using volume profiles along with   Price Action   and  
Contact me after payment to send you the User-Manual PDF File. Double Top/Bottom Pattern Double top and bottom patterns are chart patterns that occur when the underlying investment moves in a similar pattern to the letter "W" (double bottom) or "M" (double top). Double top and bottom analysis are used in technical analysis to explain movements in a security or other investment, and can be used as part of a trading strategy to exploit recurring patterns. Searching for this pattern among the cha
Contact me after payment to send you the user manual PDF file. Introduction Introducing the Wolfe Pattern Indicator, a powerful tool designed to help traders identify and capitalize on the elusive Wolfe Pattern in financial markets. This innovative indicator uses advanced algorithms to scan for the Wolfe Pattern in all symbols and time frames, providing traders with a unique edge in the market. How to trade with the Wolfe Pattern The Wolf Pattern is a rare and lucrative trading opportunity that
Filtrele:
Ahmed Alhasnawi
181
Ahmed Alhasnawi 2024.02.20 11:27 
 

I bought the indicator more than a year ago and I did not benefit from it even a single trade... The signals are late, the seller is uncooperative, I do not recommend buying it

Tuanyer De Los Santos
1478
Tuanyer De Los Santos 2023.05.18 17:08 
 

The Scanner is very good and fast. I tested and Im using other tecnical indicator and analisys as a second confirmation and is realy good. I like beacuse i can see all timeframe as per selection. Now , I bougth 123 patter scanner, wait for my comment, but for sure will be good. Your are doing a great job and put all easy for the traders.

Marcel Mihalik
378
Marcel Mihalik 2022.12.28 21:10 
 

Kullanıcı incelemeye herhangi bir yorum bırakmadı

Mihails Babuskins
78197
Geliştiriciden yanıt Mihails Babuskins 2022.12.28 22:29
Hi Marcel,
I'm developing the new version which will be available for a week(or two).
In the new version, all features will be upgraded.
NITINAN SHOTNITICHAIYASAN
99
NITINAN SHOTNITICHAIYASAN 2022.12.13 16:44 
 

It's the best Harmonic Pattern, it's an accurate reversal point, thank you.

Mihails Babuskins
78197
Geliştiriciden yanıt Mihails Babuskins 2022.12.13 17:50
Thank you. 🌺🙏☘️
lauro1956
5742
lauro1956 2022.10.07 08:26 
 

Good indicator, it fulfills its function and does not load the system. Good price too.

Mihails Babuskins
78197
Geliştiriciden yanıt Mihails Babuskins 2022.10.07 12:36
Thank you. 🌺🙏☘️
E8035vba
74
E8035vba 2022.09.24 17:03 
 

I bought The harmonic Scanner worth the price, is so powerful for beginners and even the advanced trader, once the pattern is detected the is no repainting and no lagging, I managed to build the small account to 100 dollars with less effort, much appreciated Mihails Babuskins

Mihails Babuskins
78197
Geliştiriciden yanıt Mihails Babuskins 2022.10.05 22:09
Thank you.
İncelemeye yanıt