Fibo Candle Previous
- インディケータ
- バージョン: 4.0
- アップデート済み: 14 10月 2025
- アクティベーション: 10

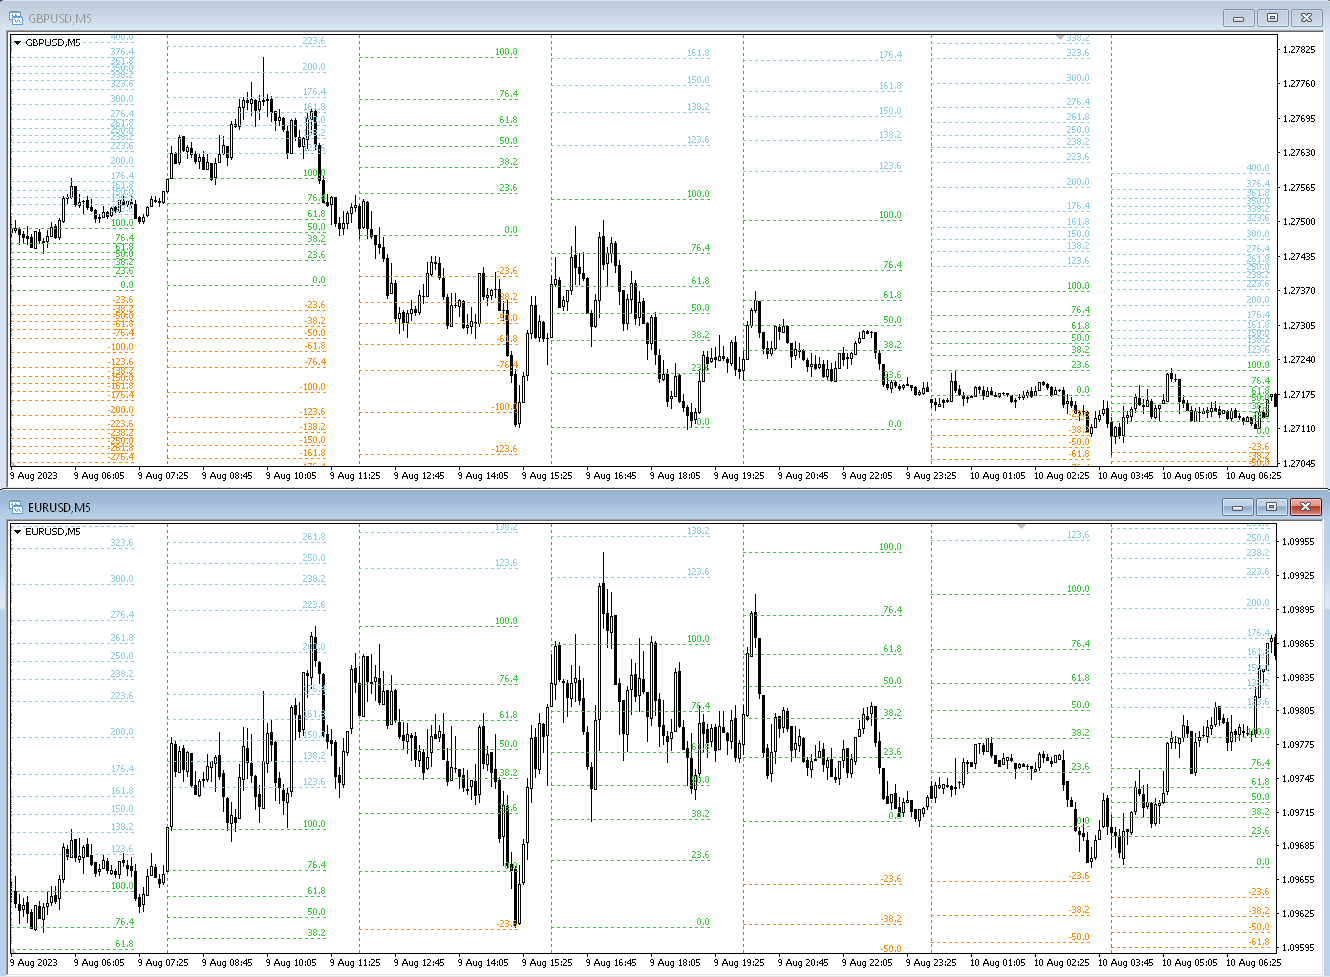
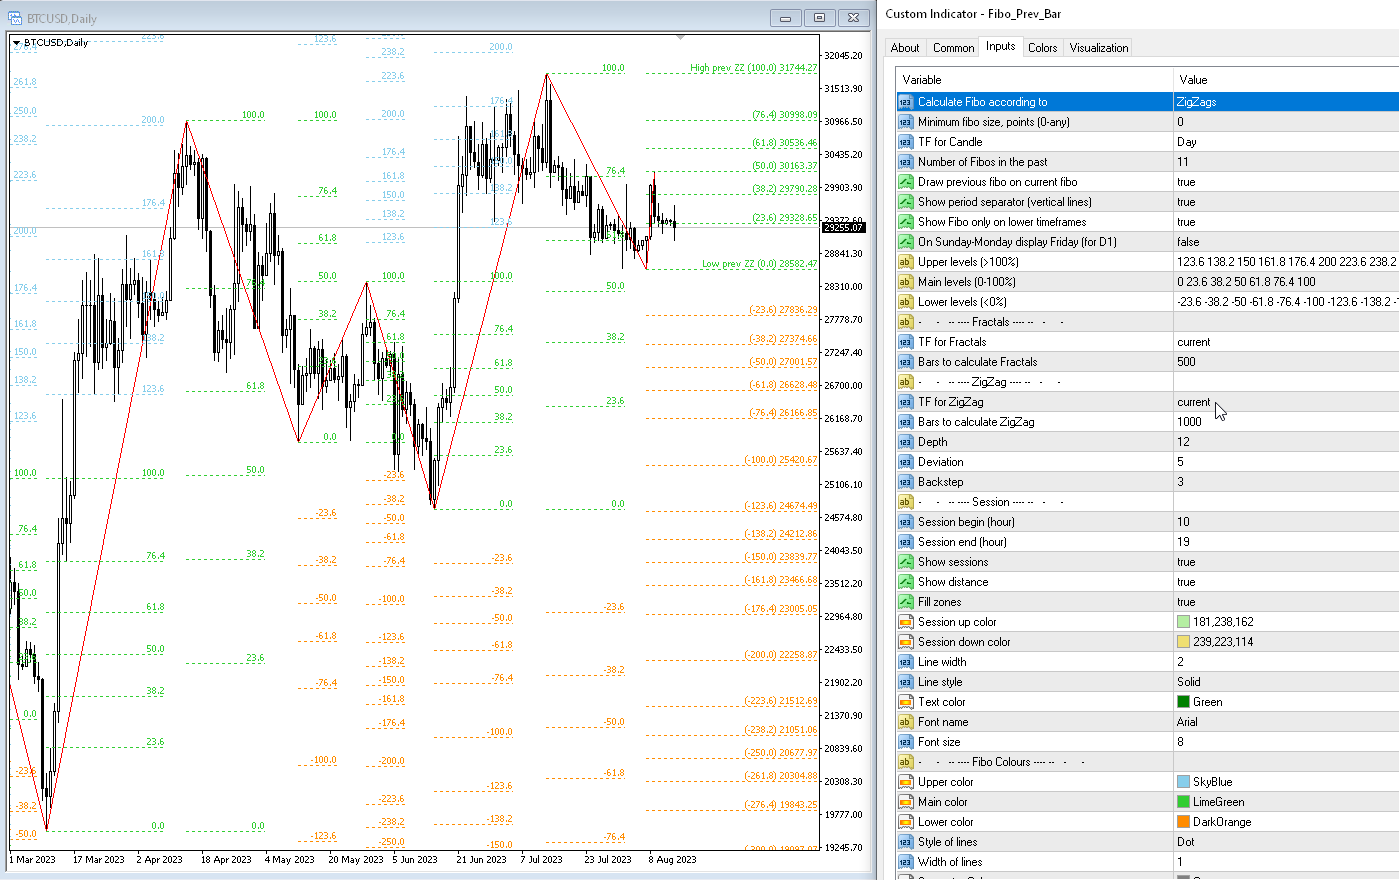
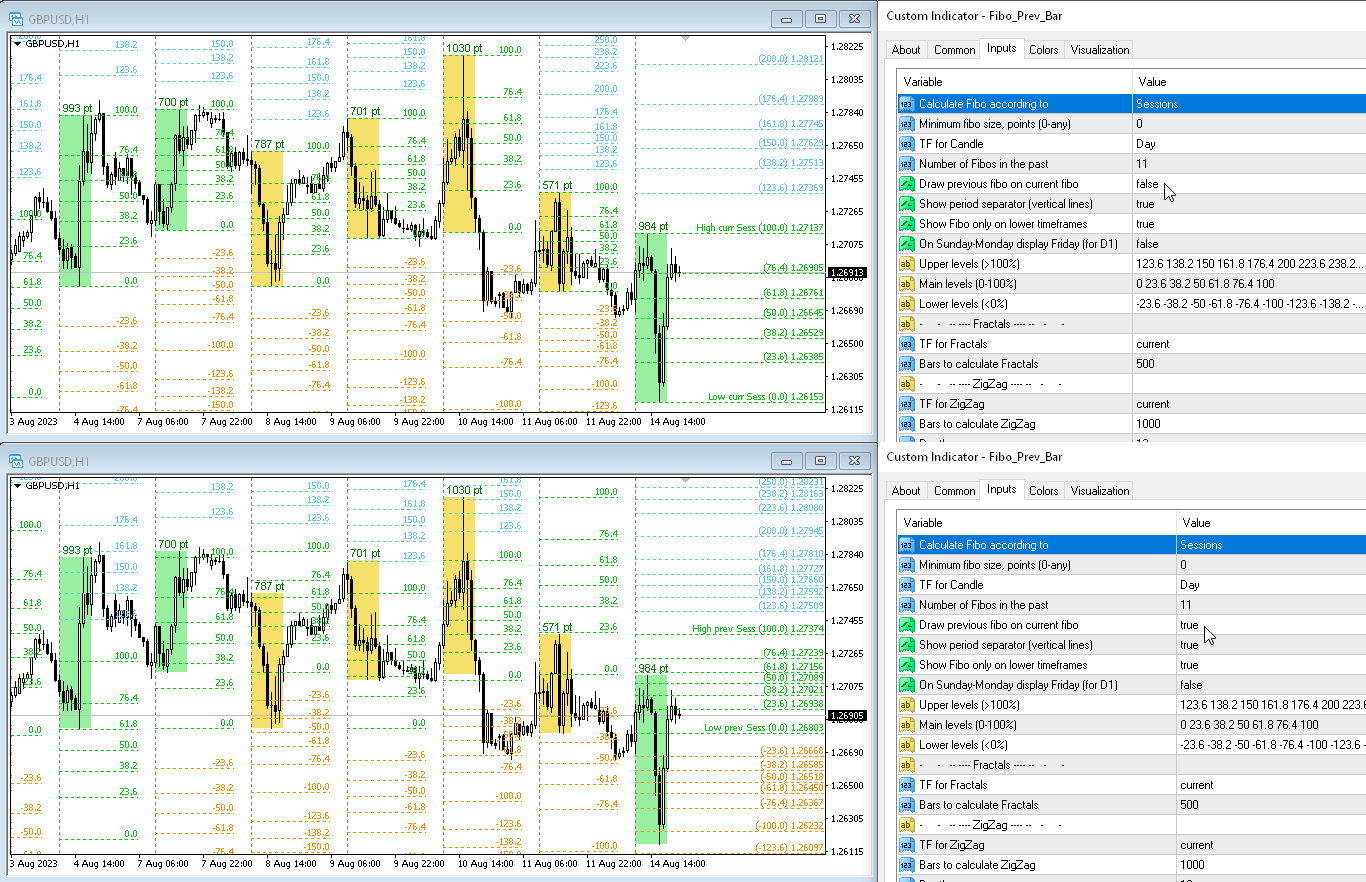
このインジケーターは、ジグザグインジケーター、取引セッション、フラクタル、またはローソク足(非標準の時間枠:年、6 か月、4 か月、3 か月、2 か月を含む)に基づいてフィボナッチ レベルを自動的に描画します(自動フィボ リトレースメント)。 フィボナッチ計算には、より高い時間枠を選択できます。
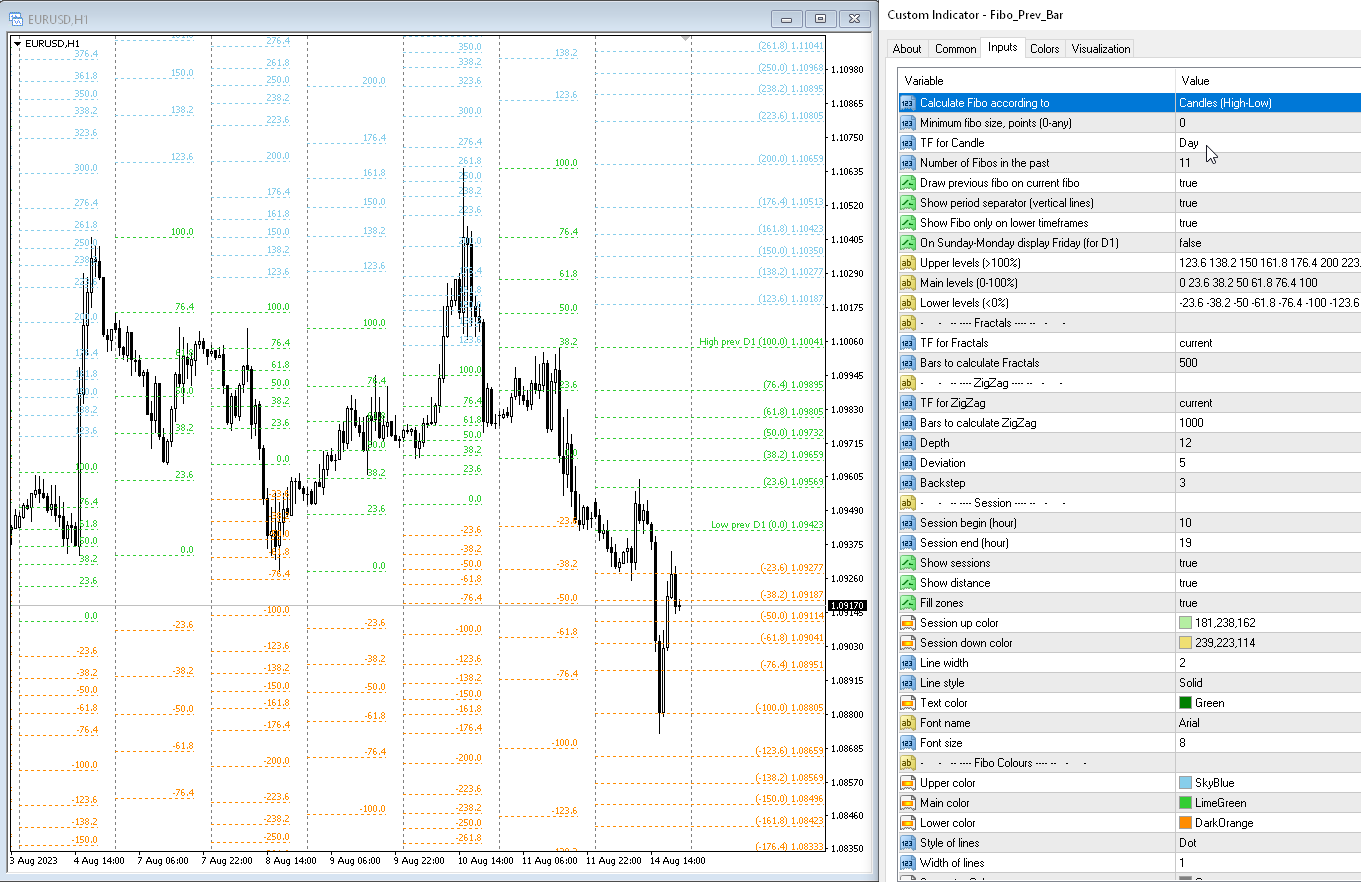
現在のバーが閉じるたびにレベルが再描画されます。 指定したレベルを超えたときにアラートを有効にすることができます。
履歴のレベルを分析することもできます。 これを行うには、「過去の Fibo レベルの数」パラメーターで Fibo レベルの数を指定する必要があります
パラメーター
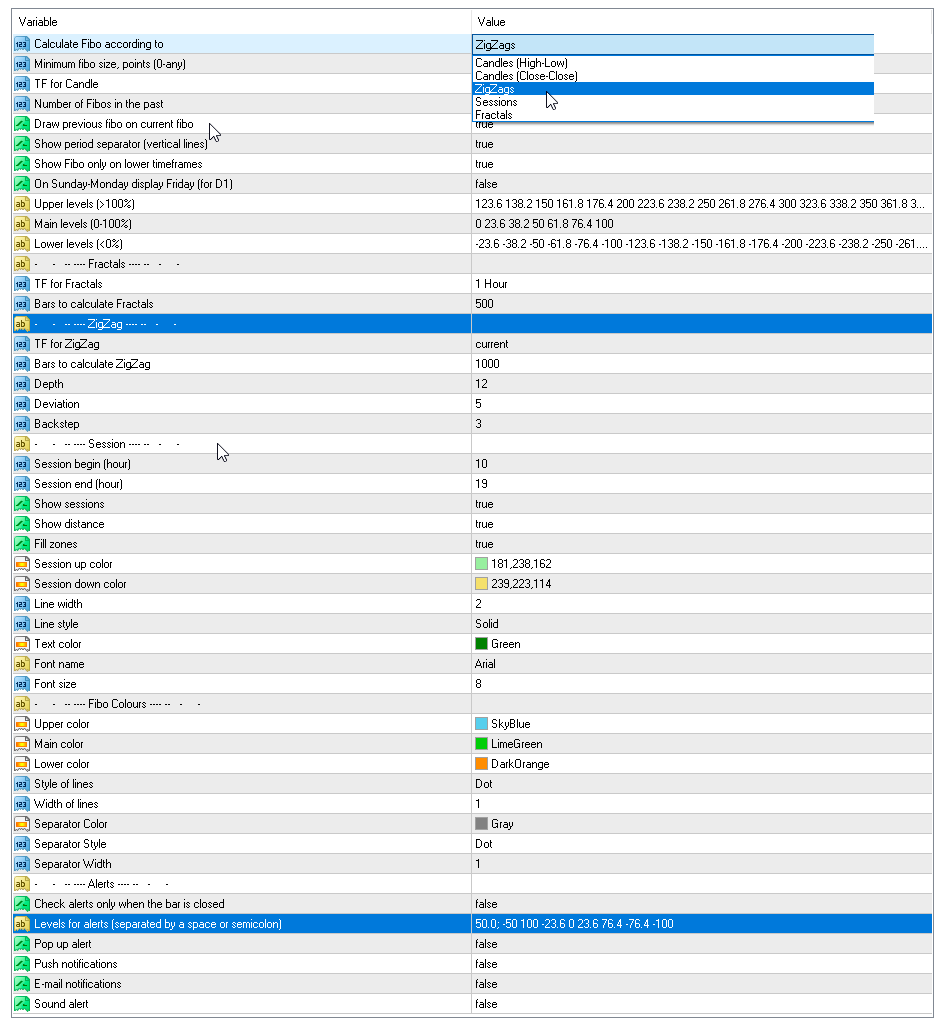
Calculate Fibo according to — フィボナッチ計算モード:
- Candles (High-Low) — 高値-安値に基づいてフィボナッチを構築します。
- Candles (Close-Close) — 終値-終値に基づいてフィボナッチを構築します。
- ZigZags — ZigZag ポイントによって Fibo を構築します。
- Sessions — 取引セッションごとに Fibo を構築します。
- Fractals — フラクタル ポイントによって Fibo を構築します。
Minimum fibo size, points (0-any) — ポイント単位の最小 Fibo サイズ。 Fibo がこのサイズより小さい場合、無視されます。
TF for Candle — フィボナッチレベルを構築するためのローソク足の時間枠。
Number of Fibo in the past — 履歴内にプロットする Fibo レベルの数。
Upper levels (>100%) — 上位レベル。値は 100 より大きい必要があります (スペースまたはセミコロンで区切られます)。
Main levels (0-100%) — 中間レベル。値は 0 ~ 100 である必要があります (スペースまたはセミコロンで区切られます)。
Lower levels (<0%) — 下位レベル、値は 100 未満である必要があります (スペースまたはセミコロンで区切られます)。
Draw previous fibo on current fibo — 現在の Fibo の代わりに以前の Fibo を描画します。 このパラメータを無効にすると、フィボは計算されたレベルで描画されます。
On Sunday-Monday display Friday (for D1) — 土曜日から日曜日に相場がある場合は、金曜日のフィボを描画します。 期間 D1 のみ。
Show period separator (vertical lines) — ピリオド区切り文字を表示します。 チャート上に垂直線として表示されます。
Show Fibo only on lower timeframes — より短い期間でのみ Fibo を描画します。
Upper color — 上の線の色。
Main color — 中央の線の色。
Lower color — 下の線の色。
Style of lines — 線のスタイル。
Width of lines — 線の幅。
Min pause between signals (sec) — アラート間の一時停止を秒単位で行います。
Levels for alerts (separated by a space or semicolon) — アラートのレベル (スペースまたはセミコロンで区切られます)。
Alerts — ポップアップアラートを有効にします。
Push notification — プッシュ通知を有効にします。
Send e-mail — 電子メールを送信します。

A comprehensive indicator for those who use Fibonacci in intraday trading. It notifies you about the previous day while simultaneously providing real-time retracements for the current session with absolute accuracy. A talented programmer and highly cooperative. Congratulations!!!