Engulfing Candlestick Pattern Detector for MT4

The Bullish and Bearish Engulfing Pattern Screener for MetaTrader 4 is a powerful tool designed for traders looking to identify key reversal patterns in the financial markets. This indicator scans price charts for bullish and bearish engulfing patterns, which signal potential trend reversals.

Key Features:

  • Real-time Scanning: Continuously analyzes price data to provide instant alerts when engulfing patterns are detected.
  • Customizable Settings: Allows users to adjust parameters to fit their trading style and preferences, including timeframes and pattern confirmation criteria.
  • User-friendly Interface: Easy to install and navigate, making it accessible for both novice and experienced traders.
  • Alerts and Notifications: Provides visual and audio alerts, ensuring traders never miss a potential trading opportunity.

With the Bullish and Bearish Engulfing Pattern Screener, traders can enhance their technical analysis and improve their decision-making process, ultimately increasing their chances of success in the market.

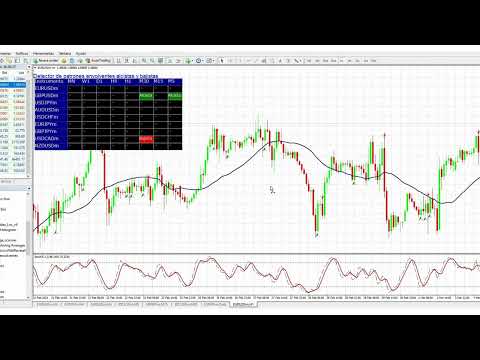
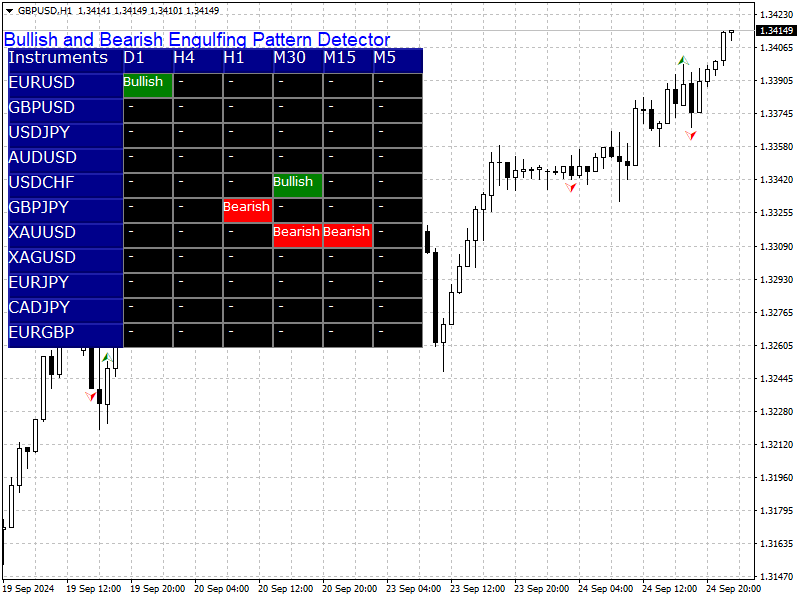
This indicator displays engulfing patterns on the current chart as well as on multiple assets and time frames selected by the trader (from M1 to MN1). Its main features are:

- A screener that displays recently formed engulfing patterns on any asset (offered by the broker) and active time frame.

- An alert window that indicates on which asset and time frame an engulfing pattern is forming.

- Email alerts, push notifications and sound alerts.


The indicator also allows filtering engulfing pattern signals using indicators such as RSI, Stochastic or Moving Averages.


Do you want to develop your own indicator or EA but don't have the time or knowledge to do it yourself? We can do it for you. Contact us via: 

Raul Canessa Castameda - rcanessa - Trader's profile - MQL5 Algo Trading community


Önerilen ürünler
Power Renko is an indicator which plots Renko bricks underneath the chart using a histogram. You can select the brick size and the timeframe of the Renko bricks as well as whether or not to use the close price or the high/low price of the candles. Renko bricks are based on price alone, not time, therefor the Renko bricks will not be aligned with the chart's time. They are extremely useful for trend trading and many different strategies can be formed from them. Buffers are provided allowing you t
Holy Renko PRO
Bianca Seara
3.5 (2)
About  Holy Renko is a trend identifier capable of identify small and long market movements. This indicator should be use in Renko Charts. VIDEO (information and tips) [HERE] How to install Renko Charts [HERE] Features Developed for Renko Charts Easy to analyze Fast signals Not repaint (when candle close)  Statistics panel Filters false signals Alerts, emails and push notifications  Advantages of Renko Chart Easy to install Easy to analyze Filter out the noise of wicks  Easy identification
MultiFiboDynamicMT4 is a powerful, professional indicator for estimating the most important support and resistance levels. The main advantage is that it plots the Fibonacci levels at all timeframes simultaneously, which allows the trader to see the full picture of the possible price movement of the trading instrument! Advantages of the indicator The indicator is perfect for scalping and trading binary options. Suitable for beginners and experienced traders. Works on all timeframes. Works on any
FREE
Rira Renko
Vitor Palmeira Abbehusen
RENKO on Time Chart This indicator is an enhanced Renko, so you can watch the Renko bricks on the chart to understand price movement more clearly the other improvement is automated box size according to ATR (Average True Range) period you can set the ATR number as you want and the box size of Renko changes automatically based on price movement Inputs Mode: Box size is the input to specify the size of the Renko box you want to print on the chart. This input lets you choose the fixed box siz
Candle GAP
Thushara Dissanayake
3 (1)
Mum GAP   göstergesi, haftanın her günü için mum boşluklarını otomatik olarak belirlediğinden,   Boşluk Ticareti Stratejilerini   kullanan tacirler için önemli bir araçtır. Boşluk, art arda iki günün kapanış ve açılış arasındaki fiyat seviyesi farkını ifade eder. Bu gösterge dört tür boşluk modelini tanır: Ortak, Koparma, Devam ve Tükenme. Tüccarlar, bu göstergeyi herhangi bir tabloya dahil ederek sinyallerini doğrulayabilir ve alım satım kararlarını geliştirebilir. Mum GAP göstergesinin temel ö
FREE
Short Description: Prop Firm Protector EZ MT4 is an EA designed to protect your funded account by managing risk and ensuring compliance with the Prop Firm's trading rules. This EA automatically monitors equity levels, closes trades when profit targets or drawdown limits are reached, and provides a visual display of key account metrics. The EA features a Super Easy setup, is simple to use, and works with all different Prop Firm service providers. Overview: Prop Firm Protector EZ MT4 is an Draw
Bigger chart labels would allow the user to be entirely aware of which chart he/she is on. Each chart window is unique, containing different patterns and economic motives so acknowledging the chart window would be absolutely essential! There are well known Economic Time Zones included in clear view, by choice!    Simple does it! Use your computing mouse scroller, clicking with the right finger on the label, in order to customize the label properties. From there, choose your preferred color, f
FREE
Binary Options Assistant (BOA) ICE Signals Indicator provides signals based on gkNextLevel Binary Options Strategy.  Indicators: 2 Bollinger Bands & Stochastic Stop missing trades, stop jumping from chart to chart looking for trade set-ups and get all the signals on 1 chart! U se any of the BOA Signals Indicator with the  Binary Options Assistant (BOA) Multi Currency Dashboard .   All BOA Signal Indicator settings are adjustable to give you more strategy combinations. The signals can be seen
FREE
Fx BFP Pivot Points
Maged Ait Abbi
5 (6)
A forex   pivot point   strategy could very well be a trader’s best friend as far as identifying levels to develop a bias, place stops and identify potential profit targets for a trade. Pivot points have been a go-to for traders for decades. The basis of pivot points is such that price will often move relative to a previous limit, and unless an outside force causes the price to do so, price should stop near a prior extreme. Pivot point trading strategies vary which makes it a versatile tool for
FREE
Fibonacci SR Indicator This indicator creates support and resistance lines. This indicator is based on Fibonacci Retracement and Extension levels. It will consider many combinations of the Fibonacci levels and draw support/resistance lines based on these. This indicator uses tops and bottoms drawn by the ZigZag indicator in its calculations. The ZigZag can also be drawn on the chart, if necessary. The indicator considers many combinations of past reversal points and Fibonacci ratio levels, and w
FREE
Chaser
Thebo Junior Mahlangu
Introduction  This Indicator Is Based On Average Price/Maximum Price Moves, And Using Moving Bollinger Bands And Moving Averages. The Advantage Of Using It With YOUR own Analysis Will Confirm Potential Supports And Resistances While it Compliments With Your Analysis  The Indicator Is Non-Repainting AND Along With Our Special Trend METRE that Changes With The Conditions OF A Bullish Or Bearish Trend....  Recommend Time-Frames: H1  H4 M15 Usage: The Indicator Is Very Profitable If Use
FREE
The BLACK ZONE PREMIUM INDICATOR is a powerful all-in-one trading assistant built to bring clarity, precision, and consistency to forex trading. It combines multi-timeframe market structure, trade forecasting, risk management, and live monitoring into one professional-grade tool. From planning trades to managing them with discipline, this indicator equips traders with everything they need to make informed and confident decisions. If you’ve been looking for a professional solution that simplifies
交易是需要一个核心维度的,交易信号标准化机制,需求每一笔交易的开仓信号都是需要有依有据。比如我们这个单PINBAR交易策略。红色星星代表空头信号,蓝色星星代表多头信号。交易信号有实时提醒呈现,可以结合ZZ锯齿指标搭配的一起用希望我的这个指标帮你越早建立一个完善的交易信号指标---------------------------------------------------------------------------------------------------------------------------------------------------------------------------------------------------------------------------------------------------
Hikkake Japon Şamdan Deseni, grafikte oluşan Hikkake Fiyat Hareket Desenlerini belirlemek ve tespit etmek üzere tasarlanmış özel bir göstergedir. Bu desenler, genellikle potansiyel ticaret fırsatlarına yol açan bir iç çubukta sahte bir dışarı çıkma kavramına dayanır. Göstergenin temel işlevi, grafiğin son beş şamdanını analiz etmek ve bu şamdanların Hikkake deseninin özelliklerini sergileyip sergilemediğini belirlemektir. Bu desen onaylandığında, gösterge deseni oluşturan şamdanların etrafına bi
Chaos Trader Lite
John Davis
1 (1)
Chaos Trader Lite attempts to use aspects of chaos theory to place trades in the marketplace. This Expert Advisor, in particular, draws upon theories made by Bill Williams. Every version of MetaTrader contains the Bill Williams indicators. I wondered why was he deemed so important as to have his own set of indicators added to MetaTrader with name attribution. Conducting research I found that Bill Williams wrote a book using chaos theory to trade the markets. The Bill Williams indicators are usef
FREE
Bu gösterge, manuel ve otomatik yöntemlerle çizilen harmonik desenleri tespit edecektir. Lütfen görüşlerinizi ekleyin. Notlar: Bu gösterge bir kontrol paneline sahiptir ve her (grafik ve zaman dilimi) ayarını kaydedecektir. Daha fazla grafik alanı için onu küçültebilir ve diğer analiz araçlarıyla çalışmayı tercih ederseniz tüm gösterge verilerini gizlemek için kapatma düğmesini kullanabilirsiniz. Bu göstergenin ayarlarını değiştirirken Hareketli Ortalama veya Bollinger Bantları gibi göstergeler
MASi Three Screens
Aleksey Terentev
5 (2)
MASi Three Screens is based on the trading strategy by Dr. Alexander Elder. This indicator is a collection of algorithms. Algorithms are based on the analysis of charts of several timeframes. You can apply any of the provided algorithms. List of versions of algorithms:     ThreeScreens v1.0 - A simple implementation, with analysis of the MACD line;     ThreeScreens v1.1 - A simple implementation, with analysis of the MACD histogram;     ThreeScreens v1.2 - Combines the first two algorithms in
FREE
This is a Sharkfin Arrows Indicator. Detailed explanation and TDI extras: https://www.mql5.com/en/blogs/post/759138 This indicator will show only Arrows. It does not have TDI symbols on chart. Please get the extras from links above for TDI indicators. Sharkfin Scanner (paid): https://www.mql5.com/en/market/product/123566 TDI Scanner Dash (paid): https://www.mql5.com/en/market/product/41826 About: This Indicator finds the Shark Fin Pattern. It will show an arrow in the current bar if RSI sha
FREE
YOU CAN NOW DOWNLOAD FREE VERSIONS OF OUR PAID INDICATORS . IT'S OUR WAY OF GIVING BACK TO THE COMMUNITY ! >>>    GO HERE TO DOWNLOAD Camarilla Pivots Historical plots the historical data of the camarilla pivot point levels on the chart. The Camarilla Pivot levels was originated in 1989 by Nick Scott. The levels are used as primary support and resistance levels by Intraday traders. The levels are calculated with the following formula: R4 = C + RANGE * 1.1/2 R3 = C + RANGE * 1.1/4 R2 = C + RANG
FREE
This indicator is a great utilities tools for Fibonacci Trader that draw their chart manually. This indicator do not draw any Fibonacci Retracement or Fibonacci Expansion. It is a utilities tool for modifying the Fibonacci level for Fibonacci object manually drawn on the chart. Just draw using the Fibonacci Retracement or other Fibonacci tool in MT4 as per normal. The select the Fibonacci you have just drawn. Make sure you have only 1 object selected. Then open up this Fibonacci Level Management
This indicator Pluuto Alert Plus indicator.Indicator displays trend movement. Indicator calculates automatically line.Alert = FiltPer.When the alert is up the next alert is down,when the alert is down the next alert is up (new bar). Features FiltPer - displays indicator period.Line1. FiltPer2 - displays indicator period.Line2. Multiplier - displays indicator multiplier.(FlitPer,Line1;step) Deviation1 - displays indicator deviation.(Line2) Deviation2 - displays indicator deviation.(Line2) Deviati
Sorsawo Magic Signal Pro is an advanced technical analysis tool designed to identify high-probability entry points by combining adaptive momentum logic with smart volatility filtering. Core Features Adaptive WPR Logic : Unlike standard oscillators, Sorsawo Magic uses a dynamic calculation period that automatically adjusts based on market volatility. Volatility-Filtered Signals : The indicator analyzes price gaps and momentum surges to ensure signals are only generated when there is sufficient ma
FREE
Quantum Falcon Signal Free is a smart visual trading indicator for MetaTrader 4 designed for Forex and Gold traders. The indicator combines: • Trend analysis • RSI momentum confirmation • MACD momentum filtering • ATR volatility filtering • Higher timeframe confirmation • Smart exit signal detection Main Features: • Smart Buy and Sell signals • Exit Buy / Exit Sell alerts • Real-time dashboard on chart • Professional candle arrows • Multi-timeframe trend confirmation • ATR market volatility filt
FREE
极大的提升了交易感官,一目了然的走势展示,简洁高效。 极大的突出展示了行情的趋势脉络,跟随时间周期适应变化,替用户交易者研判了行情走势,简洁高效 同时我们还提供了主窗口和副窗口的展现,有需要可以联系我作者本人,感谢支持。 像传统的renko,又不是传统的renko,技术在发展,同样的砖图可以有不一样的绘制和计算展现。 希望可以帮到大家的交易,再次感谢。 极大的提升了交易感官,一目了然的走势展示,简洁高效。 极大的突出展示了行情的趋势脉络,跟随时间周期适应变化,替用户交易者研判了行情走势,简洁高效 同时我们还提供了主窗口和副窗口的展现,有需要可以联系我作者本人,感谢支持。 像传统的renko,又不是传统的renko,技术在发展,同样的砖图可以有不一样的绘制和计算展现。 希望可以帮到大家的交易,再次感谢。
Advanced CRT Indicator MT4 — Candle Range Theory Tool Advanced CRT Indicator MT4 is a professional analysis tool that automates Candle Range Theory. It identifies consolidation ranges, breakout levels, Fair Value Gaps (FVG), and profit targets, with a real-time dashboard and alerts. Overview - Multi-timeframe candle range detection   - Automatic breakout levels with buffer settings   - Fair Value Gap identification and tracking   - Up to three customizable target levels (Risk:Reward ratios)  
AutoTargets
Nor El Isslem Rettab
The AutoTarget Indicator For MT4 is an indicator that is built for the traders that work with the Meta Trader 4 charting platform during their trading day and it is built for a singular reason which is to help the Trader using it to predict the next price target on the current timeframe or currency pair that the trader attaches it to. It works across all currency pairs and trading platforms and can help a seasoned trader by reducing the amount of technical analysis he or she has to do every day
MetaWaves
Stanislav Korotky
This indicator was inspired by М & W Wave Patterns by A. Merrill. 5 extremums or 4 edges of ZigZag are enough to build M or W pattern at arbitrary offset in the history. The classical approach includes a table of predefined figures of ZigZag waves, which can transform into each other under special rules—so that next edge can be forecasted based on these rules. Unlike to this approach, the indicator analyses available history and builds statistics for all M and W patterns, which differ in their c
LordAutoFibonnaci
Igor Pereira Calil
5 (2)
Lord Auto Fibonnaci is a free indicator for Meta Trader, in order to show the most famous chart in the financial market known as "Fibonnaci". As we can see in the images below, the fibonnaci table will automatically analyze the graph for you, with trend factors through percentage, almost infallible use, you can always work when the percentage is low or high, start shopping and sales on time, great for analyzing entries! In the images below we can see an example in gold in H4, where we are at
FREE
KT Pin Bar
KEENBASE SOFTWARE SOLUTIONS
KT Pin Bar identifies the pin bar formation which is a type of price action pattern which depicts a sign of reversal or rejection of the trend. When combined with support and resistance, BRN and other significant levels, Pin Bar pattern proved to be a very strong sign of reversal. Basically, a pin bar is characterized by a small body relative to the bar length which is closed either in upper or lower 50% part of its length. They have very large wicks and small candle body. A pin bar candlestic
Bu ürünün alıcıları ayrıca şunları da satın alıyor
Neuro Poseidon MT4
Daria Rezueva
4.94 (32)
Neuro Poseidon is a new indicator by Daria Rezueva. It combines precise trading signals with adaptive TP/SL levels - creating best possible trades as a result! Message me and get  Neuro Poseidon Assistant  as a gift to automize your trading process! What makes it stand out? 1. Proven profitability on all assets and timeframes 2. Only confirmed BUY and SELL signals present on the chart 3. Adaptive TP & SL levels generated by the software for each trade 4. Easy to understand - suitable for all
Gann Made Easy
Oleg Rodin
4.84 (165)
Gann Made Easy , bay teorisini kullanarak ticaretin en iyi ilkelerine dayanan, profesyonel ve kullanımı kolay bir Forex ticaret sistemidir. WD Gann. Gösterge, Zararı Durdur ve Kâr Al Seviyeleri dahil olmak üzere doğru SATIN AL ve SAT sinyalleri sağlar. PUSH bildirimlerini kullanarak hareket halindeyken bile işlem yapabilirsiniz. Satın alma işleminden sonra, alım satım talimatlarını ve harika ek göstergeleri ücretsiz olarak almak için lütfen benimle iletişime geçin! Muhtemelen Gann ticaret yöntem
M1 Sniper
Oleg Rodin
5 (24)
M1 SNIPER kullanımı kolay bir işlem göstergesi sistemidir. M1 zaman dilimi için tasarlanmış bir ok göstergesidir. Gösterge, M1 zaman diliminde scalping için bağımsız bir sistem olarak kullanılabilir ve mevcut işlem sisteminizin bir parçası olarak kullanılabilir. Bu işlem sistemi özellikle M1'de işlem yapmak için tasarlanmış olsa da, diğer zaman dilimleriyle de kullanılabilir. Başlangıçta bu yöntemi XAUUSD ve BTCUSD ticareti için tasarladım. Ancak bu yöntemi diğer piyasalarda işlem yaparken de ya
Dynamic Forex28 Navigator
Bernhard Schweigert
4.43 (7)
Dynamic Forex28 Navigator - Yeni Nesil Forex Ticaret Aracı. ŞU ANDA %49 İNDİRİM. Dynamic Forex28 Navigator, uzun zamandır popüler olan göstergelerimizin evrimidir ve üçünün gücünü tek bir göstergede birleştirir: Gelişmiş Döviz Gücü28 Göstergesi (695 inceleme) + Gelişmiş Döviz İMPULS ve UYARI (520 inceleme) + CS28 Kombo Sinyalleri (Bonus). Gösterge hakkında ayrıntılar https://www.mql5.com/en/blogs/post/758844 Yeni Nesil Güç Göstergesi Ne Sunuyor?  Orijinallerde sevdiğiniz her şey, şimdi yeni
Trend Catcher ind
Ramil Minniakhmetov
5 (2)
TREND YAKALAYICI GÖSTERGE Trend Yakalayıcı Gösterge, yazarın tescilli ve özelleştirilmiş uyarlanabilir trend analiz göstergelerinin bir kombinasyonunu kullanarak piyasa fiyat hareketlerini analiz eder. Kısa vadeli gürültüyü filtreleyerek ve temel momentum gücüne, volatilite genişlemesine ve fiyat yapısı davranışına odaklanarak gerçek piyasa yönünü belirler. Ayrıca, hareketli ortalamalar, RSI ve volatilite filtreleri gibi yumuşatma ve trend filtreleme özelleştirilmiş göstergelerinin bir kombina
Bu gösterge, pratik ticaret için mükemmel olan otomatik dalga analizine yönelik bir göstergedir! Dava... Not:   Dalga sınıflandırması için Batılı isimleri kullanmaya alışkın değilim. Tang Lun'un (Tang Zhong Shuo Zen) adlandırma kuralının etkisiyle, temel dalgayı   kalem   , ikincil dalga bandını ise   segment   olarak adlandırdım. aynı zamanda segmentin trend yönü vardır. Adlandırma   esas olarak trend segmentidir   (bu adlandırma yöntemi gelecekteki notlarda kullanılacaktır, öncelikle söyleyey
KT Alpha Hunter Arrows MT4
KEENBASE SOFTWARE SOLUTIONS
Çoğu ok göstergesi size yalnızca bir sinyal verir ve geri kalan her şeyi sizin çözmenizi bekler. KT Alpha Hunter Arrows ise size eksiksiz bir işlem planı sunar. Her sinyal oku, grafikte hazır bir planla birlikte görünür: giriş çizgisi, stop loss, dört take profit seviyesi ve bu sembol ile zaman diliminin o anda işlem yapmaya değer olup olmadığını gösteren canlı edge kararı. Pakete dahil olan Trade Manager EA, siz işleme girdikten sonra yönetimi üstlenir. Böylece piyasa hareketli ve duygusal açıd
Scalper Inside PRO
Alexey Minkov
4.74 (68)
Scalper Inside PRO Scalper Inside PRO is an intraday trend and scalping indicator for MetaTrader 4 that uses an exclusive algorithm to quickly detect market direction and key target levels. It automatically calculates entry, exit and multiple profit targets, and shows detailed performance statistics so you can see how different instruments and strategies performed. This helps you choose the most suitable trading instruments for the current market conditions. Additionally, you can easily integrat
Neo Wave PRO
Nikolay Raykov
5 (1)
Price & Time Market Structure Indicator A professional market structure tool that analyzes waves through both price and time — not price alone. Main Description NeoWave PRO is a professional market structure indicator for MetaTrader 4 designed for traders who want to move beyond traditional one-dimensional wave tools such as ZigZag, swing indicators, and basic high/low systems. Most wave indicators analyze only one thing: Price. But a real market wave is not only a price movement. A true wave de
PRO Renko Sistemi, RENKO grafikleri ticareti için özel olarak tasarlanmış son derece hassas bir ticaret sistemidir. Bu, çeşitli ticaret araçlarına uygulanabilen evrensel bir sistemdir. Sistemi etkin piyasa sana doğru ters sinyallerine erişim hakkı denilen ses nötralize eder. Göstergenin kullanımı çok kolaydır ve sinyal üretiminden sorumlu tek bir parametreye sahiptir. Aracı, seçtiğiniz herhangi bir ticaret aracına ve renko çubuğunun boyutuna kolayca uyarlayabilirsiniz. Yazılımımla karlı bir
Current event:  https://c.mql5.com/1/326/A2SR2025_NoMusic.gif A. A2SR nedir ?   * Önde gelen bir teknik göstergedir (yeniden boyama yok, gecikme yok). -- Rehberlik : -- https://www.mql5.com/en/blogs/post/734748/page4#comment_16532516 adresinde -- ve https://www.mql5.com/en/users/yohana/blog A2SR, Destek (talep) ve Direnç (arz) seviyelerini belirlemede özel bir tekniğe sahiptir. İnternette gördüğümüz sıradan yoldan farklı olarak A2SR, gerçek SR seviyelerini belirlemede özgün bir konsepte sahi
MetaBands M4
Vahidreza Heidar Gholami
3.5 (6)
MetaBands uses powerful and unique algorithms to draw channels and detect trends so that it can provide traders with potential points for entering and exiting trades. It’s a channel indicator plus a powerful trend indicator. It includes different types of channels which can be merged to create new channels simply by using the input parameters. MetaBands uses all types of alerts to notify users about market events. Features Supports most of the channel algorithms Powerful trend detection algorith
Genesis Matrix Pro is a professional multi-timeframe trend detection indicator designed to help traders identify high-quality market alignment with clarity and structure. It combines 12 different technical indicators into one visual alignment matrix, allowing traders to quickly see when market conditions are bullish, bearish, or neutral. A signal is generated only when the selected strategies are aligned, helping reduce noise and improve decision-making. PLEASE CONTACT ME AFTER PURCHASE TO GET
Bu ürün 2026 piyasası için güncellendi ve en son MT5 sürümleri için optimize edildi. FİYAT GÜNCELLEME BİLDİRİMİ: Smart Trend Trading System şu anda $99 fiyatıyla sunulmaktadır. Sonraki 30 satın alma işleminden sonra fiyat $199 olacaktır. ÖZEL TEKLİF: Smart Trend Trading System satın aldıktan sonra bana özel mesaj gönderin, Smart Universal EA’yı ÜCRETSİZ olarak alın ve Smart Trend sinyallerinizi otomatik işlemlere dönüştürün. Smart Trend Trading System, daha temiz sinyaller, daha iyi trend yönü
Advanced Supply Demand
Bernhard Schweigert
4.91 (300)
Özel Ticaret –%40 İndirim Yeni Başlayanlar veya Uzman Yatırımcılar İçin En İyi Çözüm! Bu gösterge, bir dizi özel özellik ve yeni bir formül içerdiği için benzersiz, yüksek kaliteli ve uygun fiyatlı bir işlem aracıdır. Bu güncelleme ile çift zaman dilimi bölgeleri gösterebileceksiniz. Sadece daha yüksek bir zaman dilimini değil, hem grafik zaman dilimini hem de daha yüksek zaman dilimini gösterebileceksiniz: İÇ İÇE GEÇMİŞ BÖLGELER GÖSTERİYOR. Tüm Arz Talep yatırımcıları buna bayılacak. :) Önem
IQ FX Gann Levels a precision trading indicator based on W.D. Gann’s square root methods . It plots real-time, non-repainting support and resistance levels to help traders confidently spot intraday and scalping opportunities with high accuracy. William Delbert Gann (W.D. Gann) was an exceptional market analyst, whose trading technique was based on a complex blend of mathematics, geometry, astrology, and ancient mathematics which proved to be extremely accurate. Setup & Guide:  Download  MT5 Ver
PZ Swing Trading
PZ TRADING SLU
5 (3)
Protect against whipsaws: revolutionize your swing trading approach Swing Trading is the first indicator designed to detect swings in the direction of the trend and possible reversal swings. It uses the baseline swing trading approach, widely described in trading literature. The indicator studies several price and time vectors to track the aggregate trend direction and detects situations in which the market is oversold or overbought and ready to correct. [ Installation Guide | Update Guide | Tro
Scalper Vault
Oleg Rodin
5 (37)
Scalper Vault , başarılı bir scalping için ihtiyacınız olan her şeyi size sağlayan profesyonel bir scalping sistemidir. Bu gösterge, forex ve ikili opsiyon tüccarları tarafından kullanılabilecek eksiksiz bir ticaret sistemidir. Önerilen zaman çerçevesi M5'tir. Sistem size trend yönünde doğru ok sinyalleri sağlar. Ayrıca size üst ve alt sinyaller ve Gann piyasa seviyeleri sağlar. Göstergeler, PUSH bildirimleri dahil her türlü uyarıyı sağlar. Göstergeyi satın aldıktan sonra lütfen benimle iletişim
Market Structure Order Block Dashboard MT4, piyasa yapısını ve fiyatın ana tepki bölgelerini doğrudan grafikte okumak isteyen yatırımcılar için tasarlanmış bir MetaTrader 4 göstergesidir. BOS, ChoCH, Order Blocks, Fair Value Gaps (FVG), Likidite, Kill Zones, Volume Profile ve hızlı analiz için kompakt bir gösterge panelini birleştirir. Bu gösterge, piyasa yapısı, ICT ve Smart Money kavramlarını karar çerçevesi olarak kullanan yatırımcılara yöneliktir. Trend devamlarını, olası dönüşleri, fiyat de
" Dynamic Scalper System " göstergesi, trend dalgaları içinde işlem yapmak için scalping yöntemi için tasarlanmıştır. Başlıca döviz çiftleri ve altın üzerinde test edilmiştir, diğer işlem araçlarıyla uyumluluğu mümkündür. Ek fiyat hareketi desteğiyle trend boyunca pozisyonların kısa vadeli açılması için sinyaller sağlar. Göstergenin prensibi. Büyük oklar trend yönünü belirler. Küçük oklar şeklinde scalping için sinyaller üreten bir algoritma trend dalgaları içinde çalışır. Kırmızı oklar yüksel
M30/H1/H4 Swing versiyonu mevcut Büyük hareketleri yakalamak mı istiyorsunuz? Gold Signal Swing Pro (M30/H1/H4). Hedef: işlem başına $20-$80+. https://www.mql5.com/en/market/product/177643 KURAMA GOLD SIGNAL PRO (MT4) — 7 Katmanlı Filtre, Otomatik TP/SL ve Kalite Puanı ile Komple XAUUSD Trading Sistemi REPAINT YOK. YENİDEN ÇİZİM YOK. GECİKME YOK. Her sinyal kalıcıdır. Gördüğün, aldığındır. BONUS: Ömür boyu lisansı al ve AI Zone Radar ($59 değerinde)
PZ 123 Pattern
PZ TRADING SLU
1 (1)
Unlock powerful breakout opportunities The 123 Pattern is one of the most popular, powerful and flexible chart patterns. The pattern is made up of three price points: a bottom, a peak or valley, and a Fibonacci retracement between 38.2% and 71.8%. A pattern is considered valid when the price breaks beyond the last peak or valley, moment at which the indicator plots an arrow, rises an alert, and the trade can be placed. [ Installation Guide | Update Guide | Troubleshooting | FAQ | All Products  ]
MonsterDash Harmonic Indicator is a harmonic pattern dashboard. It recognizes all major patterns. MonsterDash is a dashboard that displays all detected patterns for all symbols and (almost) all timeframes in sortable and scrollable format. Users can add their own user defined patterns . MonsterDash can open and update charts with the pattern found. Settings MonsterDash's default settings are good enough most of the time. Feel free to fine tune them to your needs. The color settings are for thos
Apollo SR Master , Destek/Direnç bölgelerinde alım satımı daha kolay ve güvenilir hale getiren özelliklere sahip bir Destek/Direnç göstergesidir. Gösterge, yerel fiyat zirvelerini ve diplerini tespit ederek Destek/Direnç bölgelerini herhangi bir gecikme olmadan gerçek zamanlı olarak hesaplar. Ardından, yeni oluşan Destek/Direnç bölgesini doğrulamak için, Destek/Direnç bölgesinin dikkate alınabileceğini ve gerçek bir SAT veya AL sinyali olarak kullanılabileceğini gösteren özel bir sinyal gösterir
Sismograf Marketquake Dedektörü. Description in English : https://www.mql5.com/en/market/product/113869?source=Site+Market+Product+Page#description How to use the Seismograph : https://www.mql5.com/en/market/product/113869#!tab=comments&page=2&comment=52806941 Create an EA : https://www.mql5.com/en/market/product/113869#!tab=comments&page=3&comment=52816509 Hangi şekilde işlem yaparsanız yapın, düşük likidite piyasasına girmekten kesinlikle kaçınmak istersiniz.- Sismograf, piyasa rallisin
ŞU ANDA %40INDIRIMLI Yeni Başlayanlar veya Uzman Tüccarlar için En İyi Çözüm! Bu Gösterge benzersiz, yüksek kaliteli ve uygun fiyatlı bir ticaret aracıdır çünkü bir dizi tescilli özellik ve yeni bir formül ekledik. Sadece BİR grafik ile 28 Forex çifti için Döviz Gücünü okuyabilirsiniz! Yeni bir trendin veya scalping fırsatının tam tetik noktasını belirleyebildiğiniz için ticaretinizin nasıl gelişeceğini hayal edin? Kullanım kılavuzu: buraya tıklayın Bu ilk olan, orijinal! Değersiz bir özent
Enigmera
Ivan Stefanov
5 (8)
ENIGMERA: Pazarın Kalbi Önemli: MQL5.com demosu Strategy Tester'da çalışır ve Enigmera'nın tüm işlevlerini tam olarak yansıtmayabilir. Daha fazla bilgi için açıklamayı, ekran görüntülerini ve videoyu kontrol edin. Herhangi bir sorunuz varsa, bana mesaj göndermekten çekinmeyin! Göstergenin kodu tamamen yeniden yazılmıştır. 3.0 sürümü, yeni işlevler ekler ve göstergenin başlangıcından bu yana biriken hataları giderir. Giriş Bu gösterge ve ticaret sistemi, finansal piyasalara dikkat çekici bir ya
Introduction to Fractal Pattern Scanner Fractal Indicator refers to the technical indicator that makes use of the fractal geometry found in the financial market. Fractal Pattern Scanner is the advanced Fractal Indicator that brings the latest trading technology after the extensive research and development work in the fractal geometry in the financial market. The most important feature in Fractal Pattern Scanner is the ability to measure the turning point probability as well as the trend probabi
Auto Optimized Parabolic RSI: Gelişmiş 3D Momentum Motoru Çoğu perakende indikatörü, piyasa volatilitesi değiştiği an çöken statik girdilere dayandığı için başarısız olur. Auto Optimized Parabolic RSI, kendi matematiksel avantajını sürekli olarak yeniden hesaplayarak "indikatör körelmesi" (indicator decay) sorununu çözer ve kurumsal düzeyde kantitatif adaptasyonu doğrudan MT5 terminalinize getirir. Temel Avantaj: Özel Bellek İçi (In-Memory) 3D Optimizasyon   Standart otomatik optimize ediciler,
Trend Lines PRO
Roman Podpora
5 (1)
TREND ÇİZGİLERİ PRO     Piyasanın gerçek yön değişimini anlamaya yardımcı olur. Gösterge, gerçek trend dönüşlerini ve büyük oyuncuların piyasaya yeniden girdiği noktaları gösterir. Anlıyorsun     BOS hatları  Daha yüksek zaman dilimlerindeki trend değişiklikleri ve önemli seviyeler, karmaşık ayarlar veya gereksiz gürültü olmadan gösterilir. Sinyaller yeniden çizilmez ve çubuk kapandıktan sonra grafikte kalır. VERSION MT 5     -    RFI LEVELS PRO  göstergesiyle birlikte kullanıldığında maksimum p
Yazarın diğer ürünleri
Indicador de Bandas de Fibonacci para Metatrader 4 . Este indicador funciona de forma similar a las conocidas Bandas de Bollinger clásicas, pero en lugar de usar la desviación estándar para trazar las bandas usa números de Fibonacci y el ATR (Average True Range). Puede usarse para trazar niveles de soporte y resistencia que pueden emplearse en sistemas de scalping de corto plazo y swing trading.  Las bandas del indicador son calculadas de la siguiente forma: Línea central : Media móvil de n peri
FREE
RSI Signals is a simple dashboard type indicator that displays the values of the RSI (Relative Strength Index) oscillator on various instruments and time frames chosen by the user. In addition, it can be configured by the trader to show signals when the RSI is in an overbought/oversold condition, when it crosses these levels or when it crosses the 50 level, which is important in some strategies. It is simple and easy to set up. By itself, it should not be used as a trading system since RSI signa
The   Moving Average Crossover Dashboard indicator   is a technical tool that displays the crossovers of 2 selected moving averages on the price chart indicating whether it is a bullish or bearish crossover. In addition, as its name indicates, it shows a signal dashboard that indicates in which market and time frame a crossover of the two moving averages occurs. In the setting window the user can select the markets and time frames that can be displayed on the dashboard. You also have the option
The Magic MA Moving Average Indicator is a market analysis tool that has more than 30 types of moving averages that the trader can use to gauge the market trend. Among the types of moving averages that the trader can visualize are the most common MAs (SMA, EMA and SMMA), adaptive moving averages such as FRAMA and KAMA and other MAs based on innovative calculation and analysis methods such as LSMA, ZLEMA and others. The indicator is designed to display all these moving averages on a single cha
Stochastic Signals is a simple dashboard type indicator that displays the values of the stochastic oscillator on various instruments and time frames chosen by the user. The stochastic is usually used in many trading strategies, especially in countertrend systems when the price reaches overbought/oversold conditions. In addition, this indicator can be configured by the trader to show signals when the stochastic oscillator is in an overbought/oversold condition, when it crosses these levels or whe
ADX Analyzer is a simple dashboard type indicator that displays the values of the ADX oscillator on multiple instruments and time frames chosen by the trader. The ADX is a trend strength indicator that is usually used in many trading strategies, especially in trend following systems, as a filter that indicates when the price has a strong bullish or bearish trend. This indicator and its dashboard can be configured to show signals when the ADX detects a strong bullish/bearish trend, when a strong
Williams R Scanner Indicator is a technical tool for Metatrader 4 designed to display a simple dashboard showing the values of the Williams %R oscillator across multiple markets and time frames of the trader's choosing. The dashboard also shows when the Williams %R indicator reaches an overbought or oversold condition which may precede market reversals. The trader also has the option of viewing signal alerts on the platform that indicate when the Williams %R has made a bullish or bearish cross
The Donchian Scanner Signals Indicator with is a powerful tool designed for traders operating in the financial market using the Metatrader 4 platform. This indicator combines the popular Donchian Channels strategy with advanced signalization and real-time alert features, providing a clear view of potential entry and exit points in a financial asset. Key Features: Donchian Channels Visualization: The indicator graphically displays Donchian Channels on the price chart. These channels are formed us
MA Trend Following Indicator for MT4 is a simple technical analysis tool designed to follow the trend in any currency pair chosen by the trader by combining 3 moving averages on two different time frames, one long term and one short term.  It basically provides a bullish or bearish signal when the moving averages on one time frame align with the moving averages on a different time frame to have a confluence signal. The indicator is presented as a screener with multiple currency pairs (that th
The Mean Reversal Indicator for MetaTrader 4 is a custom technical tool that identifies when the market reaches an n-period high or low, signaling potential mean reversion opportunities. Acting as a versatile screener, this indicator enables traders to detect n-period highs/lows across any selected timeframe and market offered by the broker, making it highly adaptable for multi-market or multi-timeframe analysis. Additionally, the Mean Reversal Indicator offers optional signal filters, including
RSI Screener for MT5 is a simple dashboard-type indicator that displays the RSI (Relative Strength Index) oscillator values on different instruments and time frames chosen by the user. In addition, it can be configured by the trader to show signals when the RSI is in overbought/oversold condition, when it crosses these levels or when it crosses the 50 level, which is important in some strategies. It is simple and easy to configure. On its own, it should not be used as a trading system since RSI
Filtrele:
Değerlendirme yok
Değerlendirmeye yanıt