YouTube'dan Mağaza ile ilgili eğitici videoları izleyin
Bir alım-satım robotu veya gösterge nasıl satın alınır?
Uzman Danışmanınızı
sanal sunucuda çalıştırın
sanal sunucuda çalıştırın
Satın almadan önce göstergeyi/alım-satım robotunu test edin
Mağazada kazanç sağlamak ister misiniz?
Satış için bir ürün nasıl sunulur?
MetaTrader 4 için ücretli teknik göstergeler - 103
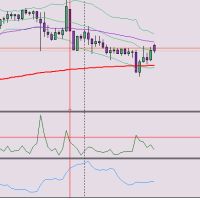
How many time is Candle's Range bigger than Atr indicator? HERE IS THE ANSWER YOU WERE LOOKING FOR!! This awesome indicator is meant to better read market and keep Valuable informations for a good trading payload. let me know if you like it in comments, if it's usefull and if you have hints to make it better i would appreciate it.
this indicator measures proportion between range and atr

The Practitioner indicator is based on a unique algorithm for analyzing price behavior and presents the result of this complex work in the form of lines. One of the advantages of this indicator is that it automatically changes the color of the line according to the current direction of the price movement.
It is important to note that the indicator has an option to enable alerts when the line color changes. This gives the trader the opportunity to quickly respond to changes and identify new tre

TrendMaster: Your Ultimate Non-Repaint Trading Indicator for Consistent Profits Introducing TrendMaster , the cutting-edge NONREPAINT Trading indicator that empowers traders to seize market opportunities with unparalleled precision. Utilizing a sophisticated blend of the Relative Strength Index (RSI), Stochastic Oscillator, and Average Directional Index (ADX), TrendMaster delivers highly accurate buy and sell signals, allowing traders to capitalize on both bullish and bearish trends confidently

The RSI Advanced tool will help traders capture trends and optimal entry points by:
- Enter a Buy order when the green line crosses the yellow line. Provided that the yellow line is near line 32 or 20 - Enter a Sell order when the green line crosses the yellow line. Provided that the yellow line is near line 68 or 80
Additionally, you can combine it with the convergence divergence that occurs at the green line. **When you purchase the Mastering the RSI MT4 or Mastering the RSI MT5 indicator,

SmartSignal Sniper: En İyi Ticaret Ortağınız SmartSignal Sniper ile kesin alım satım sinyallerinin gücünü keşfedin. Hassas alım satım sinyalleri sağlamak üzere tasarlanan bu ileri düzey araç, tüm seviyelerdeki tüccarların finansal piyasalarda güvenle ve netlikle gezinmesini sağlar. Ana Özellikler: Mikrometrik Hassasiyet: SmartSignal Sniper, tüccarların piyasada kârlı fırsatları tespit etmelerine yardımcı olmak için gelişmiş algoritmaları kullanarak kesin alım satım sinyalleri sağlar. Anlık Yürüt

This scanner uses Quarters Theory. It finds the nearest quarters to current price. And when price gets close within a few points, then it highlights and sends alerts. Features: Define Major Quarters Distance for every timeframe Option to use: Half Point between majors Quarters between half point and majors Search for nearest quarter point and price Show Highlight and send Alerts Show/Hide Quarter Lines Show/Hide Price and QP Distance
Detailed post and Extras: https://www.mql5.com/en/blogs/post/

Adaptive Market Dynamics Indicator (AMDI) is an innovative tool for traders across all financial markets. This indicator is designed to provide traders with a deep understanding of market dynamics and adaptive trading signals based on current market conditions. Key Features and Benefits: Adaptive Analytics : AMDI can automatically adapt to changing market conditions, allowing traders to effectively adjust their strategies in real-time. Multifactor Analysis : The indicator offers a comprehensiv

OVERVIEW
K-means is a clustering algorithm commonly used in machine learning to group data points into distinct clusters based on their similarities. While K-means is not typically used directly for identifying support and resistance levels in financial markets, it can serve as a tool in a broader analysis approach.
Support and resistance levels are price levels in financial markets where the price tends to react or reverse. Support is a level where the price tends to stop falling and m

"Ayarlanabilir Fraktallar" - fraktal göstergesinin gelişmiş bir versiyonudur, çok kullanışlı bir ticaret aracıdır!
- Bildiğimiz gibi Standart fraktallar mt4 göstergesinin hiç ayarı yoktur - bu, yatırımcılar için çok elverişsizdir. - Ayarlanabilir Fraktallar bu sorunu çözmüştür - gerekli tüm ayarlara sahiptir: - Göstergenin ayarlanabilir periyodu (önerilen değerler - 7'nin üzerinde). - Fiyatın Yüksek/Düşük noktalarına ayarlanabilir mesafe. - Fraktal oklarının ayarlanabilir tasarımı. - Gösterged
'Zoro LITE' is a reversal strategy based MT4 indicator with advance pre-alert system. Its an 100% non repaint indicator with an average accuracy of about 70-95% in a ranging market. --------------------------------------------------------- Features: Neural Network based Advance price action algorithms Pre-alert (get ready) signals Non-delay indications 24/7 signals OTC markets supported Auto-trading supported 100% Non repaint 100% No lag No recalculating Lifetime license -----------------------

Indicator : RealValueIndicator Description : RealValueIndicator is a powerful tool designed specifically for trading on the EURUSD pair. This indicator analyzes all EUR and USD pairs, calculates their real currency strength values, and displays them as a single realistic value to give you a head start on price. This indicator will tell you moves before they happen if you use it right. RealValueIndicator allows you to get a quick and accurate overview of the EURUSD currency pair tops and bottoms,
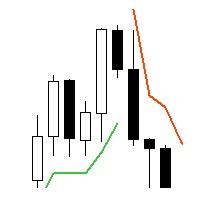
Supertrend - невероятно мощный и универсальный индикатор, предназначенный для помощи трейдерам в определении текущего тренда на конкретном торговом инструменте. С помощью двух встроенных индикаторов, Average True Range и Standard Deviation, трейдеры могут выбрать наиболее подходящий индикатор для своей стратегии торговли. Пользователи также могут настроить период этих индикаторов и выбрать цену (Close, High, Low, Open, Weighted), к которой он должен быть применен, с Typical price в качестве опци

This indicator is a simple trend line indicator.
The upper trend line is the highest price of 60 past candlesticks, the highest price of 30 past candlesticks,
The bottom line is the trend line that connects the lowest price of 60 past candlesticks and the lowest price of 30 past candlesticks.
*The color of the trend line is white.
Notes
This indicator is created with the above configuration, so if the highest and lowest prices of the past 60 candlesticks and 30 candlesticks are the same,

このインディケータはボリンジャーバンドを裁量およびEAで実際に利用してきた私自身の経験から、より手軽に、かつ効果的に活用できるよう作成された裁量トレード用サインツールです。 ブレイクアウトでの順張り、リバウンドでの逆張りの両面で利用でき、各種のフィルター機能でより精度の高いサインを発信します 勝敗判定機能により、このインディケータの直近の相場環境に対する有効性を確認できます 全通貨ペア、全タイムフレームで利用できます。リペイントはしません
設定項目は以下の通りです。 Bollinger Bands Period
Bollinger Bands Deviation
Bollinger Bands Shift
Entry Mode ...ボリンジャーバンドにタッチしてからのBreakout(順張り), Rebound(逆張り)のどちらかを指定 Plus Filter ...独自アルゴリズムによるフィルターでシグナルの精度を高めます(Reboundモード専用) Trend Filter ...下で設定する移動平均のトレンド方向でのシグナルに限定します Moving Average

Trop is a trend indicator that has several important advantages. It helps to pinpoint both new and existing trends in the market. One of its key advantages is its quick adjustment and responsiveness to changes in schedule. The effectiveness of the indicator depends on the set CalcBars period. The longer this period, the smoother the indicator displays the trend line. On the other hand, as the period decreases, the indicator takes into account more market noise, which can be useful in generating

In the world of trading, one of the main concerns is finding a reliable trading system. Meet the TrendEdge Channel indicator - your reliable companion in this search. Developed based on complex mathematical calculations, this indicator predicts the most likely short-term price movements.
TrendEdge Channel is designed specifically to identify trends in price movements. Thanks to it, you can quickly determine not only the direction of the trend, but also the levels of interaction between buyers

The SignalSailor indicator is your reliable assistant in Forex for quick market analysis. It not only reflects the current market condition but also provides valuable signals about the best times to open trades. Market conditions are constantly changing, and to stay ahead, a trader needs to quickly adapt their strategies. This is precisely why the Klaus indicator was created - it will help you accurately determine the direction of the trend on the price chart.
SignalSailor is an indispensable

The TrendTide indicator provides accurate signals about potential market reversals. Its primary purpose is to generate signals for entering and exiting trades. Determining the current market trend is a critically important aspect for traders. The intelligent algorithm of TrendTide efficiently identifies trends, filters market noise, and creates precise entry and exit signals.
This indicator represents an advanced algorithm for visualizing the market trend. It is designed to identify both long-

Introducing the Reversal and Breakout Signals
This innovative tool is crafted to enhance your chart analysis by identifying potential reversal and breakout opportunities directly on your charts. It's designed with both novice and experienced traders in mind, providing intuitive visual cues for better decision-making. Let's dive into the key features and how it operates:
### Key Features:
Dynamic Period Settings: Customize the sensitivity of the indicator with user-def

The indicator identifies divergence by analyzing the slopes of lines connecting price and MACD histogram peaks or troughs. Bullish Divergence (Convergence): Occurs when the lines connecting MACD troughs and corresponding price troughs have opposite slopes and are converging. Bearish Divergence: Occurs when the lines connecting MACD peaks and corresponding price peaks have opposite slopes and are diverging. When a divergence signal is detected, the indicator marks the chart with dots at the pric

The Market Sentiment Meter indicator calculates the saturation levels of the price chart. A signal to exit the oversold zone indicates a buying opportunity, and a signal to exit the overbought zone indicates a selling opportunity. Typically, for this indicator you need to set relative values for the overbought (Top) and oversold (Bottom) levels.
Often a good trend can be seen visually on the price chart. However, an experienced trader must clearly understand the current distribution of forces
Introducing High Probability SARs, a classic Forex indicator designed to enhance your trading strategy with its advanced analysis capabilities. High Probability SARs utilizes sophisticated algorithms to identify potential trend reversals with precision. By incorporating the Parabolic SAR indicator, it offers traders valuable insights into market dynamics, allowing for informed decision-making. This innovative tool provides traders with signals based on the Modified parabolic SARs, helping to ide

1. Compound Drawings (1) Line segment with arrow (2) Continuous line segment (broken line) (3) Parallelogram (4) Polygon (5) Profit and loss ratio measurement tools
2. Backtracking By the Z key in the process of drawing the line Line types that support Z-key backtracking: continuous line segments (broken line) ,channels,parallelograms,polygons, and fibo extensions.
3.Automatic Adsorption (1) Click the "Lock-Button" to switch the automatic adsorption switch before drawing the line (2) The

TrendTrack indicator: Stay on trend easily!
The TrendTrack indicator is designed to analyze price behavior in the Forex market, helping the trader to quickly spot temporary weaknesses or obvious changes in trend direction. Entering the market is only the first step, but maintaining a position is more difficult. With TrendTrack, staying on trend becomes easy!
Peculiarities:
Trend Analysis: The indicator analyzes historical data, providing signals to the trader. The arrow format of the indicat
テクニカル指標開発の第一人者であるトム・デマークが考案した TDシーケンシャルは、 トレンドの転換点を判断するのに有用なインディケータです。このインディケータは TDシーケンシャルを裁量およびEAで実際に利用してきた私自身の経験から、より手軽に、かつ効果的に活用できるよう作成された裁量トレード用サインツールです。
強いトレンドが生じている際に多くのだましが生じるのはTDシーケンシャルの弱点と思われますが、これを克服するために強力なフィルターを装備しています。また、最も有効と思われるセットアップ9に絞ってサインを発信します。
全通貨ペア、全タイムフレームで利用できます。勝敗判定機能により、このインディケータの直近の相場環境に対する有効性を確認できます。
設定項目は下記のとおりです。 Enable Protect Mode...強いトレンドが発生した際の連敗を回避します Box Filter...下で設定する3つのタイムフレームでの移動平均でパーフェクト・オーダーが発生していない状態をボックス相場と判定し、サインを限定します Moving Average Time Frame1 Mo
The Trendline Trader indicator is designed to reliably track market trends, ignoring sharp fluctuations and noise in the market. This indicator is suitable for trading on both short and long time intervals due to its ability to filter out sudden price spikes and corrections. It is based on the iLow, iHigh, iMA and iATR indicators, which makes it particularly reliable.
Parameters for setting up the indicator: Length: period for channel calculation and noise filtering. Star: period for determini

History VT Информационный индикатор. Показывает на графике, сразу после открытия сделки, стрелку именно на той японской свече, где позиция открыта.
То есть там, где появилась штрихпунктирная линия открытой сделки, в терминале.
Далее, после открытия сделки, как обычно, трейдер ставит SL и TP и ждёт итога своего выбора направления движения.
После того как сделка закрылась, по « sl » или « tp » или «вручную», индикатор отображает на графике уровни и текстовые сноски параметров сделки.
Сноски

Introduction
One of the patterns in "RTM" is the "QM" pattern, also known as "Quasimodo". Its name is derived from the appearance of "Hunchback of Notre-Dame" from Victor Hugo's novel. It is a type of "Head and Shoulders" pattern.
Formation Method
Upward Trend
In an upward trend, the left shoulder is formed, and the price creates a new peak higher than the left shoulder peak . After a decline, it manages to break the previous low and move upward again. We expect the price to

Product detailed post: https://www.mql5.com/en/blogs/post/756962
Get free demo from the link in above post.
Features: - Multi Heiken Parameters
- Alerts & Highlights for Heiken Switch
- Heiken Alignment Alerts
- Multi-timeframe Alignment Alerts
- Multi Currency
Heiken Explained: Heiken Settings: All comma separated lists will be used for different heiken ashi's. Example: 5,40,188 will mean that MAPeriod1 in 1st heiken will be 5; In 2nd heiken will be 40 and in 3rd heiken ashi will be 188. 1,1

Trend Master Chart ihtiyacınız olan trend göstergesidir. Grafiği kaplar ve farklı pazar trendlerini/hareketlerini tanımlamak için renk kodlamasını kullanır. İki hareketli ortalamayı ve farklı osilatörleri birleştiren bir algoritma kullanır. Bu üç elementin periyotları değiştirilebilir. Herhangi bir zaman diliminde ve herhangi bir Çiftte çalışır.
Bir bakışta yükseliş veya düşüş trendini ve bu trende farklı giriş noktalarını tespit edebileceksiniz. Örneğin, belirgin bir yükseliş eğilimi sırasında
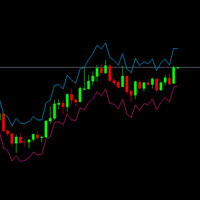
For all temporalities and all charts. Based on the ATR indicator. Calculates and draws on the chart the appropriate points to place Stop Loss or Take Profit according to the current market volatility. The following inputs can be adjusted for a more customized use of the indicator: ATR_Period: number of previous candles to be taken into account for the calculation. ATR_Multiplier: Number by which the ATR will be multiplied to draw the points on the chart. A low multiplier will mean a high risk a

Advanced Currency Strength Indicator Comprehensive Market Analysis in One Tool User-Friendly and Versatile for All Traders This indicator simplifies market analysis by evaluating the strength of 28 forex currency pairs, along with Gold, Silver, and other selected instruments. By using a Triangular Moving Average (TMA) and ATR-based bands , it provides a structured view of market movements, assisting traders in making informed decisions. Identify Market Trends Efficiently The indicator helps ass

Forex Gump Advanced is a ready-made trading strategy based on one indicator. Forex Gump Advanced is an indicator that shows the trader when to open trades, in which direction to open and when to close. Forex Gump Advanced shows all the necessary information in a clear form on the chart. The indicator works on all currency pairs and all timeframes.
Advantages of the indicator: completely ready trading system does not redraw in 95% of cases the price goes in the direction of the signal. 5% of si
TeconLab Indicator User Guide Overview The TeconLab Indicator is a tool for MetaTrader 4 (MT4) users, fine-tuned to gather price information, including Date, Time, Open, High, Low, Close, and Volume, and update this data in real-time. Uniquely, this indicator autonomously refreshes the CSV file every minute or less, meaning there's no need for manual restarts—just activate it once, and it will continuously collect data as long as MT4 is running. It maintains the latest data according to the size
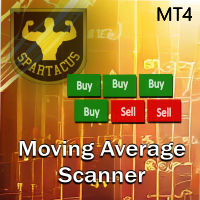
Moving Average Scanner, grafiği değiştirmeden, birkaç zaman dilimindeki trendi bir bakışta görmek için mükemmel, çok zaman dilimli bir tarayıcıdır.
9 zaman birimi üzerinden seçtiğiniz 4'e kadar hareketli ortalamayı kullanabilir. Tamamen yapılandırılabilir ve basitçe "sürükle ve bırak" yöntemiyle grafik üzerinde herhangi bir yere taşınabilir.
Hareketli ortalamalar 4 farklı hesaplama yöntemiyle yapılandırılabilir. Ayrıca hareketli ortalamaların sayısına ve dönem sayısına göre uyarılar da ayarlay
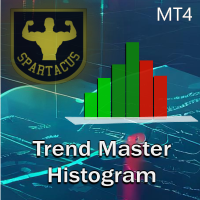
Trend Grafiği Histogramı, iki hareketli ortalama ve birkaç osilatör kullanan bir algoritmaya dayalı bir göstergedir. Renk kodu sayesinde trendi hızlı bir şekilde tanımlamanıza ve en büyük piyasa hareketlerinden yararlanmanıza olanak tanır.
Açık renkler trendi, koyu renkler dürtüleri, gri ise pazara girmemeniz gerektiğini belirtir.
MT5 versiyonu burada.
Giriş parametreleri:
- 1. Dönem (hızlı dönem)
- 2. Dönem (yavaş dönem)
- Osilatör periyodu
İki tür uyarıyı etkinleştirebilirsiniz:
- Ayı/B

Once upon a time, in the bustling streets of Gotham City, there lived a mysterious figure known only as the Joker. With his enigmatic grin and unpredictable nature, the Joker roamed the city's financial district, leaving chaos and uncertainty in his wake. One fateful day, a group of traders stumbled upon a peculiar artifact hidden deep within the dark alleys of Gotham. It was a cryptic indicator known as the "Joker Arrow," rumored to possess the power to predict market movements with uncanny acc
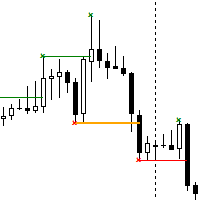
The Break of Structure (BoS) and Change of Character indicator is a powerful tool designed to identify significant turning points in price movements on financial charts within the MetaTrader 4 platform. By analyzing price action, this indicator highlights instances where the market shifts from a trend to a potential reversal or consolidation phase. Utilizing sophisticated algorithms, the indicator identifies breakouts where the structure of price movement undergoes notable changes. These breakou
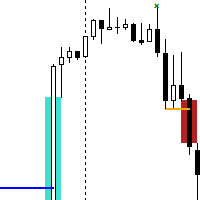
The Break of Structure (BoS) and Change of Character indicator with Fair Value Gap (FVG) filter is a specialized tool designed to enhance trading strategies by pinpointing high-probability trading opportunities on price charts. By integrating the BoS and Change of Character concepts with the FVG formation, this indicator provides traders with a robust filtering mechanism to identify optimal entry and exit points. The indicator identifies instances where the structure of price movements is disrup

About Line Drawing: ( 1) Select Line Type Zigzag Line Fibo Horizontal Trend Line Range Line Price-Time Net ( 2) Set Line Style To set line color built-in or style and width just by clicking certain button To set line color to user color by clicking the second color button of second line when it is pressed ( 3) Start Drawing If you have not pressed any of those Drawing-Type-Button(HL/Rng/Net/Fibo),when you select the Line-Color-Button or Line-Style-Button or Line-Width-Button it will draw Zi
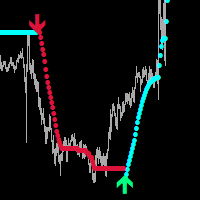
Special offer! https://www.mql5.com/ru/users/bossik2810
Global Parabolic MT4
Indicator for scalping on M1-M5.
A very good indicator for your trading system, it can be used as a standalone
trading system, I recommend using it together with - System Trend Pro The indicator does not repaint and does not change its data.
Settings:
Change the FILTER parameter for accurate market entries.
Any questions? Need help?, I am always happy to help, write me in private messages or
In telegram
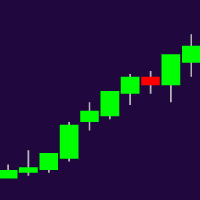
Higher Timeframe Chart Overlay will display higher timeframe candles, including the number of candles high/low you specify.
You no longer need to switch timeframes to check the candles. Everything can be shown in one chart. MT5 Version : https://www.mql5.com/en/market/product/115682 Almost everything can be change as you want. You can change/set:
- Choose different colors for the body and top/bottom wicks.
- Panel's height and width.
- The width of the body and wicks
- Change background a

Gold Level MT4 Special offer - https://www.mql5.com/en/users/bossik2810
A great helper for trading Gold.
Levels do not repaint and do not change their data We recommend using it with the indicator - Professional Trade Arrow
Levels are built every day, so you will trade every day with the indicator.
Gold Level.
Price markups are shown on the chart, after reaching TP1 or SL1, close half of the position, and the rest is transferred to breakeven.
Any questions? Need help?, I am always happy to

BB Reversal Arrows Teknik Ticaret Sistemi, perakende kararları almak için ters noktaları tahmin etmek için geliştirilmiştir.
Mevcut pazar durumu gösterge ile analiz edilir ve çeşitli kriterler için yapılandırılır: ters anlar beklentisi, potansiyel dönüm noktaları, satın alma ve satış sinyalleri.
Gösterge fazla bilgi içermez, tüccarların makul kararlar vermesine izin veren görsel anlaşılabilir bir arayüze sahiptir.
Tüm oklar mumu kapatıyor gibi görünüyor, yeniden çizim yapmadan, birkaç uyarı tür

TRADE THE BREAKOUTS like Gordon Gekko Gordon Gekko, the ruthless and iconic character from the movie "Wall Street," is renowned for his aggressive and opportunistic trading strategies. When it comes to trading breakouts, Gekko embodies the mindset of a savvy and relentless trader who seizes every opportunity to capitalize on market movements. In Gekko's trading playbook, spotting breakout opportunities is akin to identifying potential gold mines in the market. He meticulously scans the charts

Metatrader için hacim profili göstergemizle hacim analizinin gücünü keşfedin! / MT5 Sürümü
Temel Hacim Profili, işlemlerini optimize etmek isteyen manuel yatırımcılar için özel olarak tasarlanmış bir göstergedir. Hacim Profili Göstergesi, piyasa davranışını daha iyi anlamak isteyen tüm ciddi yatırımcılar için önemli bir araçtır. Yenilikçi çözümümüzle, işlem hacminin fiyatlara nasıl dağıldığını açık ve net bir şekilde görselleştirebilirsiniz. Bu sayede destek ve direnç seviyeleri, birikim ve da

The Trend_Scalper_Arrows_Entry&Exit trend indicator perfectly follows the trend, indicates entry search zones, indicates entry signals with arrows, and also indicates zones for fixing market orders with vertical lines. An excellent indicator for both beginners in Forex trading and professionals.
All lines, arrows, alerts can be disabled.
See all indicator parameters on the screenshot.

Channel indicator, written according to a strategy based on indicators: BollingerBands, Moving Average, RSI and TMA. The indicator embodies arrow signals for the trend, counter-trend, and also for fixing transactions. And also all possible alerts. The indicator is ideal for working together with a trend indicator for taking profits. All settings are on screenshots.

Subscribe to the MA7 Trading channel to receive notifications about new programs, updates and other information. Ask questions in the profile on the MQL5 .
Description of work The MA7 Clover indicator is based on candle shapes. Shows the "Pin Bar" candle pattern. Detailed information about the MA7 Clover indicator.
Indicator settings General settings: Min body size ; Max body size ; Min nose size ; Max nose size ; Minimum pattern size ; Maximum pattern size ; Analysis of the candle direction
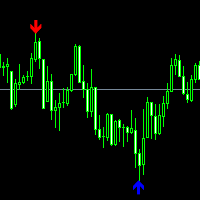
Special offer! https://www.mql5.com/ru/users/bossik2810 AMS Scalper
An excellent indicator for the entry point into the market; we use indicator signals only according to the trend.
Settings:
Range - 50 (range size for signal search.)
Maximum candles Back - 3 (after how many candles to set a signal)
P.S. For the signal to appear on the zero candle, set 0.
We recommend a trend indicator - Quantum Entry PRO
Still have questions? do you need help?, I'm always happy to help, write to m
MA Öldürücü Göstergesi, hareketli ortalamaları kullanan yatırımcılar için nihai silahtır. Doğrudan bir yönetim paneli tarafından erişilebilen çeşitli araçları kullanan eksiksiz bir sistemdir. Araçları sayesinde piyasa hakkında genel bir bakışa sahip olursunuz ve bir pozisyona giriş için karar vermede değerli yardıma sahip olursunuz.
Şunlardan oluşur:
- Bir renk kodu kullanarak trendi doğrudan grafik üzerinde görüntüleyen Trend grafiği Ana göstergesi. Bu eğilim, iki hareketli ortalama ve birkaç
RSI Pro Analyser Göstergesi, aynı anda birden fazla zaman diliminde bilinçli kararlar vermek isteyen yatırımcılar için tasarlanmış güçlü bir araçtır. Bu gösterge aşırı alım, aşırı satış ve trend sinyalleri sağlamak için RSI'yı kullanarak piyasaya giriş fırsatlarını tanımlamayı kolaylaştırır . Farklı piyasa koşullarını gösteren açık ve belirgin renk kodları sayesinde okuma kolaylığı sağlaması en büyük avantajıdır.
Gösterge, RSI değerlerini ve ilgili sinyalleri beş farklı zaman diliminde (D,H4,H1

Bu işlem aracıyla aynı anda 15 piyasayı tarayabilirsiniz.
Karşınızda yeni ticaret göstergesi 2024:
️ Kontrol Paneli Çoklu Para Birimi Çoklu Zaman Çerçevesi Stokastik.
Bu ticaret aracını oluşturmamın en az iki nedeni var:
Öncelikle tek piyasayı gözlemlemekten sıkıldım. İkincisi, başka bir pazara giriş anını kaybetmek istemiyorum.
Bu yüzden aynı zamanda diğer piyasa koşullarını da bilmek istiyorum.
Bu nedenle birden fazla piyasanın koşullarını aynı anda tarayabilecek bir tarayıcıya ihtiyac

The Forex Correlation Indicator is a powerful tool designed to analyze and display the correlation between different major forex pairs in the market. This indicator helps traders identify relationships and trends between currency pairs, allowing for more informed trading decisions. Key Features: Displays correlation coefficients between pairs. Visualizes correlation strength through color-coded indicators. Customizable settings for timeframes and correlation calculations. User-friendly interfac

The Forex indicator TrendNavigator is a technical indicator. TrendNavigator is a tool that allows traders employing this strategy to better understand what is happening in the market and predict in which direction the price will continue to move. The indicator's values are calculated based on price movements of the currency pair or any other financial asset. Within the scope of technical analysis, the TrendNavigator indicator is used by traders to forecast future price values or the overall

The Trend Seeker indicator is perfectly suited for tracking long-term trends in the Forex market and can be used without restrictions on instruments or time intervals. This indicator allows attempting to forecast future values, but its main application lies in generating buy and sell signals. The AlphaTrend Seeker tracks market trends, disregarding sharp fluctuations and noise around the average price. It is based on the idea of technical analysis, asserting that the market has a cyclical n

Basic Support and Resistance Göstergimiz, teknik analizinizi artırmak için ihtiyacınız olan çözümdür.Bu gösterge, destek ve direnç seviyelerini grafikte yansıtmanıza olanak tanır/ MT5 sürümü
Özellikler
Fibonacci seviyelerinin entegrasyonu: Fibonacci seviyelerini destek ve direnç seviyelerinin yanı sıra görüntüleme seçeneğiyle, göstergemiz size piyasa davranışı ve olası tersine dönme alanları hakkında daha derin bir fikir verir.
Performans Optimizasyonu: Genişletilmiş satırları yalnızca her ç
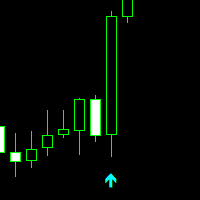
Professional Trade Arrow
Special offer! https://www.mql5.com/ru/users/bossik2810 Non-repaint MT4 technical indicator.
works on all timeframes 1 minute to the monthly timeframe
the trade vision buy and sell arrow is a multi currency and synthetic indicator
Aqua arrow look for selling opportunities
Crimson arrow look for buying opportunities.
wait for candle to close and arrow to appear before taking any trades.
Settings: Key value - 3.0 ( This parameter is adjusted for a better sig

The "Trend Tandem" indicator is a trend analysis tool in financial markets that helps traders determine the direction of price movement.
Options:
RISK: Determines the level of risk taken into account in the trend analysis. The higher the value, the more aggressively volatility is taken into account. SSP (SSP Period): Defines the period of the moving average used to identify a trend. The higher the value, the smoother the trend signal will be. CountBars: Determines the number of bars on which
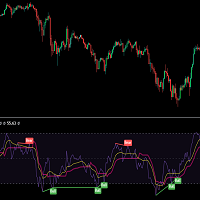
MOST is applied on this RSI moving average with an extra default option added VAR/VIDYA (Variable Index Dynamic Moving Average)
MOST added on RSI has a Moving Average of RSI and a trailing percent stop level of the Moving Average that can be adjusted by changing the length of the MA and %percent of the stop level.
BUY SIGNAL when the Moving Average Line crosses above the MOST Line
LONG CONDITION when the Moving Average is above the MOST
SELL SIGNAL when Moving Average Line crosses below MOS

Trend Arrow Reaper , ok işaretleriyle alım-satım sinyalleri veren bir trend takip göstergesidir. Fiyatı analiz ederek potansiyel dönüş noktalarını belirler. Özellikler: Trading okları: Mavi yukarı ok – Alış sinyali (long). Sarı aşağı ok – Satış sinyali (short). Yanlış sinyaller azaltıldı – Daha doğru sonuçlar için filtreleme. Tüm zaman dilimlerinde çalışır – M1'den MN'ye kadar. Kullanımı kolay – Karmaşık ayarlar gerekmez. Nasıl Kullanılır? Ok çıkmasını bekleyin (mavi=long, sarı=short)

MA Trend Following Indicator for MT4 is a simple technical analysis tool designed to follow the trend in any currency pair chosen by the trader by combining 3 moving averages on two different time frames, one long term and one short term.
It basically provides a bullish or bearish signal when the moving averages on one time frame align with the moving averages on a different time frame to have a confluence signal.
The indicator is presented as a screener with multiple currency pairs (that th
Bu güçlü araç, trend çizgilerini otomatik olarak tanımlar, ticaret stratejinizi kolaylaştırmanıza ve daha bilinçli kararlar vermenize yardımcı olur. mt5 sürümü
Temel özellikler Otomatik Trend Hattı Algılama : "Temel Trendline" göstergesi, potansiyel trend çizgileri için pazarı tarar ve bunları anında gösteriyor.Bu size değerli zaman kazandırır ve asla önemli bir eğilimi kaçırmanızı sağlar. Kullanıcı dostu panel : Göstergemiz, çeşitli trend çizgileri kolayca çizmenizi sağlayan güzel, sezgisel bi

MAXLUM SYSTEM is a Trading System that uses anti-Margin Call without using SL with a positive correlation Hedging Strategy
Simple example of BUY on EURUSD and SELL on GBPUSD at the same time This kind of trading will not occur as a Margin Call By calculating the GAP difference between the 2 pairs we can take advantage of the GAP
This indicator will be more effective if you use Data Analysis download excel file on telegram Group Please join the Maxlum System Telegram group for details t.me/max

The Tripl indicator is designed to visually display the current trend in the market. One of the key aspects of currency market analysis is identifying a trend, which is a stable direction in which prices are moving. For this purpose, the Tripl indicator uses calculations that smooth out sharp fluctuations that do not have a significant impact on the overall trend of price movements.
A trend can be either upward (bullish) or downward (bearish). Most often, a trend develops for a long time befor

With the growth of information technology and the increasing number of participants in financial markets, traditional analysis tools are becoming less effective. Conventional technical indicators, such as the moving average or stochastic, in their pure form are unable to accurately determine the direction of the trend or its reversal. Is it possible to find an indicator that remains effective for 14 years without changing its parameters, and at the same time adapts to market changes? Yes, such
Akıllı Hacim Takipçisi, alış ve satış hacmi verilerini özel bir pencerede görsel olarak sunarak piyasa duyarlılığı hakkında bilgi sağlamak üzere tasarlanmış bir göstergedir. Bu sezgisel araç, yatırımcıların alım ve satım faaliyetinin nerede yoğunlaştığını hızlı bir şekilde belirlemelerine yardımcı olarak daha bilinçli ticaret kararları vermelerine olanak tanır.
Smart Volume Tracker ile piyasanın yükseliş eğilimine mi yoksa düşüş eğilimine mi yöneldiğini kolayca ölçebilirsiniz. Alım faaliyetini

30% DISCOUNT ! DISCOUNT ! DISCOUNT ONLY FOR 5 USERS at125$ valid for 1 day only.Grab it The PERFECT TREND HIT creates BUY and SELL perfect trend arrow signals based on ADX EMA AND RSI And all filters inbuilt with accurate trend entries. Furthermore, the indicator and template display the trend direction, strength, and trade recommendation for independent price charts. ROCK WITH THE TREND Moreover, it shows the final trade recommendation to BUY or SELL with all filters and displays that info

Bu işlem aracıyla aynı anda 15 piyasayı tarayabilirsiniz.
Karşınızda yeni ticaret göstergesi 2024:
️ Dashboard Çoklu Para Birimi Çoklu Zaman Çerçevesi Çift CCI.
Bu ticaret aracını oluşturmamın en az iki nedeni var:
Öncelikle tek piyasayı gözlemlemekten sıkıldım. İkincisi, başka bir pazara giriş anını kaybetmek istemiyorum.
Bu yüzden aynı zamanda diğer piyasa koşullarını da bilmek istiyorum.
Bu nedenle birden fazla piyasanın koşullarını aynı anda tarayabilecek bir tarayıcıya ihtiyacım var

Bu işlem aracıyla aynı anda 15 piyasayı tarayabilirsiniz.
Karşınızda yeni ticaret göstergesi 2024:
️ Kontrol Paneli Çoklu Para Birimi Çoklu Zaman Çerçevesi Çift RSI.
Bu ticaret aracını oluşturmamın en az iki nedeni var:
Öncelikle tek piyasayı gözlemlemekten sıkıldım. İkincisi, başka bir pazara giriş anını kaybetmek istemiyorum.
Bu yüzden aynı zamanda diğer piyasa koşullarını da bilmek istiyorum.
Bu nedenle birden fazla piyasanın koşullarını aynı anda tarayabilecek bir tarayıcıya ihtiyacı
MetaTrader mağazası, alım-satım robotları ve teknik göstergelerin benzersiz bir deposudur.
Yatırımcılara sunduğumuz benzersiz hizmetler hakkında daha fazla bilgi edinmek için MQL5.community - Kullanıcı notunu okuyun: alım-satım sinyallerini kopyalama, freelancerlar tarafından geliştirilen özel uygulamalar, ödeme sistemi aracılığıyla otomatik ödemeler ve MQL5 Bulut Ağı.
Alım-satım fırsatlarını kaçırıyorsunuz:
- Ücretsiz alım-satım uygulamaları
- İşlem kopyalama için 8.000'den fazla sinyal
- Finansal piyasaları keşfetmek için ekonomik haberler
Kayıt
Giriş yap
Gizlilik ve Veri Koruma Politikasını ve MQL5.com Kullanım Şartlarını kabul edersiniz
Hesabınız yoksa, lütfen kaydolun
MQL5.com web sitesine giriş yapmak için çerezlerin kullanımına izin vermelisiniz.
Lütfen tarayıcınızda gerekli ayarı etkinleştirin, aksi takdirde giriş yapamazsınız.