YouTube'dan Mağaza ile ilgili eğitici videoları izleyin
Bir alım-satım robotu veya gösterge nasıl satın alınır?
Uzman Danışmanınızı
sanal sunucuda çalıştırın
sanal sunucuda çalıştırın
Satın almadan önce göstergeyi/alım-satım robotunu test edin
Mağazada kazanç sağlamak ister misiniz?
Satış için bir ürün nasıl sunulur?
MetaTrader 4 için yeni teknik göstergeler - 26
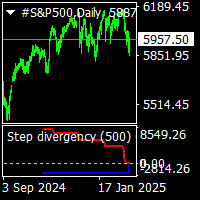
step divergency indicator is a buy sell divergency indicator.include sinus wave indicator. it work all timeframes and all pairs. red line gives step divergency sell formations. blue line gives step divergency buy formations. suitable for experienced and beginners. when prices is moving up and red lines step down ..this is sell divergecy formation and if prices moving down but blue line moving step up this is buy divergency formation. increased cnt value show more back side. gold line is sinus w
The "Volume POC WVAP" Indicator is a revolutionary tool for traders seeking in-depth analysis across various financial markets. This unique indicator, based on tick volumes in the MT4 terminal, provides indispensable information for making informed trading decisions in the following markets: Forex, binary options, cryptocurrency, spot, futures, and indices. Key Features: WVAP Line: Weighted Volume Average Price: The WVAP calculates the weighted volume average price on the selected timeframe, all

Bitcoin Trader Pro Indicator is an advanced tool specifically designed for analyzing the cryptocurrency market, with a focus on BTCUSD. This indicator combines multiple technical analysis methods to generate precise and reliable trading signals. Perfect for both beginner and experienced traders, the Bitcoin Trader Pro Indicator provides everything you need to make informed trading decisions. My indicators for free. I only ask that leave your feedback to help me improve them or as a thank you. H
FREE

free only until the end of the week
The following indicator must be used and contextualized according to your trading methodologies. It provides excellent trading insights and identifies rejection zones on the drawn lines. Several parameters can be customized. The indicator will plot three levels above and below the opening price on D1, W1, and MN1. It will provide the daily ADR and display two additional daily sessions (EUROPE session and USA session). The colors of the various lines can be cu
FREE
This MT4-exclusive indicator highlights Wide Range Bars (WRBs) directly on your chart, this indicator focuses on helping traders identify significant price movements and volatility shifts. Customizable settings allow users to adjust sensitivity, colors, and bar criteria.
Exclusive for members of my community. Any any assistance with the indicator DM me on discord.
FREE

• Please test the product in the Strategy Tester before purchasing to understand how it works.
• If you face any issues, contact me via private message—I’m always available to help.
• After purchase, send me a screenshot of your order to receive a FREE EA as a gift.
Aroon Cross Signal Indicator - Trading Companion V1.21 Important Note: This indicator is provided as a raw trading tool designed for traders who enjoy customization and optimization. It is NOT a plug-and-play solution and requi

It is the main indicator of Turtle Trading Strategy. It provides an excellent advantage for following the trend. It gives a signal to enter the transaction in channel breaks. A sell position is opened when the 20-period lower channel breaks, and a buy position is opened when the upper channel breaks. 2 ATR should be used as the stoploss level. The R-R ratio should be at least 1/2. You can reach the maximum profit opportunity by following the 10-period middle level. Recommended INPUT: 20 Period
FREE

Secret Liquidity Zones Indicator User Manual Introduction Unlock the power of hidden market opportunities with the Secret Liquidity Zones Indicator . This cutting‐edge tool is designed to reveal critical price levels where market momentum may shift. With its dynamic adaptability and sleek gold visuals, it offers clear and elegant insights into key trading opportunities—making it the perfect secret weapon for traders who demand precision and clarity. Key Features Dynamic Timeframe Adaptation:
A

A powerful indicator for precise market analysis, according to the Smart Money Concepts methodology. Determines key liquidity levels, supply and demand zones. Unusual coloring of candles, as well as levels. Smartmoney has repeatedly won first places in various competitions. Multi-timeframe is suitable for both forex pairs and metals and cryptocurrency.

Market maker aracı. Meravith şunları yapar: Tüm zaman dilimlerini analiz eder ve geçerli trendi gösterir.
Alış ve satış hacimlerinin eşit olduğu likidite bölgelerini (hacim dengesi) vurgular.
Farklı zaman dilimlerinden tüm likidite seviyelerini doğrudan grafiğinizde gösterir.
Referansınız için metin tabanlı piyasa analizi üretir ve sunar.
Mevcut trende göre hedefler, destek seviyeleri ve stop-loss noktalarını hesaplar.
İşlemleriniz için risk/ödül oranını hesaplar.
Hesap bakiyenize göre pozisyon

Binary Smart Eye , ikili opsiyonlar ve Forex piyasaları için geliştirilmiş profesyonel bir MT4 göstergesidir. M1’den W1’e kadar tüm zaman dilimlerinde çalışır ve dinamik trend seviyeleri, uyarlanabilir akıllı hareketli ortalama ve optimize edilmiş işlem dönemlerini birleştiren özel bir akıllı işlem mantığına sahiptir. Sabit ayarlara sahip klasik göstergelerin aksine, Binary Smart Eye piyasa koşullarına gerçek zamanlı olarak uyum sağlar, gürültüyü filtreler ve yalnızca anlamlı fiyat hareketlerine

Gann teorisine dayalı düzeltme bölgelerinin manuel olarak oluşturulmasına yönelik gösterge. M1'den başlayıp D1'e kadar olan farklı zaman dilimleri için özel katsayılar kullanılarak matematiksel hesaplamalarla bölgeler belirlenir. Gösterge, döviz çiftleri ve metallerin yanı sıra kripto paralar ve hatta hisse senetleriyle de çalışır
Bu indikatör ile piyasa döngüsüne bağlı olarak alım/satımlar için destek bölgelerini kolaylıkla oluşturabilir, bu bölgelere yaklaştığınızda işlem kararları alabilirs
Trend Korelasyon Gücü (TCS) Göstergesi: Forex Trend Analizinde Avantajınız Trend Korelasyon Gücü (TCS) Göstergesi , trend gücünü ölçme şeklinizi yeniden tanımlayan, Ortalama Yön Endeksi (ADX) gibi geleneksel göstergelere göre önemli bir avantaj sunan son teknoloji bir araçtır. Yönlü harekete dayanan ADX'in aksine, TCS, kapanış fiyatları ile doğrusal bir zaman serisi arasındaki korelasyonu hesaplayarak trend gücünü benzersiz bir şekilde nicelendirir. Bu yenilikçi yaklaşım, forex yatırımcılarına g
FREE
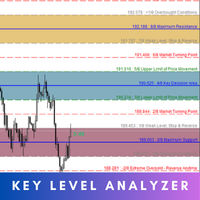
Key Level Analyzer – Know Better, Trade Smarter Key Level Analyzer is a powerful trading tool designed to provide precise market insights by identifying high-probability price zones , market turning points , and key decision areas . Unlike traditional indicators, it uses a smart algorithm to dynamically calculate support, resistance, and balance zones, helping traders make informed, data-driven decisions . MT5 Version - https://www.mql5.com/en/market/product/132810/ With real-time updates, mul

Intraday Pulse – Indicatore per il Prezzo Medio Intraday Intraday Pulse è un indicatore progettato per determinare il prezzo medio intraday alla chiusura giornaliera del grafico. Grazie al suo algoritmo avanzato, traccia automaticamente il livello di riferimento, fornendo un supporto essenziale per strategie di trading efficaci. Nota bene: il grafico giornaliero e' ideale per utilizzare l'indicatore (D1). Aggiorna il time frame alla fine della sessione giornaliera.
L'indicatore è versatile e ut
FREE
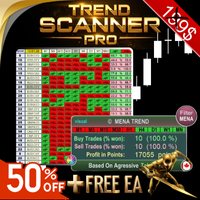
Trend Scanner PRO First of all, it’s worth emphasizing that this trading system is 100% Non-Repainting, Non-Redrawing, and Non-Lagging ,
which makes it ideal for both manual and algorithmic trading setups. Online course, user manual, and downloadable presets included. The Trend Scanner Dashboard is a professional multi pair scanner that analyzes multiple symbols and timeframes at once, giving you an instant market scanner view of the real trend direction. Instead of switching ch
VWAP (Value Weighted Average Price) is an indicator of market makers and banks. It is used by professional traders for intraday, weekly and long-term trading. If you are not familiar with it yet, it is high time to figure it out. How does VWAP work? VWAP shows the volume-weighted average price over a certain period. Its calculation takes into account both the price change and the volume of transactions in each candle. Candles with a higher volume have a greater impact, which increases the ac

L'indicatore Trend Reversal è uno strumento tecnico progettato per identificare potenziali inversioni di trend sul mercato, basandosi sulla formazione di Pin Bar . È particolarmente efficace su time frame come H1 (orario) , dove i pattern di inversione tendono a essere più affidabili. L'indicatore segnala le inversioni di trend disegnando un pallino rosso per indicare un potenziale trend ribassista e un pallino verde per un potenziale trend rialzista. Come Funziona l'Indicatore L
FREE
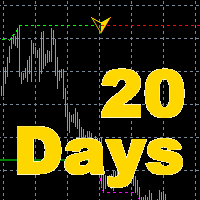
The indicator is the main part of Michael Huddleston's ICT (Inner Circle Trader) trading strategy. His legendary trading strategy is based on the concept of "Smart Money". To analyze the medium -term trend , the ICT offers an analysis based on twenty -day levels . The indicator builds levels , while showing the turning points with arrows . An important feature of the indicator is the automatic display of levels for different periods . You do not have to change the indicator settings when chang

This is a mini One pair version of Advanced Detector of Trend Reversal and Continuance known as TrueTrendStarM(TTSm25). It is a sensitive and Predictive indicator of Price Trends for Professional traders. ( ATTENTION BUYERS:-Now the indicator is available for UNLIMITED TIME ONE TIME buy of just $500 ). Avail the Opportunity. It detects high odds changes in Price Trend direction long before other indicator detects it. I have been working on it since 2019. This is possible due to fractal

Wavetrend Oscillator Indicator — Version 1.0 The Wavetrend Oscillator is a momentum-based technical analysis tool. It is designed to highlight potential momentum shifts, areas that may be overbought or oversold, and the prevailing bias when confirmed by a higher timeframe filter. How it works WT1 and WT2 Lines : Crossovers between these lines are used to indicate changes in momentum. WT1 crossing above WT2 suggests bullish conditions. WT1 crossing below WT2 suggests bearish conditions. WT3 High
FREE

Smart Key Levels Indicator for MT4 - Advanced Support & Resistance Tool The Smart Key Levels Indicator is a professional-grade tool for traders seeking precise support and resistance levels. Using advanced algorithms, it identifies key price levels with dynamic strength scoring, volume filtering, and higher timeframe confluence. Perfect for all trading styles and timeframes, this indicator provides clear visual signals with customizable settings. Available for both MT4 and MT5 platforms. Unl

Smart Set up leve l is a very powerful indicator based on the concept of order blocks and set up entries with proper fvg and breakouts to make a very nice level to enter like a pro trader. Very easy to use interface and friendly to enter on buy and sell signals. Works Best on M15 Time frame on Gold, Bitcoin and Fx pairs. Daily 4-5 trades on each pair Works great on gold like a pro on M15 It is non repainting nor lagging It is very powerful indicator giving precise entries and prop acts can be c

Overview: The Candle Pattern Weekly RSI is a powerful MT4 indicator designed to detect high-probability trade setups on the 1h -timeframe chart while aligning with the weekly trend . It filters signals using a unique three-candle pattern and other Pri ce actions , a minimum price move from the weekly open , and RSI confirmation to enhance accuracy and reduce false signals. Key Features: Weekly Trend Confirmation: Only takes buy trades when the Weekly candle is bullish and sell trades when i
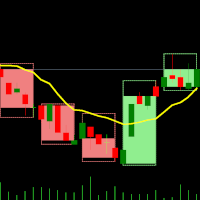
MT4 için Çift Zaman Dilimli Gösterge – Mumlar İçinde Mumlar Genel Bakış Mumlar İçinde Mumlar Gösterge, MT4 için özel olarak geliştirilmiş çok zaman dilimli bir görselleştirme aracıdır. Düşük zaman dilimli grafiğinizin üzerine, daha yüksek zaman dilimindeki mumları bindirerek, küçük mumların büyük mumlar içinde nasıl hareket ettiğini görmenizi sağlar. Bu yaklaşım, piyasa yapısını analiz etmeyi geliştirir, trend belirlemeyi güçlendirir ve fiyat hareketlerini netleştirir – grafikler arasında geçiş
FREE
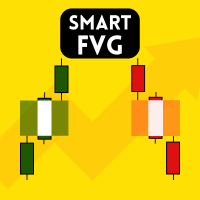
Smart FVG Indicator MT4 – MetaTrader 4 için Gelişmiş Fair Value Gap Tespiti Smart FVG Indicator MT4, MetaTrader 4 grafikleri üzerinde Fair Value Gap (FVG) alanlarını profesyonel düzeyde tespit eder, izler ve uyarılar üretir. ATR tabanlı filtreleme ile piyasa yapısını dikkate alan akıllı bir algoritmayı birleştirerek gürültüyü azaltır, likiditeye uyum sağlar ve sadece en önemli dengesizlikleri bırakarak daha net işlem kararları almanıza yardımcı olur.
Başlıca avantajlar Doğru FVG tespiti: Sadec
FREE

Grafikleri yapılandıran ve döngüsel fiyat hareketlerini belirleyen teknik bir gösterge.
Herhangi bir grafik üzerinde çalışabilirim.
Birkaç çeşit bildirim var.
Grafiğin kendisinde ek oklar var.
Tarihe yeniden bakmadan, mumun kapanışına dair çalışmalar.
M5 ve üzeri TF önerilir.
Kullanımı ve yapılandırması kolay parametreler.
Farklı parametrelere sahip 2 indikatörü kullanırken, bunları diğer indikatörler olmadan da kullanabilirsiniz.
2 giriş parametresi vardır
Döngüsellik ve Sinyal Süresi
Bu 2 pa

"Auto FIBO Pro" Crypto_Forex göstergesi - ticarette harika bir yardımcı araçtır!
- Gösterge, Fibo seviyelerini ve yerel trend çizgilerini (kırmızı renk) otomatik olarak hesaplar ve grafikte yerleştirir. - Fibonacci seviyeleri, fiyatın tersine dönebileceği önemli alanları gösterir. - En önemli seviyeler %23,6, %38,2, %50 ve %61,8'dir. - Ters scalping veya bölge ızgara ticareti için kullanabilirsiniz. - Auto FIBO Pro göstergesini kullanarak mevcut sisteminizi geliştirmek için birçok fırsat vardı
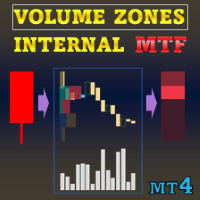
Özel fırsat : ALL TOOLS , her biri sadece $35 ! New tools will be $30 for the first week or the first 3 purchases ! Trading Tools Channel on MQL5 : Join my MQL5 channel to update the latest news from me Volume Zones Internal Visualizer Multi-Timeframe – Daha yüksek zaman dilimi grafiğinde işlem yaparken, daha düşük zaman dilimlerindeki hacim hareketlerini detaylı şekilde görüntülemenizi sağlayan en üst düzey çözüm. Çok zaman dilimli (multi-timeframe) özelliğini destekleyen, güçlü v

Quantum Entry is a powerful price action trading system built on one of the most popular and widely known strategies among traders: the Breakout Strategy! This indicator produces crystal clear buy and sell signals based on breakouts of key support and resistance zones. Unlike typical breakout indicators, it uses advanced calculations to accurately confirm the breakout! When a breakout occurs, you receive instant alerts. No lag and no repaint : All signals are delivered in real-time, with no lag
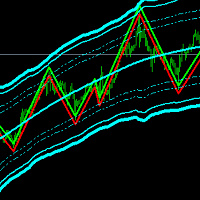
Channel Trend Bands – A Comprehensive Indicator for Market Analysis MetaTrader 5 Version
Simple to Use, Effective in Application User-Friendly and Suitable for All Traders This indicator stands out due to its straightforward functionality. Whether you're a beginner exploring the market or an experienced trader refining your strategy, this tool offers valuable insights. Using a Triangular Moving Average (TMA) with additional ATR-based bands , it provides structured market data to support well-i

I prepared an indicator Showing BUY and SELL probability by checking Higher Time Frames... It’s quick, easy to read, and free. Enjoy, and let me know how it boosts your trading! By tweaking the timeframe weightings , smoothing , and support/resistance influence , you can adapt the indicator’s Buy/Sell probabilities to your personal trading style. Keep an eye on both the on-chart labels and subwindow histogram to quickly see when the bias shifts, then combine this with your own trading rules for
FREE
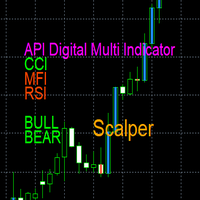
API Digital Multi Indicator Scalper – Clear Digital Display API Digital Multi Indicator Scalper , a tool that integrates RSI, MFI, CCI, Bulls and Bears into a digital display for market analysis . This indicator is designed for scalpers and short-term traders who demand clear data . Key Features: Digital Display – Monitor RSI, MFI, CCI, Bulls and Bears values in an easy-to-read digital format.
Color Changes – Visual cues help identify possible trend changes at a glance.
Adjustable

SuperTrend Starter - Yes Trading (over 100 Downloads in 10 days)
The SuperTrend Starter - Yes Trading indicator is a powerful, user-friendly tool designed to simplify market trend detection and provide clear trading signals. By combining the Commodity Channel Index (CCI) with a Moving Average (MA) filter, this indicator helps traders make informed decisions with precision and confidence. Key Features & Benefits Trend Detection: Easily identifies uptrends (price above the SuperTrend) and dow
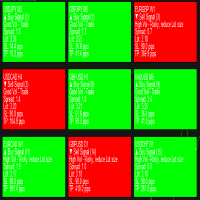
Introducing Telos Dashboard Indicator – Your Ultimate Trading Companion Optimized For Forex!
Note: This is a dashboard indicator and won't work on the strategy tester, demoing it there is a waste. Instead get the main indicator or, use the demo of DynamicCOG to see how it works with arrows, although Telos is a more refined and filtered version than the DynamicCOG indicator. Never Miss a Trading Opportunity Again!
Welcome to the future of trading with the Telos Dashboard Indicator ! Inspired b

The Hodrick-Prescott filter is a well known filtering algorithm Perfect for offline jobs it lacks realtime capabilities that are necessary in trading This is a first time a causal Hodrick-Prescott filter has been made
I was able to successfully make a causal (realtime) version of the Hodrick-Prescott algorithm which keeps the lag to a minimum as you can see on the screenshots, it is really responsive to sharp changes while retaining a high smoothing ability, making it one of the best smoothers

Trend NonLag Indicator is a professional and easy to use Forex, Crypto and CFDs trading system which is based on the best principles of trading using the Swing High and Swing Low and Price Action strategy. The indicator provides accurate BUY and SELL signals. You can trade even on the go using PUSH notifications. Probably you already heard about the Swing High and Swing Low trading methods before. Usually the Swing High/Low is a very complex thing not only for newbie traders but also for th

ORDER BLOCKS REVERSAL
Reversal Trading involves identifying points where an asset's price direction changes, capitalizing on potential profits from such shifts. Spotting reversals requires analyzing price patterns and volume indicators.
Key indicators include moving averages, RSI, and MACD, which help traders predict potential trend shifts. This indicator show us potential reversal points using ORDER BLOCKS.
While Reversal Trading offers potentially high reward opportunities by entering earl
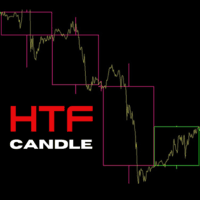
ICT Traders! Here's another cool Indicator that will allow to trade the HTF narrative while focus on price action on your entry timeframes. The following are the input for setup the indicator: Maximum Bar: The number of HTF bar you want to display Bullish Candle: The color of the bullish candle Bearish Candle: The color of the bearish candle Border Width: the width of the HTF candle drawn on the chart.
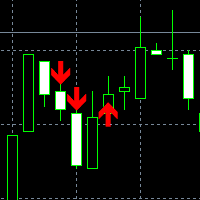
This is Binary option indicator mt4 for one candle expiry, also can be used for forex Higher Timeframes like H4,D1,W1, it is very accurate no lags no repaints, before you purchase you can ask me any question you may recon with feel free to contact me, Indicator Buffers are 0 for buy and 1 for sell, it Draws arows immidiate;
Alerts has been included; Push Notification has been included;

Индикатор "INFO Spread Swaзp Info Panel" для MT4, вспомогательный инструмент для торговли.
- Индикатор показывает текущий спред и свопы валютной пары, к которой он прикреплен. Также идикатор показывает: 1. Дату и время сервера 2. Название сервера 3. Название влютной пары. 4. Спред 5. Своп 6. Открытые позиции 7. Отложенные ордера 8. Максимальная просадка после открытия индикатора 9. 30% от депозита. (можно менять) Можно менять положение, размер, цвет шрифта, расстояние между строками.
FREE

Indicador de Fibonacci Semanal para MT4 Maximize suas operações no mercado financeiro com o Indicador de Fibonacci Semanal para MetaTrader 4 (MT4) , a ferramenta essencial para traders que buscam identificar pontos estratégicos de suporte e resistência com base na ação do preço da última semana. Principais Recursos: Atualização Automática : O indicador recalcula os níveis de Fibonacci automaticamente a cada novo candle semanal. Níveis Personalizados : Traça apenas os níveis essenciais de Fibonac

MamchenkoTrend Complex - высокоточный индикатор, показывающий смену тенденций на рынке. Индикатор не перерисовывает сигнал после закрытия свечи. Дает вам уровень стопа для вашей сделки по его сигналам. Отлично подходит для ручной торговли и в разработке в АТС (автоматические торговые системы) Настройки можно использовать по умолчанию , а также подбирать самостоятельно . На скриншотах изображен один и тот же участок графика пары GBPUSD на тайме Н4 но с разными настройками . На первом рисунке зн
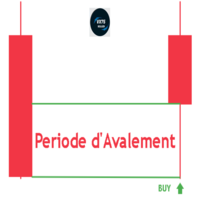
Engulfing Period V75Killed (MT4) – Piyasadaki Dönüş Noktalarını Doğru Şekilde Belirleyin! (Bu gösterge ÖZELDİR ve yalnızca değerini bilen yatırımcılar için tasarlanmıştır.) Engulfing Period V75Killed , MetaTrader 4 için geliştirilmiş güçlü bir göstergedir. Boğa (Bullish) ve Ayı (Bearish) Engulfing formasyonlarını otomatik olarak tespit ederek, en önemli fiyat dönüş bölgelerini grafik üzerinde doğrudan işaretler. Bu sayede yüksek olasılıklı işlem fırsatlarını hızlı ve kolay bir şekilde yakalayabi
FREE
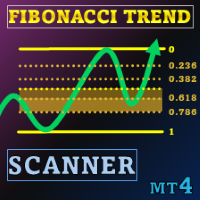
Özel Fırsat : ALL TOOLS , her biri sadece $35 ! New tools will be $30 for the first week or the first 3 purchases ! Trading Tools Channel on MQL5 : Join my MQL5 channel to update the latest news from me Volatil bir işlem ortamında, güçlü ve sezgisel bir analiz aracı fırsatları hızla yakalamanıza yardımcı olabilir. Fibonacci Trend Scanner, sadece geleneksel Fibonacci indikatörü ve SuperTrend işlevlerini bir araya getirmekle kalmaz, aynı zamanda para birimi taraması, çoklu zaman dili

TW Trend Scalper Indicator:
The TW Scalper Shoot, en son ticaret stratejilerini ve yapay zeka teknolojisini kullanarak size benzersiz bir ticaret deneyimi sunar. Bu ürün, iki farklı sinyal kategorisi sağlayarak skaler tüccarların çeşitli ihtiyaçlarını karşılamaktadır:
Bu olağanüstü ürünü bugün test edin ve bir trend skaler olma yolunda benzersiz deneyiminize başlayın.
Sinyal Kategorileri:
1. Uzun vadeli ve Güvenli Sinyaller: Bu sinyaller, fiyat hareketi stratejileri (akıllı para kuralları),
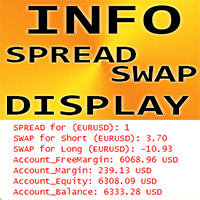
MT4 için Forex Göstergesi "INFO Spread Swap Ekranı", Ticaret Yardımcı Aracı.
- INFO Spread Swap Ekranı göstergesi, eklendiği forex çiftinin mevcut Spread'ini ve Swap'larını gösterir. - Ayrıca hesap Bakiyesini, Sermayeyi ve Marjları gösterir. - Gösterge değerlerini grafiğin herhangi bir köşesinde bulmak mümkündür: 0 - sol üst köşe, 1 - sağ üst, 2 - sol alt, 3 - sağ alt. - Renk ve yazı tipi boyutunu ayarlamak da mümkündür.
// Harika Ticaret Robotları ve Göstergeleri burada mevcuttur: https://ww

API TicksVolume mtf - Volume Analysis for Trading The API TicksVolume mtf indicator is a tool for traders who want tick volume analysis to make trading decisions. Designed for MetaTrader 4 , this multi-timeframe (MTF) indicator provides tick volume data with color-coded visual cues , helping traders assess volume strength and possible volume direction across different timeframes. Key Features: Multi-Timeframe Analysis: Monitor tick volume from different timeframes in real time for a broader
Ultimate Volatility Insight is a highly professional tool for analyzing and fully understanding market activity based on an advanced ATR with improved algorithms and calculation formulas. The indicator helps traders accurately assess market dynamics, identify key support and resistance levels, and effectively manage risks. Ultimate Volatility Insight works only with real data using live statistics. The indicator has been developed for over two years, and its effectiveness has been proven through
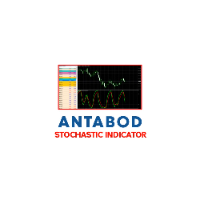
How Antabod Stochastic Works Antabod Stochastic is a cutting-edge technical indicator designed to analyze market momentum and identify overbought and oversold conditions with unparalleled precision. Here's a breakdown of how it works and what makes it a game-changer for traders: ________________________________________ 1. Core Concept At its heart, Antabod Stochastic is based on the stochastic oscillator principle, which measures the position of a current price relative to its range over a spec
MTF Candles Overlay - Professional Multi-Timeframe Analysis Tool (Now with Yearly Y1 timeframe!) The MTF Candles Overlay is a powerful and visually intuitive indicator that allows traders to view candles from higher timeframes directly overlaid on their current chart. This eliminates the need to constantly switch between multiple timeframe charts, enabling faster analysis and better trading decisions. Key Features Complete Timeframe Coverage All Standard Timeframes : M1, M2, M3, M4, M5,
In trading, it is important to trade at the right time, which is why it is advantageous to use this indicator to display the opening of the foreign exchange markets. Define your personal trading times by setting these times with an adjustable background color. You can switch this indicator on and off using a button on the chart. This indicator is part of the OH strategy; you can view other indicators of this strategy by clicking on my name as a seller.
Two modified triangular MA as upper and lower bands that show the trend by changing color. If both MAs show the same color, a confirmed trend is present. The indicator can be switched on and off using a button on the chart. This indicator is part of the OH strategy. You can view other indicators of this strategy if you click on my name as a seller.
Take a look to my other indicator....
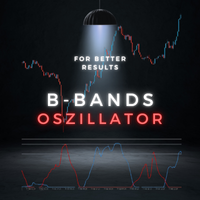
An indicator based on the Bollinger Bands principle, modified by scaled calculation of standard deviations and combined into oscillator bands make this indicator special. An up and down trend is displayed clearly and concisely and, in addition, the integrated levels 70 and 90 show the possible end of the trend or the possibility of consolidation. This indicator is part of the OH strategy. You can view other indicators of this strategy if you click on my name as a seller.
Advanced Detector of Trend Reversal and Continuance known as TrueTrendStar(TTS) is a sensitive and Predictive indicator of Price Trends for Professional traders. ( ATTENTION BUYERS:-PLEASE CONTACT ME FOR HOW BEST TO USE THE INDICATOR FOR MAXIMUM PROFITS )
This indicator detects advanced signals of high odds changes in Price Trend direction long before other indicator detects it. I have been working on it since 2019. This is possible due to fractal nature of forex and other financial ma

Arrow Indicator for Fast Scalping
Determines the direction of movement on almost every candle.
Allows timely opening of positions in accordance with changing market conditions.
Works on all timeframes, all currency pairs, metals, indices, and cryptocurrencies.
Can be used when trading binary options.
Key Features: No settings required; Accurately determines the direction of movement; Does not repaint after the candle closes; Works on all timeframes and all trading instruments; Suitable for

*Antabod GameChanger Indicator – Transform Your Trading!*
Are you tired of chasing trends too late or second-guessing your trades? The *Antabod GameChanger Indicator* is here to *revolutionize your trading strategy* and give you the edge you need in the markets! Why Choose GameChanger?
*Accurate Trend Detection* – GameChanger identifies trend reversals with *pinpoint accuracy*, ensuring you enter and exit trades at the optimal time.
*Clear Buy & Sell Signals* – No more guesswork! T
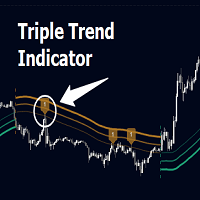
Triple Trend Indicator is a versatile trend-following tool designed to help traders identify trend strength and potential pullback levels using a three-band system. Each band represents a varying degree of price deviation from the mean, providing progressively stronger trend signals.
Key Features:
Three Adaptive Bands:
The indicator dynamically calculates three bands (1, 2, and 3) based on moving averages (SMA, EMA, WMA) and ATR multipliers.
Bands are positioned below the price in a

Fair Value Gap (FVG) Indicator with Clear Trendlines Identify Fair Value Gaps (FVGs) like a pro! This powerful MQL4 indicator marks Bullish and Bearish FVGs with clear, precise trendlines , giving you a visual edge in spotting high-probability trading opportunities. Key Features: Two Trendlines per FVG : Clearly marks the top and bottom of each FVG zone for easy identification. No Rays : Trendlines are clean and concise, ensuring a clutter-free chart. Customizable Colors : Personal

FVG & iFVG Alert indicator for MT4
- it is coded to detect freshest untouched FVG, both bullish and bearish, it draws lines for the FVG making it clear - when price reaches these levels it will alert upon candle close that price is potentially breaking this FVG or retesting it - price might hold and will then be FVG or it might inverse and become an iFVG - good for alerting you when to look at chart, then execute depending on trading system

Easy Trade Indicator – Your Path to Profitable Trades! Work any Time Frame! Maximize your profits with precise and assertive trades!
️ Trade with comfort – the indicator does the analysis and you only open the order in the direction in which the indicator shows you!
Exclusive panel with past trade counter and accuracy tracking! Simplify your analysis, boost your performance, and trade with confidence! Get it now and take your trading to the next level

ICT Killzone Indicator – Master the Market’s Key Trading Sessions Unlock the true potential of Institutional Order Flow with the ICT Killzone Indicator , designed for serious traders who follow Inner Circle Trader (ICT) concepts. This tool highlights the most critical trading periods—the Asia, London, and New York Killzones —allowing you to align your trades with high-probability setups used by smart money traders. Key Features: Automated Killzone Markings – The indicator dynamically plots th
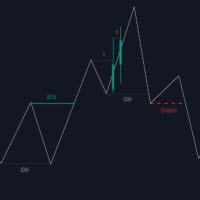
The Market Structure with Inducements & Sweeps indicator is a unique take on Smart Money Concepts related market structure labels that aims to give traders a more precise interpretation considering various factors.
Compared to traditional market structure scripts that include Change of Character (CHoCH) & Break of Structures (BOS) -- this script also includes the detection of Inducements (IDM) & Sweeps which are major components of determining other structures labeled on the chart.
SMC & pri
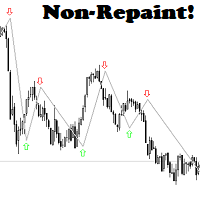
Scalper like a PRO! Trade like a PRO! Easy to use! Your profit and consistency is here! All TF and all Pairs! Just place it on the chart, select the chart and active time of your choice and follow the signals! Trade with comfort – the indicator does the analysis and you only open the order in the direction in which the indicator shows you!
finally start taking money from the market!

This indicator looks at daily, weekly, and monthly data and tells you how often those levels get "tested" or touched. In other words, you can see how reliable a particular level has been historically and whether the price is likely to visit it. Easy Customization:
You can tweak the number of days, weeks, or months the indicator checks, as well as adjust the tolerance for what counts as a “touch.” Plus, you can easily turn the pivot lines or the labels on and off to keep your chart as busy—or as

Presenting UMS Scanner – Your Ultimate Edge in the MT4 Marketplace! Unlock the secrets of the market with the ground-breaking UMS Scanner (Universal Market Strategy) – a revolutionary tool designed to empower traders like you. Say goodbye to overwhelming market noise and hello to precision, insight, and unparalleled trading confidence. Cut Through the Clutter:
In today’s fast-paced trading world, deciphering valuable signals from market noise is the key to success. The UMS Scanner’s cutting-ed

Daha Akıllı Destek ve Direnç Göstergesi Daha Akıllı Destek ve Direnç Göstergesi, teknik analizini geliştirmek için tasarlanmış bir araçtır. Birden çok zaman diliminde anahtar destek ve direnç seviyelerini otomatik olarak tanımlayarak, yatırımcıların daha bilinçli kararlar almasına yardımcı olur. Bu araç, belirli bir geri alma dönemi boyunca en çok test edilen seviyelere dayalı olarak en yüksek ve en düşük fiyat noktalarını verimli bir şekilde hesaplar, ardından bu seviyelerin ortalamasını alarak
SMC OrderBlock Auto MT4, Smart Money Concepts (SMC) temelli gelişmiş bir alım-satım göstergesidir ve MetaTrader 4 platformu için özel olarak tasarlanmıştır. Bu gösterge, büyük kurumsal yatırımcıların giriş ve çıkış noktalarını doğru bir şekilde belirlemenize yardımcı olur. Fiyat hareketlerindeki önemli modelleri, örneğin Emir Blokları (Order Blocks), yüksek ve düşük noktaları (stop likiditesi: BSL, SSL) farklı zaman dilimlerinde tanıyarak işlem başarı oranını ve kârlılık potansiyelini artırır. A
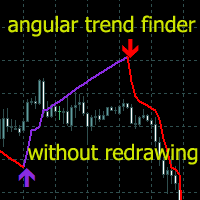
Trend göstergeleri, finansal piyasalarda işlem yaparken kullanılan teknik analiz alanlarından biridir.
Angular Trend Lines indikatörü - trend yönünü kapsamlı bir şekilde belirler ve giriş sinyalleri üretir. Mumların ortalama yönünü yumuşatmanın yanı sıra
Trend çizgilerinin eğim açısından da yararlanılır. Eğim açısının hesaplanmasında Gann açılarının inşa ilkesi esas alındı.
Teknik analiz göstergesi mum çubuğu yumuşatması ile grafik geometrisini birleştirir.
İki tür trend çizgisi ve ok vardır: K

Smarter Trend Channel Göstergesi Açıklama:
Smarter Trend Channel göstergesi, trader’ların piyasa trendlerini dinamik bir şekilde destek ve direnç çizgileri çizerek görsel olarak belirlemelerine yardımcı olmak için tasarlanmış güçlü ve esnek bir araçtır. Gelişmiş fraktal hesaplamalar kullanarak, gösterge piyasa koşullarına göre trend çizgilerini otomatik olarak ayarlar, böylece trader’lar kırılma noktalarını ve potansiyel dönüş noktalarını kolayca tespit edebilirler. Öne Çıkan Özellikler: Kanal
FREE
MetaTrader mağazasının neden alım-satım stratejileri ve teknik göstergeler satmak için en iyi platform olduğunu biliyor musunuz? Reklam veya yazılım korumasına gerek yok, ödeme sorunları yok. Her şey MetaTrader mağazasında sağlanmaktadır.
Alım-satım fırsatlarını kaçırıyorsunuz:
- Ücretsiz alım-satım uygulamaları
- İşlem kopyalama için 8.000'den fazla sinyal
- Finansal piyasaları keşfetmek için ekonomik haberler
Kayıt
Giriş yap
Gizlilik ve Veri Koruma Politikasını ve MQL5.com Kullanım Şartlarını kabul edersiniz
Hesabınız yoksa, lütfen kaydolun
MQL5.com web sitesine giriş yapmak için çerezlerin kullanımına izin vermelisiniz.
Lütfen tarayıcınızda gerekli ayarı etkinleştirin, aksi takdirde giriş yapamazsınız.