YouTubeにあるマーケットチュートリアルビデオをご覧ください
ロボットや指標を購入する
仮想ホスティングで
EAを実行
EAを実行
ロボットや指標を購入前にテストする
マーケットで収入を得る
販売のためにプロダクトをプレゼンテーションする方法
MetaTrader 4のための新しいテクニカル指標 - 26
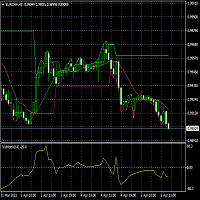
Background : Indicator On Chart based on my own oscillator ACe_Vector2016. As you can appreciate, this indicator draws two bands on the chart in order to identify long and short opportunities. When the momentum vector oscillator (ACe_Vector2016) crosses the zero line, the indicator On Chart draws a long/short signal (green/red arrow). Also you can identify the trend line on chart (MA): green colour if trend is moving up, and red colour if trend is moving down. This indicator draw up and down non
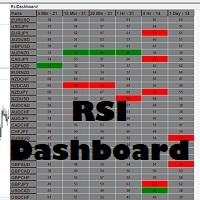
Never miss when a pair is being oversold or overbought again!! This RSI dashboard allows you to monitor RSI levels on 6 different time frames for up to 30 different currency pairs. This dashboard is packed with features including: 1. Monitoring of 6 customizable time frames (M1, M5, M15, M30, H1, H4, D1, W1, M1) 2. You can set the overbought/oversold levels you want for EACH time frame and they will be highlighted in the dashboard when a pair gets to that level
3. You can also set the RSI perio

This Indicator is use the ZigZag to calculate the Upper and Lower Bound and the uptrend and the downtrned. Red for downtrend, Green for uptrend and Yellow is for the horizontal trend this horizontal trend also bookmarked the upper limited and the lower limited the the price swings. Or in simple the Support and the Resistance level. However, You may use the Heikin Ashi to confirm the trend of the buy sell signal above. I cannot guarantee the win rate, Nevertheless, you must study well the timef

一款非常优秀的对冲策略,根据指标提示的多空顺势开单,指标不延迟,不漂移,不重画,可以单笔对冲,也可以使用马丁对冲,马丁对冲回报会更高 一款非常优秀的对冲策略,根据指标提示的多空顺势开单,指标不延迟,不漂移,不重画,可以单笔对冲,也可以使用马丁对冲,马丁对冲回报会更高 一款非常优秀的对冲策略,根据指标提示的多空顺势开单,指标不延迟,不漂移,不重画,可以单笔对冲,也可以使用马丁对冲,马丁对冲回报会更高 一款非常优秀的对冲策略,根据指标提示的多空顺势开单,指标不延迟,不漂移,不重画,可以单笔对冲,也可以使用马丁对冲,马丁对冲回报会更高 一款非常优秀的对冲策略,根据指标提示的多空顺势开单,指标不延迟,不漂移,不重画,可以单笔对冲,也可以使用马丁对冲,马丁对冲回报会更高

Volatility Trend System - a trading system that gives signals for entries. The volatility system gives linear and point signals in the direction of the trend, as well as signals to exit it, without redrawing and delays.
The trend indicator monitors the direction of the medium-term trend, shows the direction and its change. The signal indicator is based on changes in volatility and shows market entries.
The indicator is equipped with several types of alerts. Can be applied to various trading
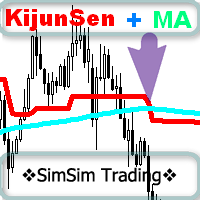
非常にシンプルですが効果的な指標です。
これは、一目インジケーターの KijunSen ラインと、このラインの構築平均 MA に基づいています。 売買シグナル: これは 2 本の線の交点です!!!
私自身、取引には一目指標の基準線をよく使用します。価格が高ければ購入のみを検討し、販売のみが低ければ購入を検討します。
そして、基準線を平均して基準線MAラインを形成した後、2つのラインの交点が現れました。これは、取引のシグナルの増幅として解釈できます。
インジケーターの MT5 バージョンへのリンク:
https://www.mql5.com/ru/market/product/96160
指標パラメータ:
基準線 - 基準線の計算期間。
KijunSen_MA - KijunSen MA の計算期間。
MethodMA - KijunSen MA の価格を計算する方法。
サウンド - 基準線と基準線MAの交差点警報音。
PushMobil - 携帯電話への通知。
エキスパートアドバイザーと通信するための指標バッファ。
バッファ番号で。
Ultimate Harmonic Patterns 認識インジケーターへようこそ Gartley パターン、Bat パターン、および Cypher パターンは、トレーダーが市場の潜在的な反転ポイントを特定するために使用する一般的なテクニカル分析ツールです。
当社の究極の調和パターン認識インジケーターは、高度なアルゴリズムを使用して市場をスキャンし、これらのパターンをリアルタイムで特定する強力なツールです。
当社の究極調和パターン認識インジケーターを使用すると、これらの人気のあるパターンに基づいて潜在的な取引機会を迅速かつ簡単に特定できます。
※購入後、 説明書と手順ガイドをお送りしますのでご連絡ください。
MT5バージョン: Ultimate Harmonic Patterns MT5 このインジケーターは、主要なフィボナッチ リトレースメント レベルとともにチャート上にパターンをプロットするため、潜在的なエントリー ポイントとエグジット ポイントを簡単に特定できます。
当社のインジケーターには幅広いカスタマイズ オプションも含まれており、特定の取引スタイルに合わせ

移動平均プロは、従来の移動平均の改良版であり、その値は特定の異なる方法で計算されます (戦略の無許可のコピーを避けるため、これは機密情報です)。 アイデアは、トレーダーの量によってすでに使用されている従来の移動平均 (単純、指数、平滑化、および線形加重) とは異なるものであり、過剰に使用され、もはや効率的ではなくなります。 移動平均プロは、決められた期間の価格平均を、従来よりも具体的かつ正確かつ効率的に計算するため、より強力になり、金融商品の取引で利益を上げる可能性が高まります。 この強力なツールには、次の利点があります。
-最も利用可能な精度で価格の傾向を予測できます。
-価格レベルを正確にマークするため、市場参入の精度を高めることができます。
-指数関数とフィボナッチ計算を組み合わせたプログレッシブ戦略のおかげで、従来のすべてのものとは異なる独自のインジケーターを持つことができます。
この製品は発売されたばかりなので、最初の 100 回の購入で 50% 割引になり、30 米ドルという手頃な価格で無制限に製品を使用できます。

Welcome to the world of SMC (Smart Money Concepts) Trading, where we empower traders with the tools and knowledge to make smarter trading decisions. Our latest addition to our suite of trading tools is the SMC Trading Pro indicator, version 1.0. Key Features: Major Market Structure Identification with BODY break. Order Block must be in Major Swing ( not Small Swing ). Order Block with Fair Value Gap Detection. Order Block in Discount | Premium zone. Filter for only Bullish, Bearish or All Order
FREE
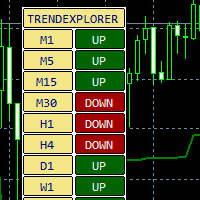
An indicator of the trend direction of a trading instrument on different timeframes. The author's method of calculating the trend is used.
You can enable and disable different timeframes.
Suitable for working with currency pairs, stocks, futures, cryptocurrencies.
Settings:
ATR Multiplier - ATR multiplier; ATR Period - ATR indicator period; ATR Max Bars (Max 10.000) - Number of bars to calculate; Candle shift to Calculate - Report start bar; On/Off Timeframe M1 - Enable differe

M1 GPT Scalping は、金融市場におけるスキャルピング戦略のためのターンキー取引ツールです。 この指標は、M1 (1 分) の期間でチャートのポジションのエントリー ポイントとエグジット ポイントを検出するために使用されます。
M1 GPT Scalping は、価格データの分析とテクニカル分析指標に基づいて機能します。 インジケータは、ポジションからのエントリーとエグジットのポイントを示すチャートに矢印を表示します. インジケーターの精度は 85 ~ 90% です。
M1 GPT Scalper を使用したスキャルピング戦略は、短時間 (数秒から数分) で注文をオープンすることです。 この戦略では、トレーダーは価格の動きに迅速に反応し、ポジションに正確に出入りする必要があります。
インジケーターの使用方法: H1 期間の青い線と M1 期間の赤い線が消え、青い線が表示されたときに、買いの取引を開始します。 赤い線が H1 期間になく、青い線が M1 期間に消え、赤い線が表示される場合、売り取引を開始します。 オプション: Periods - 指標期間

WARNING: PRICE IS SUBJECT TO RISE AT ANY TIME. GET YOUR COPY TODAY TO AVOID MORE COST! Dear Traders I am so glad to introduce to you my other tool called the Forex Sniper Entries Indicator. This tool is designed to help serious traders and investors capture big moves in the currency price movements. The philosophy behind this tool is all about winning big and riding the price movement from its beginning until the maximum point. We want to capture those big moves in both down and up markets as mu

Welcome to the world of SMC (Smart Money Concepts) Trading, where we empower traders with the tools and knowledge to make smarter trading decisions. Our latest addition to our suite of trading tools is the SMC Trading Pro indicator, version 1.0. Key Features: Major Market Structure Identification with BODY break. Order Block must be in Major Swing ( not Small Swing ). Order Block with Fair Value Gap Detection. Order Block in Discount | Premium zone. Filter for only Bullish, Bearish or All Order
The SD Indicator is a powerful tool in the world of Forex trading, that combines two classical strategies: Support/Resistance levels and Supply/Demand zones. The indicator helps traders to identify potential trading opportunities in the market with high accuracy.
Support and resistance levels are key price levels where buying and selling pressure converge, leading to potential price reversals. The SD Indicator identifies these levels in real-time and provides traders with a clear picture of wh

Many traders use The Bull-Bear Indicator, I decided to combine the two into just one, so the visualization is better, and I am sharing it with you. the trading rules remain the same, you can adjust the period as per your preference.
The Bull-Bear Indicator is a free indicator with several versions widely published on the internet, this is just a version that I put together, I hope you like it. If you want to know the indicators of my authorship, please visit my page here .
FREE

"Price reversal arrows" Forex indicator, which shows price reversal points on an hourly chart (PERIOD_H1) with arrows, is one of the most popular tools for traders in the Forex market. This indicator is used to identify the most likely price reversal points, which can help traders make better trading decisions. The "Price reversal arrows" indicator works on the basis of various mathematical algorithms and formulas that analyze data on previous price movements in the market. At the same time, th
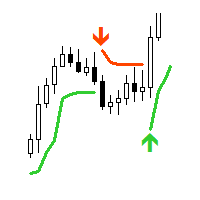
"AV SuperTrend" is an indicator for MetaTrader 4. The supertrend indicator is popular for determining the trend and positioning stops or as trailing support. I use this indicator in several expert advisors for trend analysis.
Supertrend indicator signals can be selected in the form of entry arrows and notifications, as well as various sounds.
Settings :
- Period
- Multiplier
- Alert buy signal: arrow color
- Alert sell signal: arrow color
- Alert yes/no
- Sound: choice or no
-

Binary Options Trading Indicator: A Reliable Tool for Your Trades This indicator is specifically designed for binary options trading and has proven to be a high-quality, reliable, and fairly accurate tool, depending on the chart's dynamics. Key Points: Signal Interpretation: When a blue cross signal appears, it indicates a potential trade entry, although it's considered a weak signal on its own. However, if the blue cross is accompanied by an arrow, it is considered a more reliable signal for b

Short-Term Trading Indicator: The Foundation of Your Successful Strategy This tool is designed for scalping or pip trading in financial markets. It can serve as an excellent starting point for creating your own trading strategy. Key Features: Non-repainting signals: The indicator provides reliable signals that do not change after their appearance. A signal appears on the next candle after the event that triggered it. Excellent signals in high volatility conditions: With good volatility on the ch
The indicator for binary options without repainting is a powerful tool for traders. It ensures signal reliability without altering them after their appearance. Features: Non-repainting signals: The indicator provides stable and reliable signals that do not change after formation. Expiration time: Signals appear at the candlestick opening and expire within one candlestick of the current timeframe. Overlay method: In the event of a losing trade, it is recommended to use the overlay method with an

This outside bar indicator is the opposite of the inside bar. So what this MT4 outside bar indicator does is identifies outside bars for you as they form on your charts. Outside bar is a famous trading pattern in which the bar carry higher high and lower low compared with the previous bar, also known as mother bar. To trade based on Outside Bars, simply place buy stop order above the high price level of a bullish Outside Bar, and sell stop order should be placed below the low price level of a be
FREE

Real Pro Signal indicator is designed for signal trading. This indicator generates trend signals.
It uses many algorithms and indicators to generate this signal. It tries to generate a signal from the points with the highest trend potential.
This indicator is a complete trading product. This indicator does not need any additional indicators.
The indicator certainly does not repaint. The point at which the signal is given does not change.
Features and Suggestions Time Frame: H1 W

Perfect Cross Arrows indicator is designed for signal trading. This indicator generates trend signals.
It uses many algorithms and indicators to generate this signal. It tries to generate a signal from the points with the highest trend potential.
This indicator is a complete trading product. This indicator does not need any additional indicators.
The indicator certainly does not repaint. The point at which the signal is given does not change. Signals are sent at the beginning of new can

O indicador TRIX, conforme o utilizado pelo grafista Didi Aguiar.
Este indicador é composto pela Triple Exponencial Average (TRIX), que neste setup é utilizada com o período 9, e um sinal de média simples do próprio indicador que é utilizado com o período 4.
Parâmetros: Período: 9 Sinal: 4
Os demais indicadores do sistema operacional de Didi Aguiar são:
Bollinger: período 8, desvio 2 ADX: período 8 DidiIndex com médias simples, períodos: 3, 8 e 20 Estocástico: 8, 3 3
FREE

Panelux - информационная панель показывающая актуальную информацию для трейдера, такую как: Номер торгового аккаунта и торговое плечо; Символ, период, последнюю цену, время до закрытия бара и спред; Отдельный блок для мани менеджмента; Данные свопа инструмента; Блок информации о депозите, балансе, профите, позициях, equity и margin; Блок о прибылях и убытках за год, квартал, месяц, неделю и по последним пяти дням. Имеется опция для включения отображения совершенных сделок на графике цены. Что уд
FREE
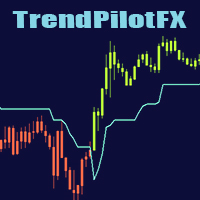
This Mql4 indicator smooths the trend by changing candle colors without altering their size, allowing for better price action reading. It also includes a trend line for trade entry and exit points. Smooth out market trends and improve your price action reading with this powerful Mql4 indicator. Unlike Heikin Ashi, this indicator changes candle colors without altering their size, providing you with a clearer picture of market movements. In addition, it includes a trend line that traders can rely

The product Divergence Macd Obv Rvi Ao Rsi is designed to find the differences between indicators and price. It allows you to open orders or set trends using these differences. The indicator has 4 different divergence features. To View Our Other Products Go to the link: Other Products
Divergence types Class A Divergence Class B Divergence Class C Divergence Hidden Divergence
Product Features and Rec ommendations There are 5 indicators on the indicator Indicators = Macd Obv Rvi Ao Rsi 4 dif

Simple supply and demand indicator which should help identify and visualize S&D zones. Settings:
Color for supply zones, color for demand zones - default colors are set for dark (black) background.
Number of how much zones should be created above and below current price - value "3" means there will be 3 zones above current price and 3 zones below current price. Principle:
When price creates "V", reversal zone is registered. Rectangle filled based on zone type (supply / demand) is drawn if pri
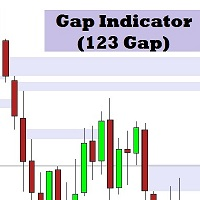
This indicator identifies the gap between the first and third candles in 3 consecutive candles. This area can be used to identify strong areas that the price may return to after a reversal or pullback.
The indicator has 4 user defined settings: 1. Display Distance: This is how many previous candles the indicator will use to identify gaps.
2. BearBarColor: This is the color that will be used for gaps created during a downtrend.
3. BullBarColor: This is the color that will be used for gaps cre
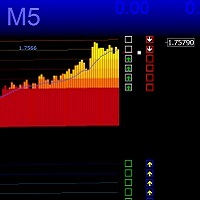
Канал TMA формирует расчёт зеркальным методом, что позволяет плавно компенсировать пробойные удары и точнее определять разворот, канал имеет дополнительную защиту от сужения, канал имеет ускоритель направляющей с заданными настройками, сигналы появляются на возврате направляющей линии, Версия MTF 2023 позволяет индивидуально настраивать канал на другие временные рамки и разные инструменты, возможны доработки, рекомендуется Gold M1 M5

This Indicator will notified you when time to entry into the market, build with double william percent range strategy. --> Buy Notification will flag with the blue arrow --> Sell Notification will flag with the red arrow After Flag Appear, the market usually explode but carefully you must performs double check because weakness of this indicator when in the end of the trend

This Indicator will notified you when market going to trend reversal, build with candlestick pattern strategy
--> Sell Reversal Notification will flag with the Yellow arrow
--> Buy Reversal Notification will flag with the Pink arrow
After Flag Appear, the market usually reverse but carefully you must performs double check because weakness of this indicator when market in the middle of the trend
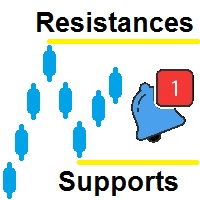
サポートとレジスタンスは、いくつかの異なる時間枠で自動的にトップとボトムを識別し、現在のチャートにこれらのトップとボトムをプロットするのに役立つように作成されました。 レジスタンスの作成の説明に行きましょう 上部と下部を定義できるルール フィールドがあり、上部のルールはデフォルトで次のように設定されます。 H[ 0 ]<=H[ 1 ] and H[ 1 ]=>H[ 2 ]
どこ:
エレメント 説明 H ハイを 意味します
[0] 現在の ろうそく を意味します [1] 前の ろうそく を意味します <= より低いか等しいこと を意味します => より高いか等しいこと を意味します
したがって、この式では、最初に次のルールを使用して、現在の高値が前の高値以下であるかどうかを確認します。 H[ 0 ]<=H[ 1 ] 次に、次の式を使用して、前回の高値が前回の高値以上であるかどうかを確認します。 H[ 1 ]=>H[ 2 ] 「And」は 2 つの表現を結合し、true の場合、新しい抵抗があることを意味します。 and ただし、マークを付けるには正しいろうそくを選択
FREE

MT5版 | FAQ | EA Universal Breakout Universal Box は、チャート上に価格帯をプロットし、後に価格帯ブレイクアウトで取引するために使用することができます。このインディケータを適用できる戦略はたくさんあります。 このインディケータは、デフォルトで アジア、ヨーロッパ、アメリカの取引セッション の範囲をチャートにマークするように設定されています。レンジは長方形で表示され、その境界線は取引セッションの開始時刻と終了時刻、およびその期間の最高値と最低値のレベルとなっています。 新しい Expert Advisor Prop Master - 取引ターミナルでテストしてください https://www.mql5.com/ja/market/product/115375
インジケーターの設定は非常にシンプルです。
Time Open - 取引セッションの開始時刻 Time Close - 取引セッションが終了した時刻 Box color - 矩形の色 インジケーターには4つの価格帯を設定することが可能です。 On Box パラ
FREE

価格波形パターン MT4へようこそ --(ABCD パターン)-- ABCD パターンは、テクニカル分析の世界で強力で広く使用されている取引パターンです。
これは、トレーダーが市場での潜在的な売買機会を特定するために使用する調和的な価格パターンです。
ABCD パターンを使用すると、トレーダーは潜在的な価格変動を予測し、いつ取引を開始および終了するかについて十分な情報に基づいた決定を下すことができます。 EA バージョン : Price Wave EA MT4
MT5バージョン: Price Wave Pattern MT5
特徴 :
ABCDパターンの自動検出。
強気パターンと弱気パターン。
任意のシンボルと任意の時間枠で機能します。 主要なレベルと価格目標。
カスタマイズ可能な設定と繊維レベルの調整。 アラートと通知。 今後さらに多くの機能が追加される予定です。
FREE

MetaForecastは、価格データのハーモニクスに基づいて、どんな市場の未来を予測し視覚化します。市場が常に予測可能ではありませんが、価格にパターンがある場合、MetaForecastは可能な限り正確な未来を予測できます。他の類似製品と比較して、MetaForecastは市場のトレンドを分析することでより正確な結果を生成することができます。
入力パラメータ Past size (過去のサイズ) MetaForecastが将来の予測を生成するために使用するバーの数を指定します。モデルは選択したバー上に描かれた黄色の線で表されます。 Future size (将来のサイズ) 予測すべき将来のバーの数を指定します。予測された将来は、ピンクの線で表示され、その上に青い回帰線が描かれます。 Degree (程度) この入力は、MetaForecastが市場で行う分析のレベルを決定します。 Degree 説明 0 Degree 0の場合、価格の全てのピークや谷、そして詳細をカバーするために、「Past size」の入力に大きな値を使用することが推奨されています。 1 (推奨) Degr

LINEAR REGREESION INDICATOR ==> The indicator represents the Linear Regression Line and the Support and Resistance lines, obtained based on the standard deviation with respect to the Linear Regression. Customization: The following values can be adjusted: Rango Tendencia: The number of bars or periods, within the considered time frame, taken as a reference for the indicator. AmpDesv: The amplitude or number of times to consider the standard deviation of the linear regression for its representatio

MT5版 | Valable ZigZagインジケーター | FAQ エリオット波動理論 は、価格チャート上の波の視覚的なモデルに基づいて、金融市場のプロセスを解釈するものです。この理論によれば、現在市場で優勢なトレンドは、上昇と下降のどちらであるかを正確に知ることができます。 Valable ZigZag インディケーター は、 市場の波動構造 を表示し、現在の時間枠で現在のメイントレンドの方向を示します。便利なことに、 Trend Monitor VZ インジケーターは、取引する通貨ペアの全リストについて、すべての時間枠のチャート上にトレンド方向を表示します。 1 つのチャートですべての商品の市場状態の全体像を把握し、正しい取引判断を下すことができます ! Valable ZigZag インジケーターは 非常に安定しており 、古典的な ZigZag のように頻繁に方向転換してトレーダーを混乱させることはありません。これは、インジケーターの波のプロットにフラクタルを使用することで実現されています。 Valable ZigZag インジケーターは、何よりもまずトレンドインジケー

Halfway House. How To Use This indicator is very simple to use. You are provided with a total of 5 tradable levels and a trend-line. 2 Bullish Levels (Green Lines) 2 Bearish Levels (Red Lines) 1 Switch-line Midpoint (Black Line) 2 Trend-line (Bullish and Bearish) If price is above the Black Line, You will be looking for bullish trades If price is below the Black Line, You will be looking for bearish trades The trend-line may be used as a guide. Vertical black line change represents weekly chan

Indicator customers will get Ea based on Fiter indicator for free as a Bonus. (watch video to see Ea in action) Fiter is EMA+ATR*RSI hibrid yellow line combined with Moving average red line, cross of which gives much smoother results than two simple Ma cross usage in trading. Effectiveness is proven by backtest and comparison with two simple Ma crosses. History shows that this method Fits with different market conditions and it can be boldly used in real manual trading for determining big trend

The technical indicator "Reversal patterns" is a mathematical interpretation of the classic reversal patterns: Pin Bar, Harami and Engulfing. That is, the "reversal bar", "Harami" and "Absorption". This indicator allows you to determine the moment of reversal of quotes based on market dynamics and the winner between the "bulls" and "bears".
The indicator displays the moment of reversal at the local highs and lows of the chart of any timeframe, which allows you to increase the accuracy of the
The indicator is based on the RSI logic. The indicator is automated for work on the M15 timeframe.
Automatic sending of alerts 2 setting modes Displaying signals by touching the price line Displaying signals when the indicator value leaves the "overbought" and "oversold" zones Ability to customize the indicator Ability to customize levels for any asset.

Order Blocks are supply or demand zones in which big traders can find the comfort of placing large buy and sell orders and completing a big, very big transaction. Order blocks are a unique trading strategy that helps traders find a direction in the market. Usually, it allows traders to find out what financial institutions are planning to do in a particular market and better indicate the next price movement.

MT5 Version Order Blocks ICT Kill Zones SMT Divergences ICT Breakers
The ICT Breakers indicator is a powerful tool for traders looking to gain an edge in the market. This indicator is based on the order flow and volume analysis, which allows traders to see the buying and selling pressure behind the price action. This information can be extremely valuable in identifying key levels of support and resistance, as well as potential turning points in the market. Breaker blocks are areas where i

The Multi Channel Trend indicator was developed to help you determine the trend direction by drawing channels on the graphical screen. It draws all channels that can be trending autonomously. It helps you determine the direction of your trend. This indicator makes it easy for you to implement your strategies. The indicator has Down trend lines and Up trend lines. You can determine the price direction according to the multiplicity of the trend lines. For example , if the Down trend lines start to

O indicador criado por Didi Aguiar, o mestre das Agulhadas!
O padrão do indicador é o cruzamento de três médias móveis simples. Média rápida, período 3. Média normalizada, período 8. Média lenta, período 20.
Quando as três médias se cruzam próximas o suficiente, acontece a agulhada! Pela posição das médias é possível identificar: Agulhada de compra, agulhada de venda, ponto falso e beijo da mulher aranha.
Quer saber mais? Procure pelo site dos robôs oficiais da Dojistar: tradesystembots.co
FREE

If you are boring in repeatedly changing of trading symbol in every charts when use multiple charts to analyzing prices or trading. This indicator can help you. It will change the symbol of any other charts in the terminal to the same as in the chart you have attached this indicator to it whenever you add new symbol to the chart or click on the button. After finished the job it will sleep quietly waiting for new occasion in order to minimize resource usage of the computor.
FREE
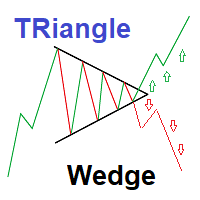
Strategy set to trade Triangle wedge break
This is a simple very effective strategy based on detecting and showing triangle wedges formation Strategy set to trade Triangle wedge break Red Arrows appears on crossing triangle down Green Arrows appears on crossing triangle Up You can also trade lower and upper triangle limit :(new version may be released to allow arrows for side ways trading) ---Sell on price declines from High triangle Level - Buy on increasing from Lower triangle level 2 inpu

Осциллятор Чайкина ( Chaikin Oscillator ) — это индикатор импульса, созданный Марком Чайкиным , и, очевидно, индикатор назван в честь своего создателя. Он измеряет импульс линии распределения и накопления, используя формулу схождения-расхождения скользящих средних (MACD). На основе данных об этом импульсе мы можем получить представление о направленных изменениях в линии распределения и накопления.

This indicator is a supporting tool which helps you draw/update any chart object once. The additions or changes are automatically synchronized to all linked chart windows of the same instrument. Setup is simple. Open all required charts you want to work on, attach the indicator to each chart window and start using it.
Its only allowed to attach one indicator to each chart. Once attached, you can draw on any chart (as long as it has this tool attached as indicator) and the drawing will show up

This indicator was constructed using decision trees. I will only give a few insights into the algorithm since it is original. But there are 4 trees in the inputs and by default they are 10. The decision tree logic for buy signals is as follows: If the MACD line is less than certain bullish divergence (determined by the "BUY_TREE_1" and "BUY_TREE_2" variables) The decision tree logic for sell signals is as follows: If the MACD line is greater than certain bearish divergence (determined by the
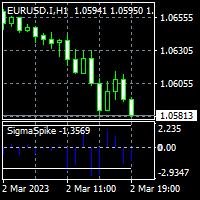
To get access to MT5 version please click here . - This is the exact conversion from TradingView: "SigmaSpikes(R) per Adam H. Grimes" by "irdoj75" - This is a light-load processing and non-repaint indicator. - All input options are available. - Buffers are available for processing in EAs. - You can message in private chat for further changes you need. Thanks for downloading
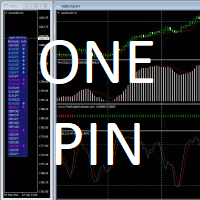
Transform indicators into trading signals JagzFX OnePin Basic allows a wide range of MT4 Custom Indicators to be transformed into multi-symbol trading signals without the need to write any code. You can use OnePin to create 'At A Glance' dashboards showing your preferred technical indicators and even send buy/sell signals to a PIN compatible dashboard just as JagzFX pinTrader. Whilst I have tried to limit the amount of technical jargon needed to use this PIN, there are a few terms that might nee
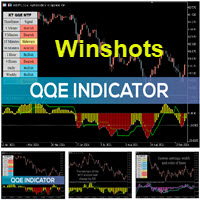
The Qualitative Quantitative Estimation (QQE) indicator is a technical analysis tool developed for the MetaTrader 4 (MT4) trading platform. It is designed to help traders identify potential trend reversals and to determine the strength of a current trend. The QQE indicator is calculated based on the Relative Strength Index (RSI) and Moving Average (MA) indicators. The RSI is used to determine the momentum of price movements, while the MA is used to smooth out the price data and identify trends.

This is an arrow formed by strong reversal candlesticks it is used on muti time frame or m15 and above for gold and h1 and above for currency pairs (can be used at m5 after strong volatile news) This indicator is 100% non-repain and non-repoint Have a success probability of bringing in more than 90% profit Your stop loss when entering your order is behind the arrow and will be very low it will only be 20 pips or 30 pips at m15 (note in larger timeframes it may be longer) How To USE When the
The "Stochastic Multi Period Buy Sell Alert" is a powerful technical indicator designed to analyze price momentum and trend strength across multiple timeframes. This indicator is a valuable tool for traders looking to identify profitable trading opportunities. With the indicator, you can monitor price movements in three different timeframes, namely M15, M30, and H1. The indicator calculates the Stochastic K value for each timeframe and determines whether the price is in an oversold or overbought

Clock GMT Live には、ブローカーについて詳しく知るために必要なすべての情報が含まれています。私が何の gmt を使用しているのか、または私のブローカーがどの gmt を使用しているのか疑問に思ったことは何度もありますが、このツールを使用すると、両方の GMT をリアルタイムで知ることができます。 ブローカーと現地時間の時間オフセット、ブローカーのpingも常に知ることができます 時間帯に置くだけで情報が得られる
買収ごとに価格が上昇します。これにより、独自の戦略を持つ人がほとんどいないように保護します 私の他の開発はここで見ることができます
正確なタイミングは、取引において重要な要素になる可能性があります。 現時点で、ロンドン証券取引所またはニューヨーク証券取引所はすでに開いていますか、それともまだ閉じていますか? FX取引の営業時間の開始時間と終了時間はいつですか? 手動でライブで取引するトレーダーにとって、これは大きな問題ではありません。 さまざまなインターネット ツール、金融商品の仕様、および時間自体を使用して、自分の戦略で取引する適切な時期をすばやく確認
FREE
MACD Spectra 、シンプルだが収益性の高い取引指標! このインジケーターは、すべての時間枠とすべての通貨ペアで使用できます。 90% を超える精度で、このインジケーターは、取引活動を支援するための最良のインジケーターを探している初心者とプロのトレーダーの両方に最適です。 ヒストグラムの色、ヒストグラムの位置、シグナルと MACD ラインの位置に従うだけで、簡単に市場に出入りできます。 これ以上待たずに、MACD Spectral と一緒に安定した利益を獲得しましょう。
エントリーとエグジットの場合、インジケーターの読み取りは非常に簡単です。
青色の線が赤色の線と交差し、交点がゼロ ラインより下にあり、表示されるヒストグラムがバー 2 で赤色の場合、白いヒストグラムが表示されたときに売りエントリーと終了の強いシグナルです。 青色の線が赤色の線と交差し、交点がゼロ ラインの上にあり、表示されるヒストグラムがバー 2 で緑色の場合、白いヒストグラムが表示されたときに、買いエントリーとエグジットの強いシグナルです。 0 以下の赤のヒストグラムの後に白のヒストグラムが表示され

Extreme Price Meter 過去の市場情報に基づいて、インディケータは反転の可能性が高い次の極端な価格を計算します。 売買の可能性が高い 2 つの価格帯を生成します。 ローソク足が確率バンドの外で閉じたときに配置される矢印を考慮すると、インジケーターの高い精度を簡単に確認できます。 デスクトップ、電話、電子メールの通知。
_________________________________________ _________________________________________ _________________________________________ _________________________________________
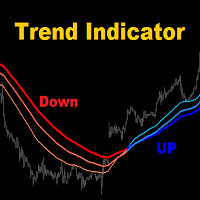
MA3 Trend - is the good trend indicator on three MAs. Benefits of the indicator: The indicator produces signals with high accuracy.
The confirmed signal of the indicator does not disappear and is not redrawn.
You can trade on the MetaTrader 4 trading platform of any broker.
You can trade any assets (currencies, metals, cryptocurrencies, stocks, indices etc.).
You can trade on any timeframes (M5-M15 scalping and day trading / M30-H1 medium-term trading / H4-D1 long-term trading). Indiv
FREE

外国為替矢印インジケーターは、通貨市場でスキャルピングを成功させるために不可欠なツールです。 これにより、トレーダーはいつ売買ポジションを開く価値があるかを簡単に判断できるため、チャート分析に時間を費やすことなく利益を上げることができます。 一種の信号機であるインジケータの赤と青の矢印は、トレンドの方向を簡単に判断できる視覚的なツールです。 赤い矢印はショート ポジションを開く、つまり通貨ペアを売る可能性を示し、青い矢印はロング ポジションを開く、つまり通貨ペアを買う可能性を示します。 しかし、重要なのは矢印の色だけではありません。 インジケーターには、トレーダーがいつポジションに出入りするかをより正確に判断するのに役立つ他のパラメーターもあります。 たとえば、矢印ごとに、インジケーターは価格レベルを表示でき、到達するとポジションを開く必要があります。 移動平均、ボラティリティ、時間間隔など、他のパラメータも設定できます。 - これらすべてが、トレーダーが市場の動きをより正確に予測するのに役立ちます。 外国為替矢印インジケーターは、トレンド、横方向の動き、ボラティリティの高低など、さ

** All Symbols x All Timeframes scan just by pressing scanner button ** *** Contact me after the purchase to send you instructions and add you in "Head & Shoulders Scanner group" for sharing or seeing experiences with other users. Introduction: Head and Shoulders Pattern is a very repetitive common type of price reversal patterns. The pattern appears on all time frames and can be used by all types of traders and investors. The Head and Shoulders Scanner indicator Scans All charts

Just another Auto Fibonacci Retracement indicator . However, this is the most Flexible & Reliable one you can find for FREE. If you use this indicator and you like it, please leave a review/comment. If you are looking for a more advanced Fibo indicator, check this Free Trend-Based Fibo indicator .
### FEATURES ### Auto-calculate up to 7 Fibonacci levels on your customized frame. Adjust levels as your need. Use High/Low price or Open/Close price to calculate. Freeze the levels and don't re
FREE

In case you get Laguerre S crat indicator, you will get Laguerre Scrat Ea as a Gift. To get Ea and det a iled m anu al PDF contact me PM. Default settings are for usd/cad H4 For St able Long term Profits Laguerre Scrat is a trading system based on 4 indicator combinations in the shape of one indicator. Laguerre indicator (upgraded), CCI, Bollinger bands and market volatility factor. It generates arrows in the indicator window and nuts on the price chart, doubling arrows for a better view where

if you want to put your "SL" in a safe place you should see the place of "SL" before opening the Order with this indicator no need to measure your "SL" on the chart many times please watch the video of this indicator:
you can change the style of this indicator: width, color, length, Time Frame, distance
if you need more info & video message me if you wanna see the video you should send me message Telegram ID: @forex_ex4 i also have other experts and indicators that will greatly improve your

The most Flexible & Reliable Trend-Based Fibonacci indicator by Safe Trading. This indicator helps you calculate Trend-Based Fibonacci levels base on the main and retracement trends to predict future price . If you just looking for a simple Fibonacci Retracement indicator, please use this Free indicator .
### FEATURES ### Auto-calculate up to 7 Trend-Based Fibonacci levels on adjustable frame. Adjust Fibonacci levels as your need. Adjust the start and the end of calculated frame in indicato
FREE
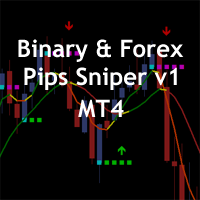
The Binary & Forex Pips Sniper MT4 indicator is based on technical analysis of two moving average and the slope of the slow moving average. The moving average helps to level the price data over a specified period by creating a constantly updated average price. Upward momentum is confirmed with a bullish crossover "Arrow UP", which occurs when a short-term moving average crosses above a longer-term moving average. Conversely, downward momentum is confirmed with a bearish crossover "Arrow Down", w

The indicator is a 15-minute signal indicator for all types of traders. Meaning, you could make lots of profits trading two different signals in one indicator.
NOTE: Both indicators are channels for achieving the same result. RED ARROW -- Sell Signal BLUE ARROW -- Buy Signal
Purchase now to be part of our community. We offer standard chart setups for both novice and intermediate traders. Trade with ease!
FREE
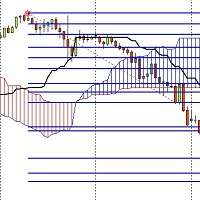
I have developed an indicator based on both the fibo musang strategy and the price breaking of the ichimoku cloud and it has amazing results
the features are:
1- Once activated it give you the trend where you are from the chart
2- After a trend change it gives you an alert on PC or notification on your phone if you are away.
3- It sends you the exact prices to take an order and 3 take profit levels and your stoploss.
4- It works on every timeframes from 1m to MN.
5- It works on pairs

This indicator demonstrates that the price change of financial instruments is NOT a random walk process, as advocated by the "Random Walk Hypothesis", and as popularised by the bestselling book "A Random Walk Down Wall Street". I wish that were the case! It is shown here that the real situation with price change is actually much worse than a random walk process! Deceptive market psychology, and the bulls-bears tug of war, stack up the odds against traders in all instruments, and all time frame
FREE
MetaTraderマーケットはMetaTraderプラットフォームのためのアプリを購入するための便利で安全な場所を提供します。エキスパートアドバイザーとインディケータをストラテジーテスターの中でテストするためにターミナルから無料のデモバージョンをダウンロードしてください。
パフォーマンスをモニターするためにいろいろなモードでアプリをテストし、MQL5.community支払いシステムを使ってお望みのプロダクトの支払いをしてください。
取引の機会を逃しています。
- 無料取引アプリ
- 8千を超えるシグナルをコピー
- 金融ニュースで金融マーケットを探索
新規登録
ログイン