Narayanan Mohanan Mohanan Krishnan
  • ML/Python/MQL Developer в Independent
  • ОАЭ
  • 1473
  • Информация
нет
опыт работы
18
продуктов
0
демо-версий
0
работ
0
сигналов
0
подписчиков
ML/Python/MQL Developer в Independent
Я создаю инструменты измерения для MetaTrader. Они описывают, что рынок уже сделал, и прямо указывают границы каждого измерения, а не скрывают их.

Тридцать лет работы над производственными системами и автоматизацией, перенаправленные в количественные исследования в 2020 году. Исследования веду на Python — фреймворки для бэктестинга, walk-forward валидация, статистическая оценка больших наборов кандидатов, — и то, что это выдерживает, становится индикатором или советником. Принцип — фальсификация в первую очередь: результат считается артефактом, пока не подтвердится вне выборки. То, что доходит до этой витрины, несёт в себе границы собственного измерения, указывает, где показание перестаёт быть значимым, и документирует места расхождения двух платформ, а не усредняет их молча.
Ничто из опубликованного здесь не выдаёт торговых сигналов и не содержит заявлений о доходности.
____________________________________________________________________
🔬 MEASUREMENT — point it at any indicator and read what it actually does
▸ Indicator Test Report · 🆓 · MT5 — twelve checks, a plain-language report https://www.mql5.com/en/market/product/191061
▸ Indicator Test Report MT4 · 🆓 · MT4 https://www.mql5.com/en/market/product/192010
____________________________________________________________________
📊 CURRENCY STRENGTH — the eight majors decomposed from all 28 pairs
▸ Multi Timeframe Currency Strength Panel · 🆓 · MT5 https://www.mql5.com/en/market/product/188552
▸ MTF Currency Strength Panel MT4 · 🆓 · MT4 https://www.mql5.com/en/market/product/189304
▸ Currency Strength Oscillator MT5 · $39 · MT5 — the same decomposition as a history https://www.mql5.com/en/market/product/188624
▸ Currency Strength Oscillator MT4 · $39 · MT4 https://www.mql5.com/en/market/product/189507
____________________________________________________________________
📈 VOLUME AND ORDER FLOW
▸ Anchored Volume Delta with Adaptive Bands · 🆓 · MT5 https://www.mql5.com/en/market/product/188383
▸ Anchored Volume Delta with Adaptive Bands MT4 · 🆓 · MT4 https://www.mql5.com/en/market/product/188916
▸ OBVCD Pro · $49 · MT5 https://www.mql5.com/en/market/product/172855
▸ OBVCD Pro MT4 · $49 · MT4 https://www.mql5.com/en/market/product/189055
____________________________________________________________________
⚡ MOMENTUM AND VOLATILITY
▸ Force Index with Adaptive Volatility Bands · 🆓 · MT5 https://www.mql5.com/en/market/product/188434
▸ Force Index with Adaptive Volatility Bands MT4 · 🆓 · MT4 https://www.mql5.com/en/market/product/189058
____________________________________________________________________
🔍 REGIME AND STRUCTURE
▸ Oscillator Regime Suite · $89 · MT5 https://www.mql5.com/en/market/product/188673
▸ Oscillator Regime Suite MT4 · $89 · MT4 https://www.mql5.com/en/market/product/189783
▸ Structure Flow and Trailing Stop · $99 · MT5 https://www.mql5.com/en/market/product/188849
▸ Structure Flow and Trailing Stop MT4 · $99 · MT4 https://www.mql5.com/en/market/product/190923
____________________________________________________________________
📐 TREND PERSISTENCE — how often the current state has survived to the next bar
▸ Trend Survival States · 🆓 · MT5 — the five-state classification https://www.mql5.com/en/market/product/190790
▸ Trend Survival Rate · $99 · MT5 — adds the survival rate and a Brier forecast score https://www.mql5.com/en/market/product/190792
____________________________________________________________________
🧪 ТЕСТОВАЯ СРЕДА
Всё здесь разрабатывается и тестируется на Exness, на реальном терминале, где доступны все 28 основных пар, а глубина истории проверена от M1 до MN1 — включая пропуски в данных, которые я нашёл и описал в листинге Currency Strength Oscillator, вместо того чтобы оставить их покупателю. Я являюсь представляющим брокером Exness; если вы откроете счёт по моей ссылке, я получу комиссию, и выбирать брокера следует по своим критериям, а не по моим. Этот профиль не принадлежит Exness и не управляется им.

▸ Открыть счёт: https://one.exnessonelink.com/a/d3zld339yo
______________________________________________________________________________________________________________
✉️ Вопросы о расчётах, буферах или об использовании этих инструментов вместе с вашими — напишите мне. Я отвечаю.
Narayanan Mohanan Mohanan Krishnan Выставил продукт

Indicator Test Report для MetaTrader 5 — средство проверки перерисовки и тестер индикаторов, которое показывает, как на самом деле ведет себя любой индикатор. Вы не можете заглянуть внутрь скомпилированного индикатора. Indicator Test Report загружает любой индикатор — купленный, написанный или встроенный в MetaTrader — и отвечает на вопрос, на который не может ответить описание: перерисовывается ли он, сколько истории ему нужно и что на самом деле публикует? Он сообщает о поведении. Это не

Narayanan Mohanan Mohanan Krishnan Выставил продукт

Indicator Test Report для MetaTrader 4 — средство проверки перерисовки и тестер индикаторов MT4, которое показывает, как на самом деле ведет себя любой индикатор. Вы не можете заглянуть внутрь скомпилированного индикатора. Отчет о тестировании индикатора загружает любой индикатор — купленный, написанный или встроенный в MetaTrader — и отвечает на вопрос, на который не может ответить описание: перерисовывается ли он, сколько истории ему нужно и что на самом деле публикует? Он сообщает о

Narayanan Mohanan Mohanan Krishnan Выставил продукт

Structure Flow и Trailing Stop MT4 — адаптивная линия потока с пятью методами трейлинг-стопа, структурой рынка и полосами ликвидности для MetaTrader 4 Пять методов трейлинг-стопа, одна адаптивная линия потока и панель условий, которая сообщает, сколько измерений совпадают. Этот индикатор рисует на ценовом графике две линии: адаптивную линию потока, которая следует за направлением рынка, и скользящий стоп, который движется только в этом направлении и никогда назад. Небольшая группа экспертов

Narayanan Mohanan Mohanan Krishnan
Crude oil closed at 81.518 on Friday. Three charts of the same instrument, three different measurements, and they do not agree with each other. That is not a fault in any of them. It is what happens when you ask three questions that only sound like the same question...
Narayanan Mohanan Mohanan Krishnan Выставил продукт

Trend Survival States для MetaTrader 5 — индикатор режима свободного рынка, измеряющий бычье и медвежье давление с адаптивными полосами волатильности и классификацией трендов по пяти состояниям. Давление быков и медведей, адаптивный спред и рыночная классификация с пятью состояниями, бесплатно для MT5. Он измеряет давление покупателей и продавцов, стоящее за текущим движением, и классифицирует его по состоянию рынка: сильное бычье, слабое бычье, нейтральное, слабое медвежье, сильное медвежье

Narayanan Mohanan Mohanan Krishnan Выставил продукт

Trend Survival Rate для MetaTrader 5 — индикатор рыночного режима, который измеряет, как часто текущее состояние тренда доживает до следующего бара, и выставляет собственный прогноз. Уровень выживаемости тренда, классификация состояния рынка и текущий прогноз Брайера в одном окне индикатора MT5. Он измеряет давление покупателей и продавцов, стоящее за текущим движением, классифицирует его как состояние рынка и сообщает, как часто это состояние доживает до следующего бара, а затем сравнивает свой

Narayanan Mohanan Mohanan Krishnan
Three charts of the same instrument, the same indicator and the same settings. Force Index with adaptive volatility bands at 13, 20 and 2.0 deviations, on BTCUSD monthly, weekly and daily. The Force Index on the closed daily bar of 12 August reads −11,252,859.29...
Narayanan Mohanan Mohanan Krishnan Выставил продукт

Индикатор применяет конструкцию схождения/расхождения — быстрая скользящая средняя минус медленная, с сигнальной линией — к ряду, производному от объёма , а не к цене. На выбор доступны три источника: кумулятивная дельта объёма, индекс силы и балансовый объём. Поверх результата строятся адаптивные полосы волатильности, и каждый завершённый бар классифицируется в одно из пяти состояний режима. Это состояние выводится в отдельный числовой буфер, поэтому советник может читать его напрямую. Почему

Narayanan Mohanan Mohanan Krishnan
A daily XAUUSD chart can look fairly simple until several independent measurements are placed beside the price. On the chart below, gold has recovered from the July decline...
Narayanan Mohanan Mohanan Krishnan Выставил продукт

Осциллятор силы валюты для MetaTrader 4 Индикатор относительной силы валюты, отображающий историю восьми основных валют. Этот осциллятор силы валют отображает относительную силу восьми основных валют в виде истории, разложенную по 28 основные пары. В то время как стандартный индикатор силы валюты показывает, где обстоят дела сейчас, он показывает, как они туда попали — какая валюта укрепляется, какая перекатилась и где рейтинг перешел из рук в руки. Все восемь серий представлены в виде

Narayanan Mohanan Mohanan Krishnan Выставил продукт

MTF Currency Strength Panel for MetaTrader 4 Мультитаймфреймовый индикатор силы валют: все 28 основных пар на одном графике. Эта панель силы валют показывает, где сейчас находятся восемь основных валют и как каждая из 28 основных пар двигалась одновременно на девяти таймфреймах — от M1 до MN1. Оба показателя выводятся на одном графике и обновляются по таймеру. Самостоятельное ранжирование пар вводит в заблуждение. Когда движется одна валюта, каждая содержащая ее пара движется вместе с ней

Narayanan Mohanan Mohanan Krishnan
Elder's Force Index is one of the few classical indicators that combines price and volume in a single line. Each bar contributes (close − previous close) × volume. Positive when buyers carried the bar, negative when sellers did, and proportional to how much was traded doing it...
Narayanan Mohanan Mohanan Krishnan
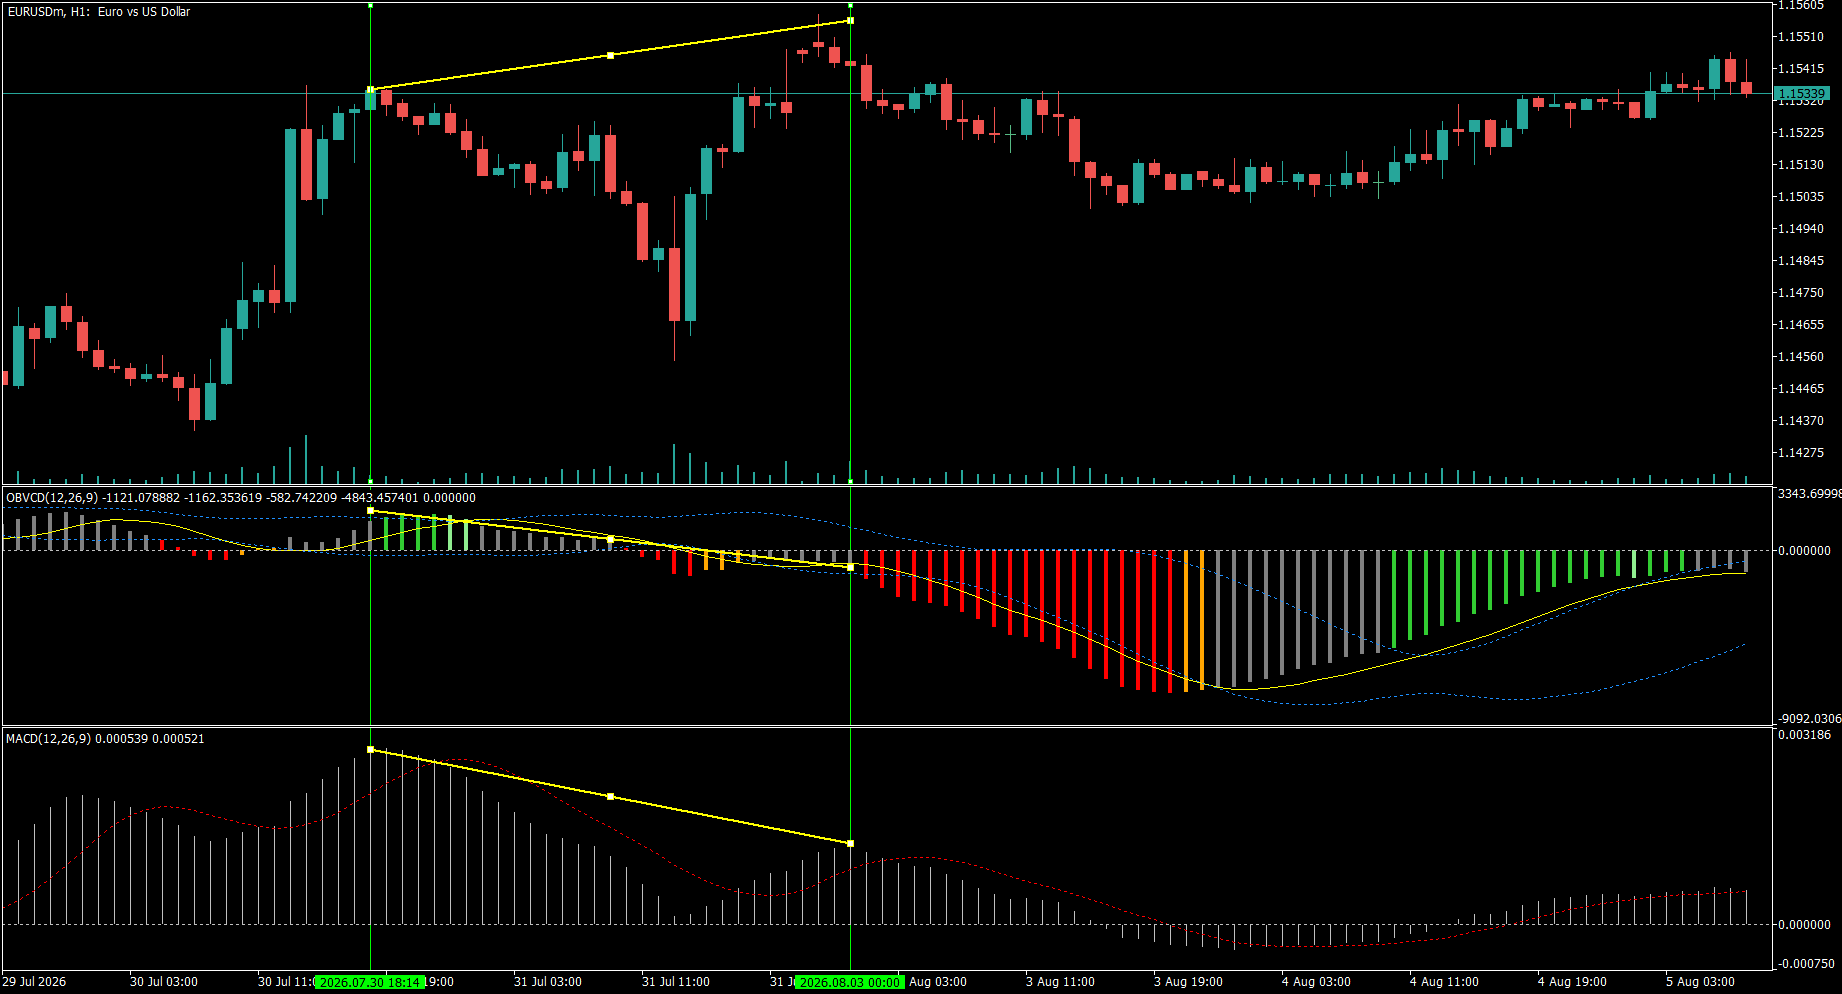
EURUSD H1 — the same divergence, two different answers

Between 30 July and 3 August, price made a higher high. Standard MACD made a lower high. So did OBVCD — the same 12/26/9 construction applied to On-Balance Volume instead of price. Both oscillators disagreed with price, and MACD showed the divergence more steeply of the two.

Then they parted company. At the second marked line OBVCD had crossed below zero — reading -1121 against its signal at -1162. MACD at the same bar was still positive: +0.000539, signal +0.000521. Price rolled over afterwards.

That difference is the whole point of the pane. A divergence is a statement about slope: the new high was made with less momentum than the last. A zero-line cross is a statement about state: the fast average has fallen below the slow one, so the underlying series has actually turned. Price momentum had not turned yet. Cumulative volume flow had.

Neither reading is a signal to act, and the same chart shows why — follow it right and the decline exhausts, OBVCD climbs back through zero, and the histogram turns green again. That is the honest shape of it.

Descriptive, not predictive. One instance on one instrument, shown because the sequence is legible, not because it repeats.

#EURUSD #OBVCD #MACD #divergence #volume #technicalanalysis #MT5 #MT4
Narayanan Mohanan Mohanan Krishnan Выставил продукт

Этот индикатор отображает Индекс силы — изменение цены каждого бара, умноженное на его объём — внутри полос адаптивного стандартного отклонения. Если только цена говорит вам о движении рынка, индекс силы показывает, сколько усилий было затрачено на его перемещение. Большое изменение цены при небольшом объеме и небольшое изменение при большом объеме — это совершенно разные события, даже если свечи выглядят одинаково. Индекс силы разделяет их, объединяя оба показания в одно, и полосы помещают это

Narayanan Mohanan Mohanan Krishnan Выставил продукт

49.00 USD

OBVCD Pro — это импульсный осциллятор, который применяет анализ конвергенции/дивергенции к Балансовый объем (OBV) вместо цены, сочетая адаптивные полосы волатильности с классификатором режимов с 5 состояниями, который можно прочитать визуально на графике или использовать непосредственно советником. Большинство классических осцилляторов анализируют только цену. OBVCD Pro рассчитывает конвергенцию и дивергенцию на основе совокупного объемного потока, поэтому он измеряет участие в движении рынка, а

Narayanan Mohanan Mohanan Krishnan Выставил продукт

Индикатор строит кумулятивную дельту объёма (CVD) — нарастающий итог объёма каждого бара со знаком в зависимости от направления его закрытия — внутри адаптивных полос стандартного отклонения. Он отвечает на вопрос, на который цена сама по себе не отвечает: движение поддержано участием или это просто дрейф? Нарастающий итог начинается заново на выбранной вами точке привязки — дневной, недельной или месячной, — поэтому показание всегда соотносится с текущей сессией, неделей или месяцем, а не с

Narayanan Mohanan Mohanan Krishnan
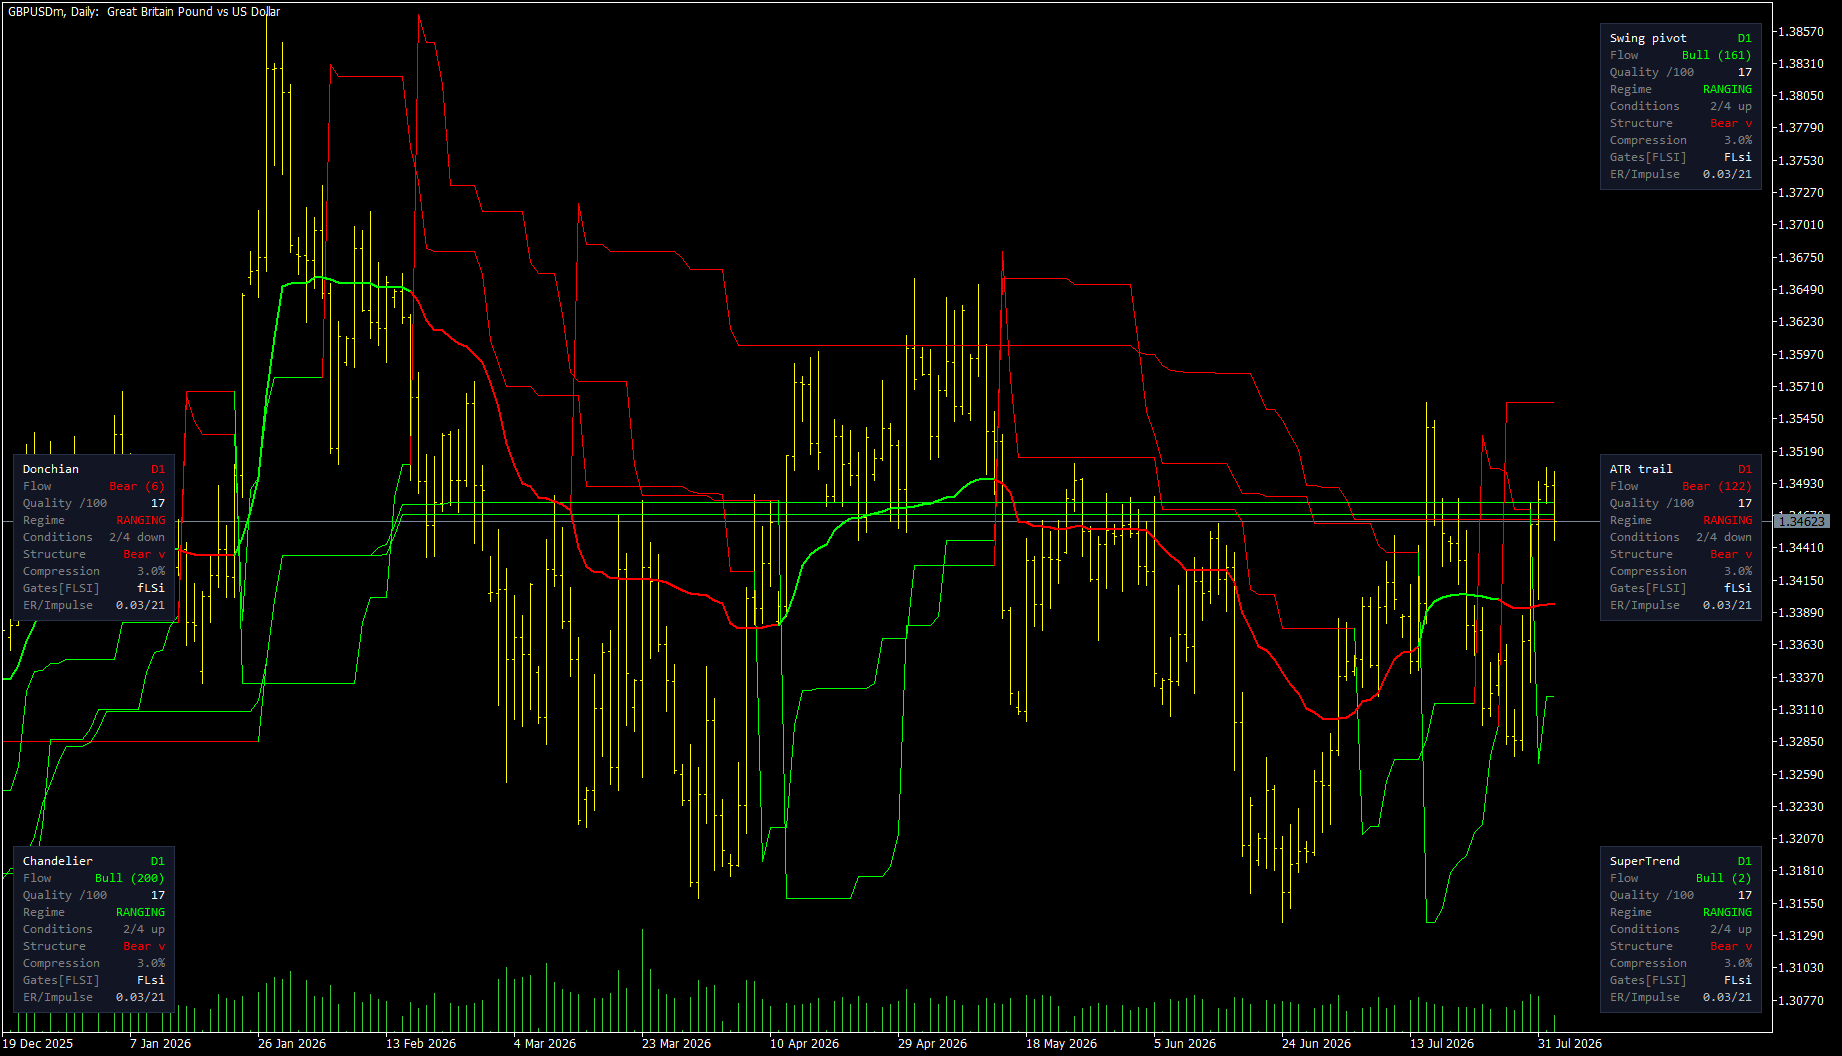
Five trailing stops on one chart. Three say up, two say down.

Same instrument, same daily bars, same settings. GBPUSD.

Swing pivot: bullish, 161 bars. Chandelier: bullish, 200 bars. SuperTrend: bullish, but only 2 bars — it just flipped. ATR trail: bearish, 122 bars. Donchian: bearish, 6 bars.

Five methods, three answers up and two down, and none of them is wrong.

They disagree because they anchor to different things. A trailing stop has to decide what it is trailing behind, and that choice is the whole method:

The swing pivot sits where the market last turned. The ATR trail keeps a fixed volatility distance from a smoothed average. SuperTrend brackets each bar's median price and flips when the close crosses. Chandelier hangs from the highest point of the move so far. Donchian uses only the highest high and lowest low, with no volatility term at all.

Four of those five use ATR. One doesn't. That is deliberate — a single ATR multiple is one opinion about how much room to give, and it is a famously poor one at the moments that matter most, when volatility is compressed right before it expands.

The interesting part is not which method is right. It is that all five panels agree the regime is ranging.

That is what a rangebound market looks like when you measure it five ways: the methods scatter. In a strong trend they converge — same chart, different period, they sit within a narrow band of each other.

So the spread between them carries information that no single stop level does. Wide spread, no structure to anchor to. Narrow spread, the market is doing something all five can agree on.

I have not tested whether that spread predicts anything, and I would want a few thousand samples before saying it does. But as a description of the present it is more honest than any one line.

All five methods are in one indicator — Structure Flow and Trailing Stop, on the MQL5 Market.

#quantitativefinance #algorithmictrading #mql5 #tradingsystems #forex #technicalanalysis
Narayanan Mohanan Mohanan Krishnan Выставил продукт

Индикатор рисует на ценовом графике две линии: адаптивную линию потока, следующую за направлением рынка, и трейлинг-стоп, который движется только в этом направлении и никогда обратно. Небольшая панель показывает состояние, стоящее за ними. Трейлинг-стоп может рассчитываться пятью разными способами. Это не вариации одной идеи — каждый привязан к чему-то своему, и на одном и том же графике они нередко расходятся. Линия потока Адаптивное среднее. Оно сильно сглаживает, когда цена ходит в диапазоне

Narayanan Mohanan Mohanan Krishnan Выставил продукт

Индикатор применяет конструкцию схождения/расхождения — быстрая скользящая средняя минус медленная, с сигнальной линией — к ряду, производному от объёма , а не к цене. На выбор доступны три источника: кумулятивная дельта объёма, индекс силы и балансовый объём. Поверх результата строятся адаптивные полосы волатильности, и каждый завершённый бар классифицируется в одно из пяти состояний режима. Это состояние выводится в отдельный числовой буфер, поэтому советник может читать его напрямую. Почему

Narayanan Mohanan Mohanan Krishnan
MACD and OBVCD on the same settings — Bitcoin weekly, 2019 to 2026

Both panes below use 50, 200, 20. The lower one is the standard MetaTrader MACD, computed on price. The upper one is the same construction computed on On Balance Volume — so it measures the convergence and divergence of accumulated volume rather than of price itself.

The chart covers two full Bitcoin cycles.

What I find interesting is not that one leads the other. It is that they answer different questions.

The MACD histogram tracks price momentum, and on a weekly chart across seven years it does that cleanly. But it is describing something you can already see by looking at the candles above it.

The OBV version is describing whether volume was accumulating or distributing while that price move happened. Through 2024 and into 2025 the histogram runs green and expanding — volume building alongside the advance. The turn to red at the right edge comes as that accumulation reverses.

The five colours are the part I actually use. Green above the upper band means momentum expanding; light green means still above the band but fading; grey means inside the bands, no regime; orange and red are the bearish equivalents. The bands are a 20-period standard deviation on the histogram itself, so they widen and contract with activity instead of relying on fixed levels.

That state is also exposed as a buffer — values +2 to −2 — so an EA can read the regime directly rather than re-deriving it from the plot.

Neither indicator predicts anything. Both are descriptive: they tell you what has happened to price momentum and to volume momentum respectively. I mention that because the interesting part of this chart is the disagreement between the two panes, not a signal from either.

Free demo on the product page, and the buffer map is documented in the description.

Five MT5 indicators published, three of them free — currency strength, Force Index, and volume delta, all with documented buffers. Happy to answer questions about any of the calculations.

Five MT5 indicators published, three of them free — currency strength, Force Index, and volume delta, all with documented buffers. Happy to answer questions about any of the calculations.

https://www.mql5.com/en/users/naamo/seller
12