Narayanan Mohanan Mohanan Krishnan
  • Información
no
experiencia
18
productos
0
versiones demo
0
trabajos
0
señales
0
suscriptores
ML/Python/MQL Developer en Independent
Construyo herramientas de medición para MetaTrader. Describen lo que el mercado ha hecho y declaran los límites de cada medición en lugar de ocultarlos.

Treinta años construyendo sistemas de producción y automatización, redirigidos al trabajo cuantitativo en 2020. Mi investigación se hace en Python — marcos de backtesting, validación walk-forward, evaluación estadística sobre grandes conjuntos de candidatos — y lo que sobrevive a eso se convierte en un indicador o en un Expert Advisor. La disciplina es falsación primero: un resultado se trata como un artefacto hasta que se sostiene fuera de muestra. Lo que llega a este catálogo lleva consigo los límites de su propia medición, indica dónde una lectura deja de ser significativa y documenta los puntos en que dos plataformas discrepan, en vez de promediarlos en silencio.
Nada de lo publicado aquí genera señales de trading, y nada aquí incluye afirmaciones de rendimiento.
____________________________________________________________________
🔬 MEASUREMENT — point it at any indicator and read what it actually does
▸ Indicator Test Report · 🆓 · MT5 — twelve checks, a plain-language report https://www.mql5.com/en/market/product/191061
▸ Indicator Test Report MT4 · 🆓 · MT4 https://www.mql5.com/en/market/product/192010
____________________________________________________________________
📊 CURRENCY STRENGTH — the eight majors decomposed from all 28 pairs
▸ Multi Timeframe Currency Strength Panel · 🆓 · MT5 https://www.mql5.com/en/market/product/188552
▸ MTF Currency Strength Panel MT4 · 🆓 · MT4 https://www.mql5.com/en/market/product/189304
▸ Currency Strength Oscillator MT5 · $39 · MT5 — the same decomposition as a history https://www.mql5.com/en/market/product/188624
▸ Currency Strength Oscillator MT4 · $39 · MT4 https://www.mql5.com/en/market/product/189507
____________________________________________________________________
📈 VOLUME AND ORDER FLOW
▸ Anchored Volume Delta with Adaptive Bands · 🆓 · MT5 https://www.mql5.com/en/market/product/188383
▸ Anchored Volume Delta with Adaptive Bands MT4 · 🆓 · MT4 https://www.mql5.com/en/market/product/188916
▸ OBVCD Pro · $49 · MT5 https://www.mql5.com/en/market/product/172855
▸ OBVCD Pro MT4 · $49 · MT4 https://www.mql5.com/en/market/product/189055
____________________________________________________________________
⚡ MOMENTUM AND VOLATILITY
▸ Force Index with Adaptive Volatility Bands · 🆓 · MT5 https://www.mql5.com/en/market/product/188434
▸ Force Index with Adaptive Volatility Bands MT4 · 🆓 · MT4 https://www.mql5.com/en/market/product/189058
____________________________________________________________________
🔍 REGIME AND STRUCTURE
▸ Oscillator Regime Suite · $89 · MT5 https://www.mql5.com/en/market/product/188673
▸ Oscillator Regime Suite MT4 · $89 · MT4 https://www.mql5.com/en/market/product/189783
▸ Structure Flow and Trailing Stop · $99 · MT5 https://www.mql5.com/en/market/product/188849
▸ Structure Flow and Trailing Stop MT4 · $99 · MT4 https://www.mql5.com/en/market/product/190923
____________________________________________________________________
📐 TREND PERSISTENCE — how often the current state has survived to the next bar
▸ Trend Survival States · 🆓 · MT5 — the five-state classification https://www.mql5.com/en/market/product/190790
▸ Trend Survival Rate · $99 · MT5 — adds the survival rate and a Brier forecast score https://www.mql5.com/en/market/product/190792
____________________________________________________________________
🧪 ENTORNO DE PRUEBAS
Todo aquí se desarrolla y se prueba en Exness, en un terminal real con los 28 pares principales disponibles y la profundidad del historial verificada de M1 a MN1 — incluidos los huecos de datos que encontré y documenté en la ficha de Currency Strength Oscillator, en lugar de dejarlos para que los descubra un comprador. Soy broker introductor de Exness; si abre una cuenta a través de mi enlace recibo una comisión, y debería elegir un broker según sus propios criterios y no los míos. Este perfil no es propiedad de Exness ni está operado por Exness.

▸ Abrir una cuenta: https://one.exnessonelink.com/a/d3zld339yo
______________________________________________________________________________________________________________
✉️ Preguntas sobre los cálculos, los búferes o el uso de cualquiera de estos junto con sus propias herramientas: envíeme un mensaje. Respondo.
Narayanan Mohanan Mohanan Krishnan Ha publicado el producto

Indicator Test Report para MetaTrader 5: un verificador de repintado y probador de indicadores que muestra cómo se comporta realmente cualquier indicador No se puede ver el interior de un indicador compilado. El Indicator Test Report carga cualquier indicador (comprado, escrito o integrado en MetaTrader) y responde a la pregunta que una descripción no puede: ¿repinta, cuánto historial necesita y qué publica realmente? Informa del comportamiento. No califica. Cargue cualquier indicador en el

Narayanan Mohanan Mohanan Krishnan Ha publicado el producto

Indicator Test Report para MetaTrader 4: un verificador de repintado de MT4 y un probador de indicadores que muestra cómo se comporta realmente cualquier indicador No se puede ver el interior de un indicador compilado. El Informe de prueba de indicadores carga cualquier indicador (comprado, escrito o integrado en MetaTrader) y responde a la pregunta que una descripción no puede: ¿repinta, cuánto historial necesita y qué publica realmente? Informa del comportamiento. No califica. Cargue cualquier

Narayanan Mohanan Mohanan Krishnan Ha publicado el producto

Structure Flow y Trailing Stop MT4: una línea de flujo adaptable con cinco métodos de trailing stop, estructura de mercado y bandas de liquidez para MetaTrader 4 Cinco métodos de trailing stop, una línea de flujo adaptativa y un panel de condición que informa cuántas mediciones coinciden. Este indicador dibuja dos líneas en el gráfico de precios: una línea de flujo adaptativo que sigue la dirección del mercado y un trailing stop que se mueve sólo en esa dirección y nunca hacia atrás. Un pequeño

Narayanan Mohanan Mohanan Krishnan
Crude oil closed at 81.518 on Friday. Three charts of the same instrument, three different measurements, and they do not agree with each other. That is not a fault in any of them. It is what happens when you ask three questions that only sound like the same question...
Narayanan Mohanan Mohanan Krishnan Ha publicado el producto

Trend Survival States para MetaTrader 5: un indicador de régimen de libre mercado que mide la presión alcista y bajista con bandas de volatilidad adaptativas y una clasificación de tendencias de cinco estados Presión alcista y bajista, diferencial de banda adaptativa y clasificación de mercado de cinco estados, gratis para MT5. Mide la presión de compra y venta detrás del movimiento actual y la clasifica en un estado de mercado: alcista fuerte, alcista débil, neutral, bajista débil, bajista

Narayanan Mohanan Mohanan Krishnan Ha publicado el producto

Tasa de supervivencia de tendencia para MetaTrader 5: un indicador del régimen de mercado que mide la frecuencia con la que el estado de tendencia actual ha sobrevivido hasta la siguiente barra y puntúa su propio pronóstico. Tasa de supervivencia de tendencias, clasificación del estado del mercado y puntuación de pronóstico de Brier en vivo, en una ventana de indicador MT5. Mide la presión de compra y venta detrás del movimiento actual, lo clasifica en un estado de mercado e informa con qué

Narayanan Mohanan Mohanan Krishnan
Three charts of the same instrument, the same indicator and the same settings. Force Index with adaptive volatility bands at 13, 20 and 2.0 deviations, on BTCUSD monthly, weekly and daily. The Force Index on the closed daily bar of 12 August reads −11,252,859.29...
Narayanan Mohanan Mohanan Krishnan Ha publicado el producto

Este indicador aplica la construcción de convergencia/divergencia —media móvil rápida menos lenta, con una línea de señal— a una serie derivada del volumen en lugar de al precio. Hay tres fuentes seleccionables: Delta de Volumen Acumulado, Índice de Fuerza y On Balance Volume. Sobre el resultado se trazan bandas de volatilidad adaptativas, y cada barra cerrada se clasifica en uno de cinco estados de régimen. Ese estado se expone como un búfer numérico, de modo que un Asesor Experto puede leerlo

Narayanan Mohanan Mohanan Krishnan
A daily XAUUSD chart can look fairly simple until several independent measurements are placed beside the price. On the chart below, gold has recovered from the July decline...
Narayanan Mohanan Mohanan Krishnan Ha publicado el producto

Oscilador de fuerza monetaria para MetaTrader 4 Un indicador de fortaleza relativa de la moneda que traza la historia de las ocho principales. Este oscilador de fortaleza monetaria traza la fortaleza relativa de las ocho monedas principales como una historia, descompuesta de la 28 pares principales. Si bien un medidor de fortaleza monetaria estándar le dice dónde están las cosas en este momento, esto muestra cómo llegaron allí: qué moneda se ha fortalecido, cuál se ha revertido y dónde cambió de

Narayanan Mohanan Mohanan Krishnan Ha publicado el producto

MTF Currency Strength Panel for MetaTrader 4 Medidor de fuerza de divisas multitemporal: los 28 pares principales en un solo gráfico. Este panel de fuerza de divisas muestra dónde se sitúan ahora las ocho divisas principales y cómo se ha movido cada uno de los 28 pares principales en nueve marcos temporales a la vez, de M1 a MN1. Ambas lecturas caben en un solo gráfico y se actualizan mediante un temporizador. Clasificar pares por sí solo es engañoso. Cuando una sola moneda se mueve, cada par

Narayanan Mohanan Mohanan Krishnan
Elder's Force Index is one of the few classical indicators that combines price and volume in a single line. Each bar contributes (close − previous close) × volume. Positive when buyers carried the bar, negative when sellers did, and proportional to how much was traded doing it...
Narayanan Mohanan Mohanan Krishnan
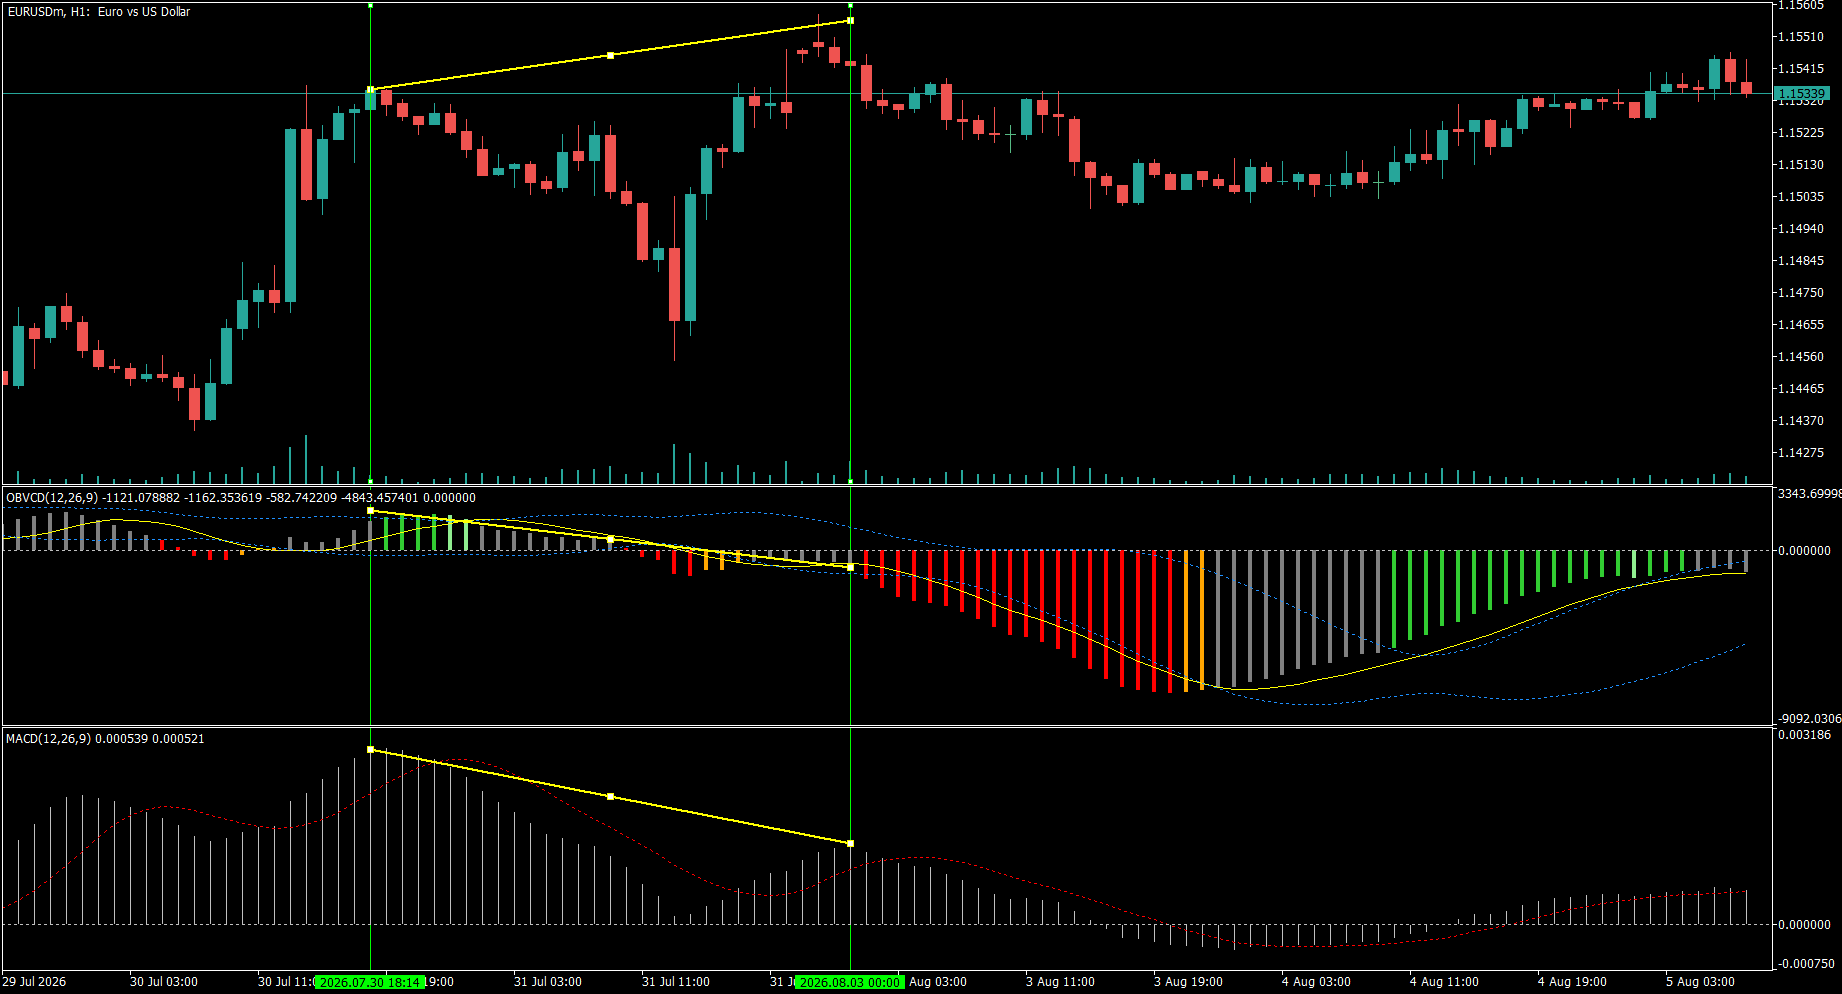
EURUSD H1 — the same divergence, two different answers

Between 30 July and 3 August, price made a higher high. Standard MACD made a lower high. So did OBVCD — the same 12/26/9 construction applied to On-Balance Volume instead of price. Both oscillators disagreed with price, and MACD showed the divergence more steeply of the two.

Then they parted company. At the second marked line OBVCD had crossed below zero — reading -1121 against its signal at -1162. MACD at the same bar was still positive: +0.000539, signal +0.000521. Price rolled over afterwards.

That difference is the whole point of the pane. A divergence is a statement about slope: the new high was made with less momentum than the last. A zero-line cross is a statement about state: the fast average has fallen below the slow one, so the underlying series has actually turned. Price momentum had not turned yet. Cumulative volume flow had.

Neither reading is a signal to act, and the same chart shows why — follow it right and the decline exhausts, OBVCD climbs back through zero, and the histogram turns green again. That is the honest shape of it.

Descriptive, not predictive. One instance on one instrument, shown because the sequence is legible, not because it repeats.

#EURUSD #OBVCD #MACD #divergence #volume #technicalanalysis #MT5 #MT4
Narayanan Mohanan Mohanan Krishnan Ha publicado el producto

Este indicador traza la Índice de fuerza (el cambio de precio de cada barra multiplicado por su volumen) dentro de bandas adaptativas de desviación estándar. Mientras que el precio por sí solo indica que un mercado se movió, el índice de fuerza indica cuánto esfuerzo se hizo para moverlo. Un gran cambio de precio en un volumen reducido y un pequeño cambio en un volumen elevado son eventos muy diferentes, incluso cuando las velas parecen similares. El índice de fuerza los separa combinándolos en

Narayanan Mohanan Mohanan Krishnan Ha publicado el producto

49.00 USD

OBVCD Pro es un oscilador de impulso que aplica análisis de convergencia/divergencia a Volumen en equilibrio (OBV) en lugar de precio, combina bandas de volatilidad adaptativas con un clasificador de régimen de 5 estados que puede leerse visualmente en el gráfico o ser consumido directamente por un Asesor Experto. La mayoría de los osciladores clásicos analizan únicamente el precio. OBVCD Pro calcula la convergencia y divergencia del flujo de volumen acumulado, por lo que mide la participación

Narayanan Mohanan Mohanan Krishnan Ha publicado el producto

Este indicador representa el Delta de Volumen Acumulado (CVD) — el total acumulado del volumen de cada vela, con el signo de la dirección en que cerró — dentro de bandas adaptativas de desviación estándar. Responde a una pregunta que el precio por sí solo no responde: ¿el movimiento está sostenido por la participación, o simplemente va a la deriva? El total acumulado se reinicia en un anclaje que usted elige — diario, semanal o mensual — de modo que la lectura siempre es relativa a la sesión

Narayanan Mohanan Mohanan Krishnan
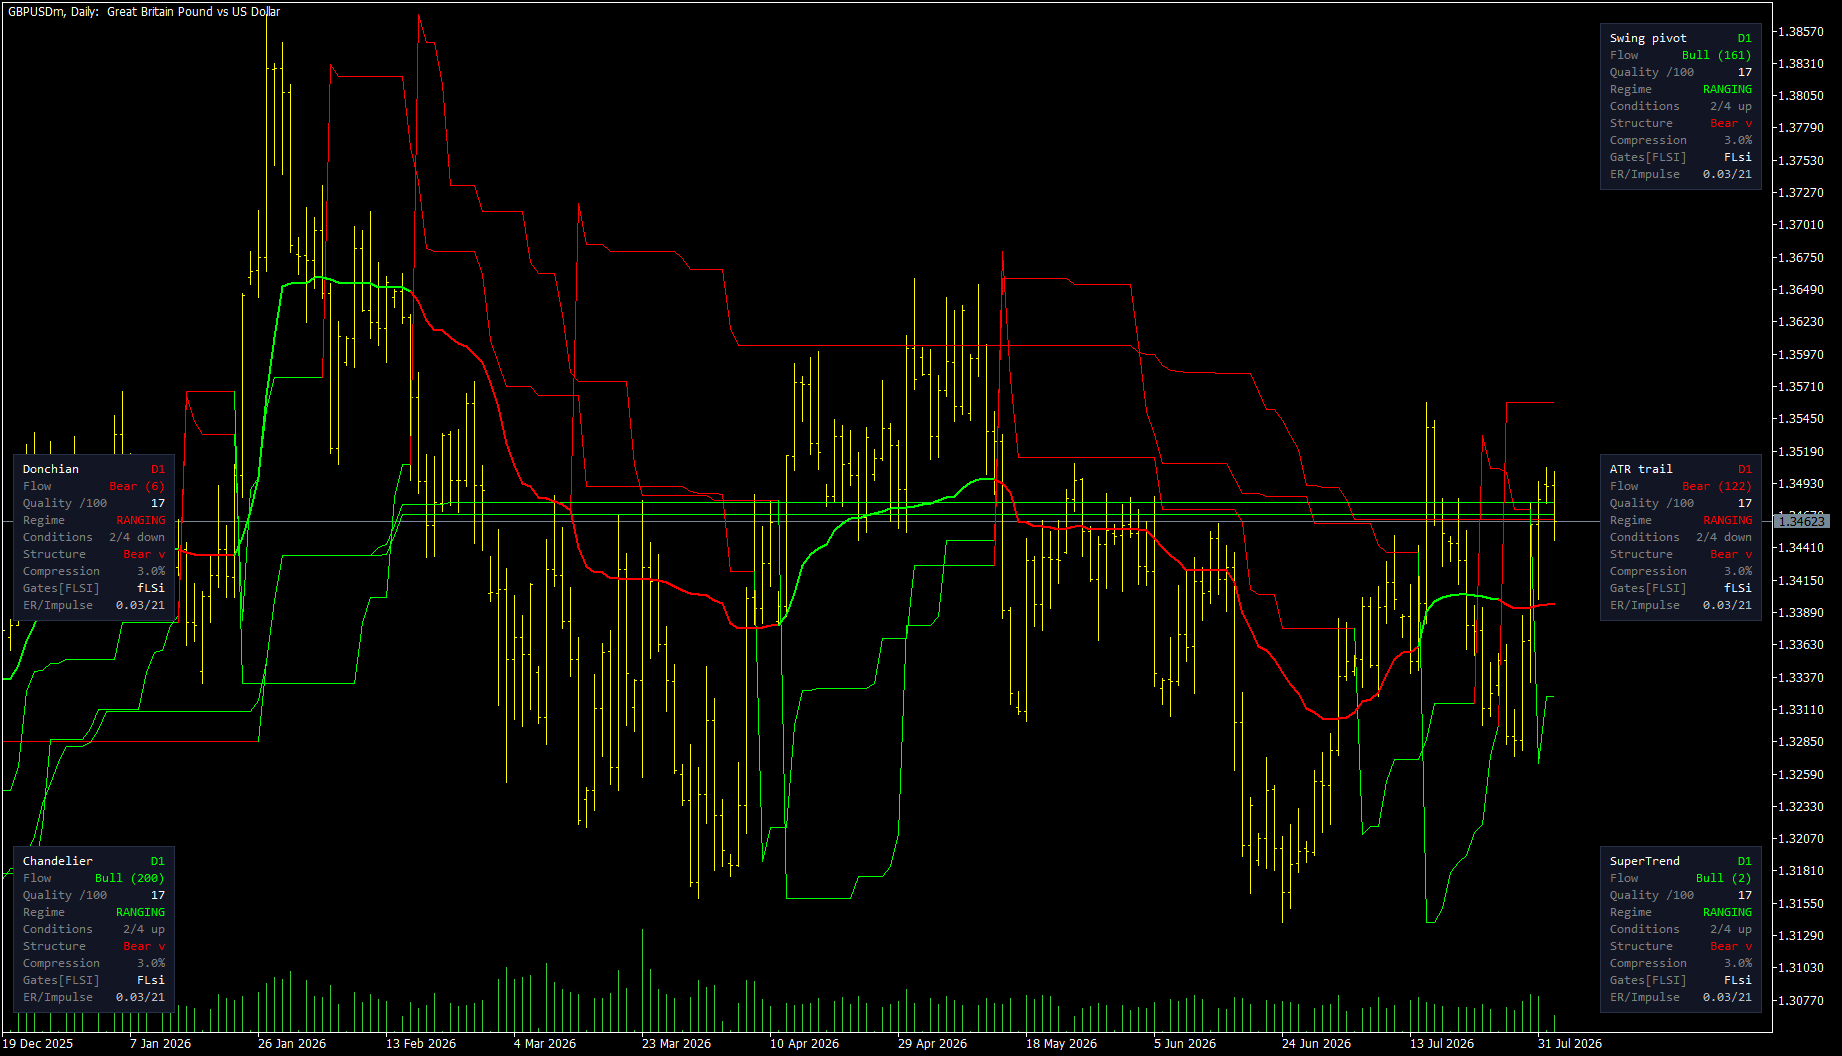
Five trailing stops on one chart. Three say up, two say down.

Same instrument, same daily bars, same settings. GBPUSD.

Swing pivot: bullish, 161 bars. Chandelier: bullish, 200 bars. SuperTrend: bullish, but only 2 bars — it just flipped. ATR trail: bearish, 122 bars. Donchian: bearish, 6 bars.

Five methods, three answers up and two down, and none of them is wrong.

They disagree because they anchor to different things. A trailing stop has to decide what it is trailing behind, and that choice is the whole method:

The swing pivot sits where the market last turned. The ATR trail keeps a fixed volatility distance from a smoothed average. SuperTrend brackets each bar's median price and flips when the close crosses. Chandelier hangs from the highest point of the move so far. Donchian uses only the highest high and lowest low, with no volatility term at all.

Four of those five use ATR. One doesn't. That is deliberate — a single ATR multiple is one opinion about how much room to give, and it is a famously poor one at the moments that matter most, when volatility is compressed right before it expands.

The interesting part is not which method is right. It is that all five panels agree the regime is ranging.

That is what a rangebound market looks like when you measure it five ways: the methods scatter. In a strong trend they converge — same chart, different period, they sit within a narrow band of each other.

So the spread between them carries information that no single stop level does. Wide spread, no structure to anchor to. Narrow spread, the market is doing something all five can agree on.

I have not tested whether that spread predicts anything, and I would want a few thousand samples before saying it does. But as a description of the present it is more honest than any one line.

All five methods are in one indicator — Structure Flow and Trailing Stop, on the MQL5 Market.

#quantitativefinance #algorithmictrading #mql5 #tradingsystems #forex #technicalanalysis
Narayanan Mohanan Mohanan Krishnan Ha publicado el producto

Este indicador dibuja dos líneas sobre el gráfico de precios: una línea de flujo adaptativa que sigue la dirección del mercado, y un stop dinámico que se mueve únicamente en esa dirección y nunca hacia atrás. Un pequeño panel informa del estado que hay detrás de ambas. El stop dinámico puede calcularse de cinco formas distintas. No son variaciones de una misma idea: cada una se ancla a algo diferente y, en el mismo gráfico, discrepan con frecuencia. La línea de flujo Una media adaptativa

Narayanan Mohanan Mohanan Krishnan Ha publicado el producto

Este indicador aplica la construcción de convergencia/divergencia —media móvil rápida menos lenta, con una línea de señal— a una serie derivada del volumen en lugar de al precio. Hay tres fuentes seleccionables: Delta de Volumen Acumulado, Índice de Fuerza y On Balance Volume. Sobre el resultado se trazan bandas de volatilidad adaptativas, y cada barra cerrada se clasifica en uno de cinco estados de régimen. Ese estado se expone como un búfer numérico, de modo que un Asesor Experto puede leerlo

Narayanan Mohanan Mohanan Krishnan
MACD and OBVCD on the same settings — Bitcoin weekly, 2019 to 2026

Both panes below use 50, 200, 20. The lower one is the standard MetaTrader MACD, computed on price. The upper one is the same construction computed on On Balance Volume — so it measures the convergence and divergence of accumulated volume rather than of price itself.

The chart covers two full Bitcoin cycles.

What I find interesting is not that one leads the other. It is that they answer different questions.

The MACD histogram tracks price momentum, and on a weekly chart across seven years it does that cleanly. But it is describing something you can already see by looking at the candles above it.

The OBV version is describing whether volume was accumulating or distributing while that price move happened. Through 2024 and into 2025 the histogram runs green and expanding — volume building alongside the advance. The turn to red at the right edge comes as that accumulation reverses.

The five colours are the part I actually use. Green above the upper band means momentum expanding; light green means still above the band but fading; grey means inside the bands, no regime; orange and red are the bearish equivalents. The bands are a 20-period standard deviation on the histogram itself, so they widen and contract with activity instead of relying on fixed levels.

That state is also exposed as a buffer — values +2 to −2 — so an EA can read the regime directly rather than re-deriving it from the plot.

Neither indicator predicts anything. Both are descriptive: they tell you what has happened to price momentum and to volume momentum respectively. I mention that because the interesting part of this chart is the disagreement between the two panes, not a signal from either.

Free demo on the product page, and the buffer map is documented in the description.

Five MT5 indicators published, three of them free — currency strength, Force Index, and volume delta, all with documented buffers. Happy to answer questions about any of the calculations.

Five MT5 indicators published, three of them free — currency strength, Force Index, and volume delta, all with documented buffers. Happy to answer questions about any of the calculations.

https://www.mql5.com/en/users/naamo/seller
12