Narayanan Mohanan Mohanan Krishnan
  • Information
nein
Erfahrung
18
Produkte
0
Demoversionen
0
Jobs
0
Signale
0
Abonnenten
ML/Python/MQL Developer in Independent
Ich baue Messwerkzeuge für MetaTrader. Sie beschreiben, was der Markt getan hat, und nennen die Grenzen jeder Messung, statt sie zu verschweigen.

Dreißig Jahre Bau von Produktions- und Automatisierungssystemen, 2020 in quantitative Arbeit umgelenkt. Meine Forschung läuft in Python — Backtesting-Frameworks, Walk-Forward-Validierung, statistische Auswertung großer Kandidatenmengen — und was das übersteht, wird zu einem Indikator oder einem Expert Advisor. Das Prinzip ist Falsifikation zuerst: Ein Ergebnis gilt als Artefakt, bis es sich außerhalb der Stichprobe behauptet. Was in dieses Sortiment gelangt, trägt die Grenzen seiner eigenen Messung mit sich, benennt, wo ein Wert aufhört aussagekräftig zu sein, und dokumentiert die Stellen, an denen zwei Plattformen voneinander abweichen, statt sie stillschweigend zu mitteln.
Nichts von dem, was hier veröffentlicht ist, erzeugt Handelssignale, und nichts hier enthält eine Aussage über Performance.
____________________________________________________________________
🔬 MEASUREMENT — point it at any indicator and read what it actually does
▸ Indicator Test Report · 🆓 · MT5 — twelve checks, a plain-language report https://www.mql5.com/en/market/product/191061
▸ Indicator Test Report MT4 · 🆓 · MT4 https://www.mql5.com/en/market/product/192010
____________________________________________________________________
📊 CURRENCY STRENGTH — the eight majors decomposed from all 28 pairs
▸ Multi Timeframe Currency Strength Panel · 🆓 · MT5 https://www.mql5.com/en/market/product/188552
▸ MTF Currency Strength Panel MT4 · 🆓 · MT4 https://www.mql5.com/en/market/product/189304
▸ Currency Strength Oscillator MT5 · $39 · MT5 — the same decomposition as a history https://www.mql5.com/en/market/product/188624
▸ Currency Strength Oscillator MT4 · $39 · MT4 https://www.mql5.com/en/market/product/189507
____________________________________________________________________
📈 VOLUME AND ORDER FLOW
▸ Anchored Volume Delta with Adaptive Bands · 🆓 · MT5 https://www.mql5.com/en/market/product/188383
▸ Anchored Volume Delta with Adaptive Bands MT4 · 🆓 · MT4 https://www.mql5.com/en/market/product/188916
▸ OBVCD Pro · $49 · MT5 https://www.mql5.com/en/market/product/172855
▸ OBVCD Pro MT4 · $49 · MT4 https://www.mql5.com/en/market/product/189055
____________________________________________________________________
⚡ MOMENTUM AND VOLATILITY
▸ Force Index with Adaptive Volatility Bands · 🆓 · MT5 https://www.mql5.com/en/market/product/188434
▸ Force Index with Adaptive Volatility Bands MT4 · 🆓 · MT4 https://www.mql5.com/en/market/product/189058
____________________________________________________________________
🔍 REGIME AND STRUCTURE
▸ Oscillator Regime Suite · $89 · MT5 https://www.mql5.com/en/market/product/188673
▸ Oscillator Regime Suite MT4 · $89 · MT4 https://www.mql5.com/en/market/product/189783
▸ Structure Flow and Trailing Stop · $99 · MT5 https://www.mql5.com/en/market/product/188849
▸ Structure Flow and Trailing Stop MT4 · $99 · MT4 https://www.mql5.com/en/market/product/190923
____________________________________________________________________
📐 TREND PERSISTENCE — how often the current state has survived to the next bar
▸ Trend Survival States · 🆓 · MT5 — the five-state classification https://www.mql5.com/en/market/product/190790
▸ Trend Survival Rate · $99 · MT5 — adds the survival rate and a Brier forecast score https://www.mql5.com/en/market/product/190792
____________________________________________________________________
🧪 TESTUMGEBUNG
Alles hier wird auf Exness entwickelt und getestet, auf einem Live-Terminal mit allen 28 Hauptwährungspaaren und einer von M1 bis MN1 geprüften Historientiefe — einschließlich der Datenlücken, die ich gefunden und in der Beschreibung des Currency Strength Oscillator dokumentiert habe, statt sie einem Käufer zu überlassen. Ich bin Introducing Broker für Exness; wenn Sie über meinen Link ein Konto eröffnen, erhalte ich eine Provision, und Sie sollten einen Broker nach Ihren eigenen Kriterien wählen, nicht nach meinen. Dieses Profil wird weder von Exness betrieben noch gehört es Exness.

▸ Konto eröffnen: https://one.exnessonelink.com/a/d3zld339yo
______________________________________________________________________________________________________________
✉️ Fragen zu den Berechnungen, den Puffern oder zum Einsatz neben Ihren eigenen Werkzeugen — schreiben Sie mir eine Nachricht. Ich antworte.
Narayanan Mohanan Mohanan Krishnan Hat ein Produkt angeboten

Indicator Test Report für MetaTrader 5 – ein Repaint-Checker und Indikatortester, der zeigt, wie sich ein Indikator tatsächlich verhält Sie können nicht in einen kompilierten Indikator hineinsehen. Der Indikatortestbericht lädt jeden Indikator – gekauft, geschrieben oder in MetaTrader integriert – und beantwortet die Frage, die eine Beschreibung nicht beantworten kann: Wird er neu gezeichnet, wie viel Historie benötigt er und was veröffentlicht er wirklich? Es meldet Verhalten. Es wird nicht

Narayanan Mohanan Mohanan Krishnan Hat ein Produkt angeboten

Indicator Test Report für MetaTrader 4 – ein MT4-Repaint-Checker und Indikatortester, der zeigt, wie sich ein Indikator tatsächlich verhält Sie können nicht in einen kompilierten Indikator hineinsehen. Der Indikatortestbericht lädt jeden Indikator – gekauft, geschrieben oder in MetaTrader integriert – und beantwortet die Frage, die eine Beschreibung nicht beantworten kann: Wird er neu gezeichnet, wie viel Historie benötigt er und was veröffentlicht er wirklich? Es meldet Verhalten. Es wird nicht

Narayanan Mohanan Mohanan Krishnan Hat ein Produkt angeboten

Structure Flow und Trailing Stop MT4 – eine adaptive Flow-Linie mit fünf Trailing-Stop-Methoden, Marktstruktur und Liquiditätsbändern für MetaTrader 4 Fünf Trailing-Stop-Methoden, eine adaptive Flusslinie und ein Bedingungsfeld, das anzeigt, wie viele Messungen übereinstimmen. Dieser Indikator zeichnet zwei Linien auf dem Preisdiagramm: eine adaptive Flusslinie, die der Marktrichtung folgt, und einen Trailing Stop, der sich nur in diese Richtung und nie zurück bewegt. Ein kleines Gremium

Narayanan Mohanan Mohanan Krishnan
Crude oil closed at 81.518 on Friday. Three charts of the same instrument, three different measurements, and they do not agree with each other. That is not a fault in any of them. It is what happens when you ask three questions that only sound like the same question...
Narayanan Mohanan Mohanan Krishnan Hat ein Produkt angeboten

Trend Survival States für MetaTrader 5 – ein Indikator für das freie Marktregime, der den Bullen- und Bärendruck mit adaptiven Volatilitätsbändern und einer Fünf-Zustands-Trendklassifizierung misst Bullen- und Bärendruck, ein adaptiver Band-Spread und eine Fünf-Staaten-Marktklassifizierung, kostenlos für MT5. Es misst den Kauf- und Verkaufsdruck hinter der aktuellen Bewegung und klassifiziert ihn in einen Marktzustand: starker Bullenmarkt, schwacher Bullenmarkt, neutral, schwacher Bärenmarkt

Narayanan Mohanan Mohanan Krishnan Hat ein Produkt angeboten

Trend-Überlebensrate für MetaTrader 5 – ein Marktregime-Indikator, der misst, wie oft der aktuelle Trendzustand bis zum nächsten Balken überlebt hat, und seine eigene Prognose bewertet Trendüberlebensrate, Marktzustandsklassifizierung und ein Live-Brier-Prognosewert in einem MT5-Indikatorfenster. Es misst den Kauf- und Verkaufsdruck hinter der aktuellen Bewegung, ordnet ihn einem Marktzustand zu und gibt an, wie oft dieser Zustand bis zum nächsten Balken überlebt hat – und vergleicht dann seine

Narayanan Mohanan Mohanan Krishnan
Three charts of the same instrument, the same indicator and the same settings. Force Index with adaptive volatility bands at 13, 20 and 2.0 deviations, on BTCUSD monthly, weekly and daily. The Force Index on the closed daily bar of 12 August reads −11,252,859.29...
Narayanan Mohanan Mohanan Krishnan Hat ein Produkt angeboten

Dieser Indikator wendet die Konvergenz/Divergenz-Konstruktion — schneller gleitender Durchschnitt minus langsamer, mit einer Signallinie — auf eine aus dem Volumen abgeleitete Reihe an statt auf den Preis. Drei Quellen stehen zur Auswahl: kumulatives Volumendelta, Force Index und On Balance Volume. Über das Ergebnis werden adaptive Volatilitätsbänder gelegt, und jeder abgeschlossene Bar wird einem von fünf Regimezuständen zugeordnet. Dieser Zustand steht als numerischer Puffer zur Verfügung

Narayanan Mohanan Mohanan Krishnan
A daily XAUUSD chart can look fairly simple until several independent measurements are placed beside the price. On the chart below, gold has recovered from the July decline...
Narayanan Mohanan Mohanan Krishnan Hat ein Produkt angeboten

Währungsstärke-Oszillator für MetaTrader 4 Ein Indikator für die relative Währungsstärke, der die Geschichte der acht Hauptwährungen darstellt. Dieser Währungsstärke-Oszillator stellt die relative Stärke der acht Hauptwährungen als Verlauf dar, zerlegt aus dem 28 Hauptpaare. Während ein Standard-Währungsstärkemesser Ihnen sagt, wo die Dinge gerade stehen, zeigt dieser Ihnen, wie sie dorthin gekommen sind – welche Währung gestärkt wurde, welche sich verändert hat und wo die Rangfolge den Besitzer

Narayanan Mohanan Mohanan Krishnan Hat ein Produkt angeboten

MTF Currency Strength Panel for MetaTrader 4 Multi-Timeframe-Währungsstärke-Indikator: alle 28 Hauptwährungspaare auf einem Chart. Dieses Währungsstärke-Panel zeigt, wo die acht wichtigsten Währungen gerade stehen und wie sich jedes der 28 Hauptwährungspaare über neun Zeiteinheiten hinweg bewegt hat — von M1 bis MN1. Beide Ansichten liegen auf einem Chart und werden über einen Timer aktualisiert. Die alleinige Einstufung von Paaren ist irreführend. Wenn sich eine einzelne Währung bewegt, bewegt

Narayanan Mohanan Mohanan Krishnan
Elder's Force Index is one of the few classical indicators that combines price and volume in a single line. Each bar contributes (close − previous close) × volume. Positive when buyers carried the bar, negative when sellers did, and proportional to how much was traded doing it...
Narayanan Mohanan Mohanan Krishnan
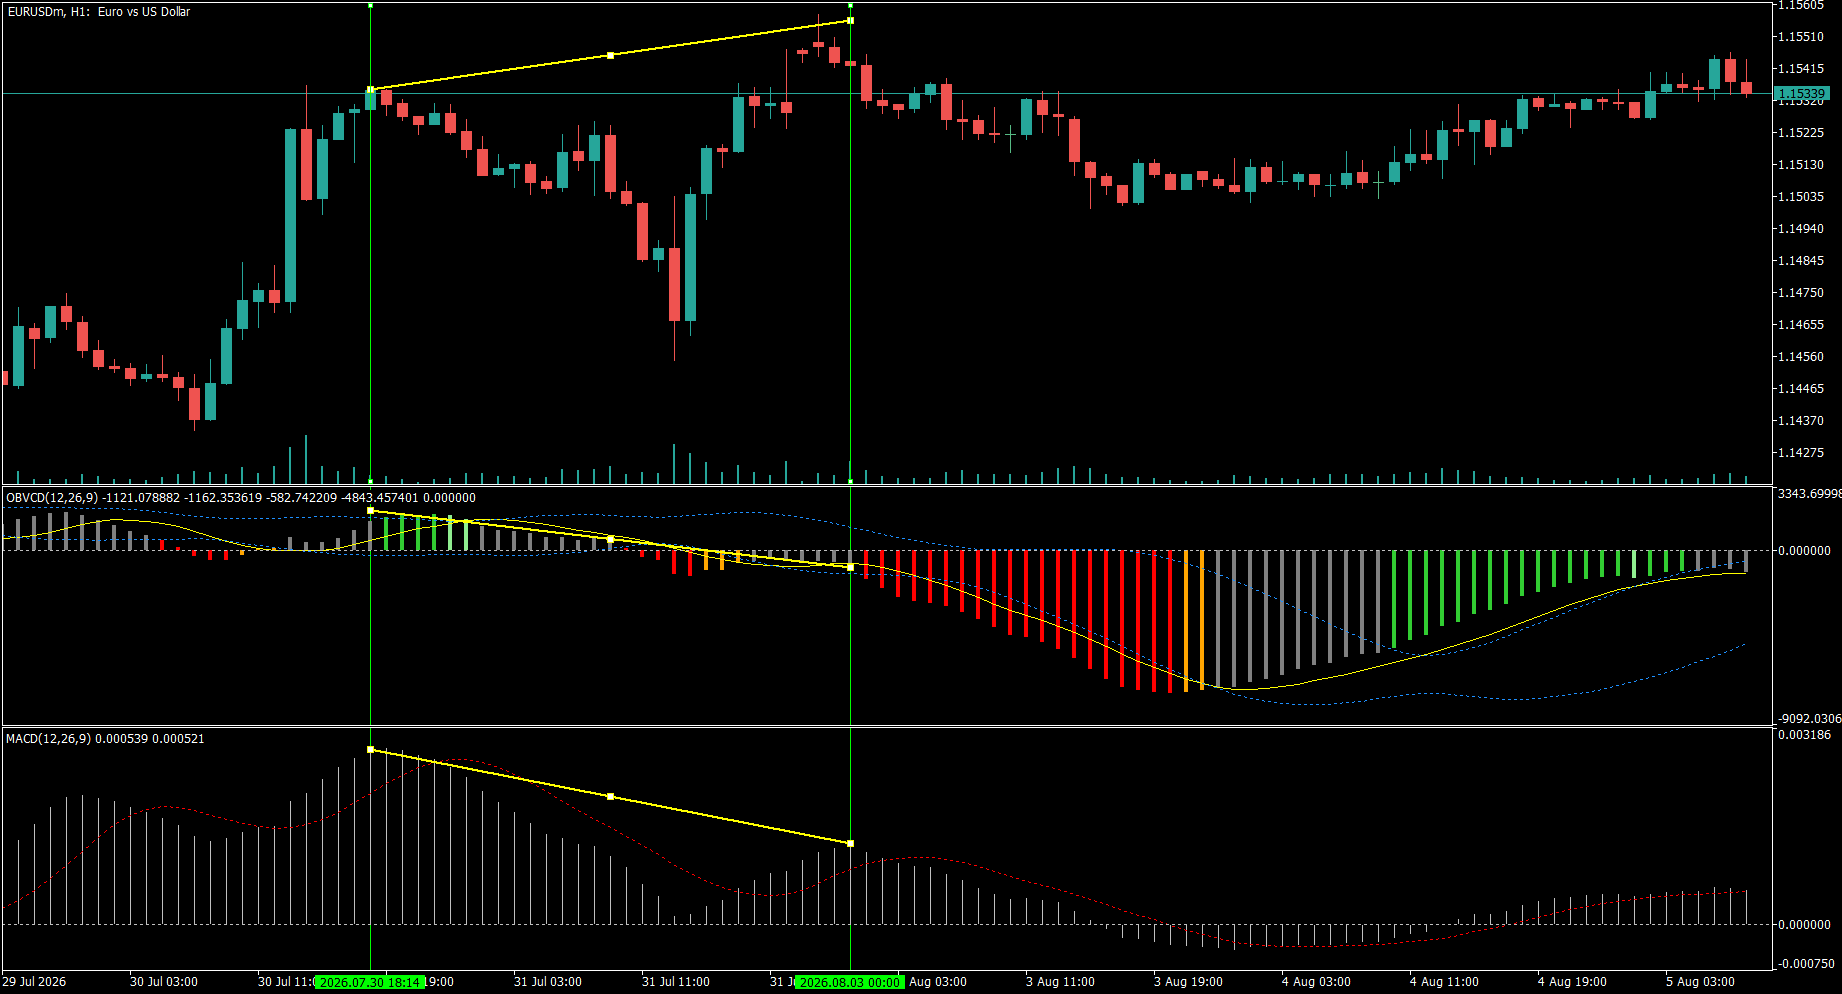
EURUSD H1 — the same divergence, two different answers

Between 30 July and 3 August, price made a higher high. Standard MACD made a lower high. So did OBVCD — the same 12/26/9 construction applied to On-Balance Volume instead of price. Both oscillators disagreed with price, and MACD showed the divergence more steeply of the two.

Then they parted company. At the second marked line OBVCD had crossed below zero — reading -1121 against its signal at -1162. MACD at the same bar was still positive: +0.000539, signal +0.000521. Price rolled over afterwards.

That difference is the whole point of the pane. A divergence is a statement about slope: the new high was made with less momentum than the last. A zero-line cross is a statement about state: the fast average has fallen below the slow one, so the underlying series has actually turned. Price momentum had not turned yet. Cumulative volume flow had.

Neither reading is a signal to act, and the same chart shows why — follow it right and the decline exhausts, OBVCD climbs back through zero, and the histogram turns green again. That is the honest shape of it.

Descriptive, not predictive. One instance on one instrument, shown because the sequence is legible, not because it repeats.

#EURUSD #OBVCD #MACD #divergence #volume #technicalanalysis #MT5 #MT4
Narayanan Mohanan Mohanan Krishnan Hat ein Produkt angeboten

Dieser Indikator stellt die dar Kraftindex – die Preisänderung jedes Barrens multipliziert mit seinem Volumen – innerhalb adaptiver Standardabweichungsbänder. Während der Preis allein sagt, dass sich ein Markt bewegt hat, sagt Ihnen der Force-Index, wie viel Aufwand in die Bewegung geflossen ist. Eine große Preisänderung bei geringem Volumen und eine kleine Änderung bei großem Volumen sind sehr unterschiedliche Ereignisse, selbst wenn die Kerzen ähnlich aussehen. Der Force Index trennt sie

Narayanan Mohanan Mohanan Krishnan Hat ein Produkt angeboten

49.00 USD

OBVCD Pro ist ein Impulsoszillator, der eine Konvergenz-/Divergenzanalyse anwendet Bilanzvolumen (OBV) Anstelle des Preises werden adaptive Volatilitätsbänder mit einem 5-stufigen Regimeklassifikator kombiniert, der visuell auf dem Diagramm abgelesen oder direkt von einem Expert Advisor genutzt werden kann. Die meisten klassischen Oszillatoren analysieren allein den Preis. OBVCD Pro berechnet Konvergenz und Divergenz aus dem kumulativen Volumenfluss und misst so die Beteiligung an einer

Narayanan Mohanan Mohanan Krishnan Hat ein Produkt angeboten

Dieser Indikator zeichnet das kumulative Volumendelta (CVD) — die laufende Summe des Volumens jeder Kerze, vorzeichenbehaftet nach der Richtung ihres Schlusskurses — innerhalb adaptiver Standardabweichungsbänder. Er beantwortet eine Frage, die der Kurs allein nicht beantwortet: Wird die Bewegung von Beteiligung getragen, oder treibt sie nur dahin? Die laufende Summe beginnt an einem Anker neu, den Sie wählen — täglich, wöchentlich oder monatlich —, sodass sich die Anzeige immer auf die aktuelle

Narayanan Mohanan Mohanan Krishnan
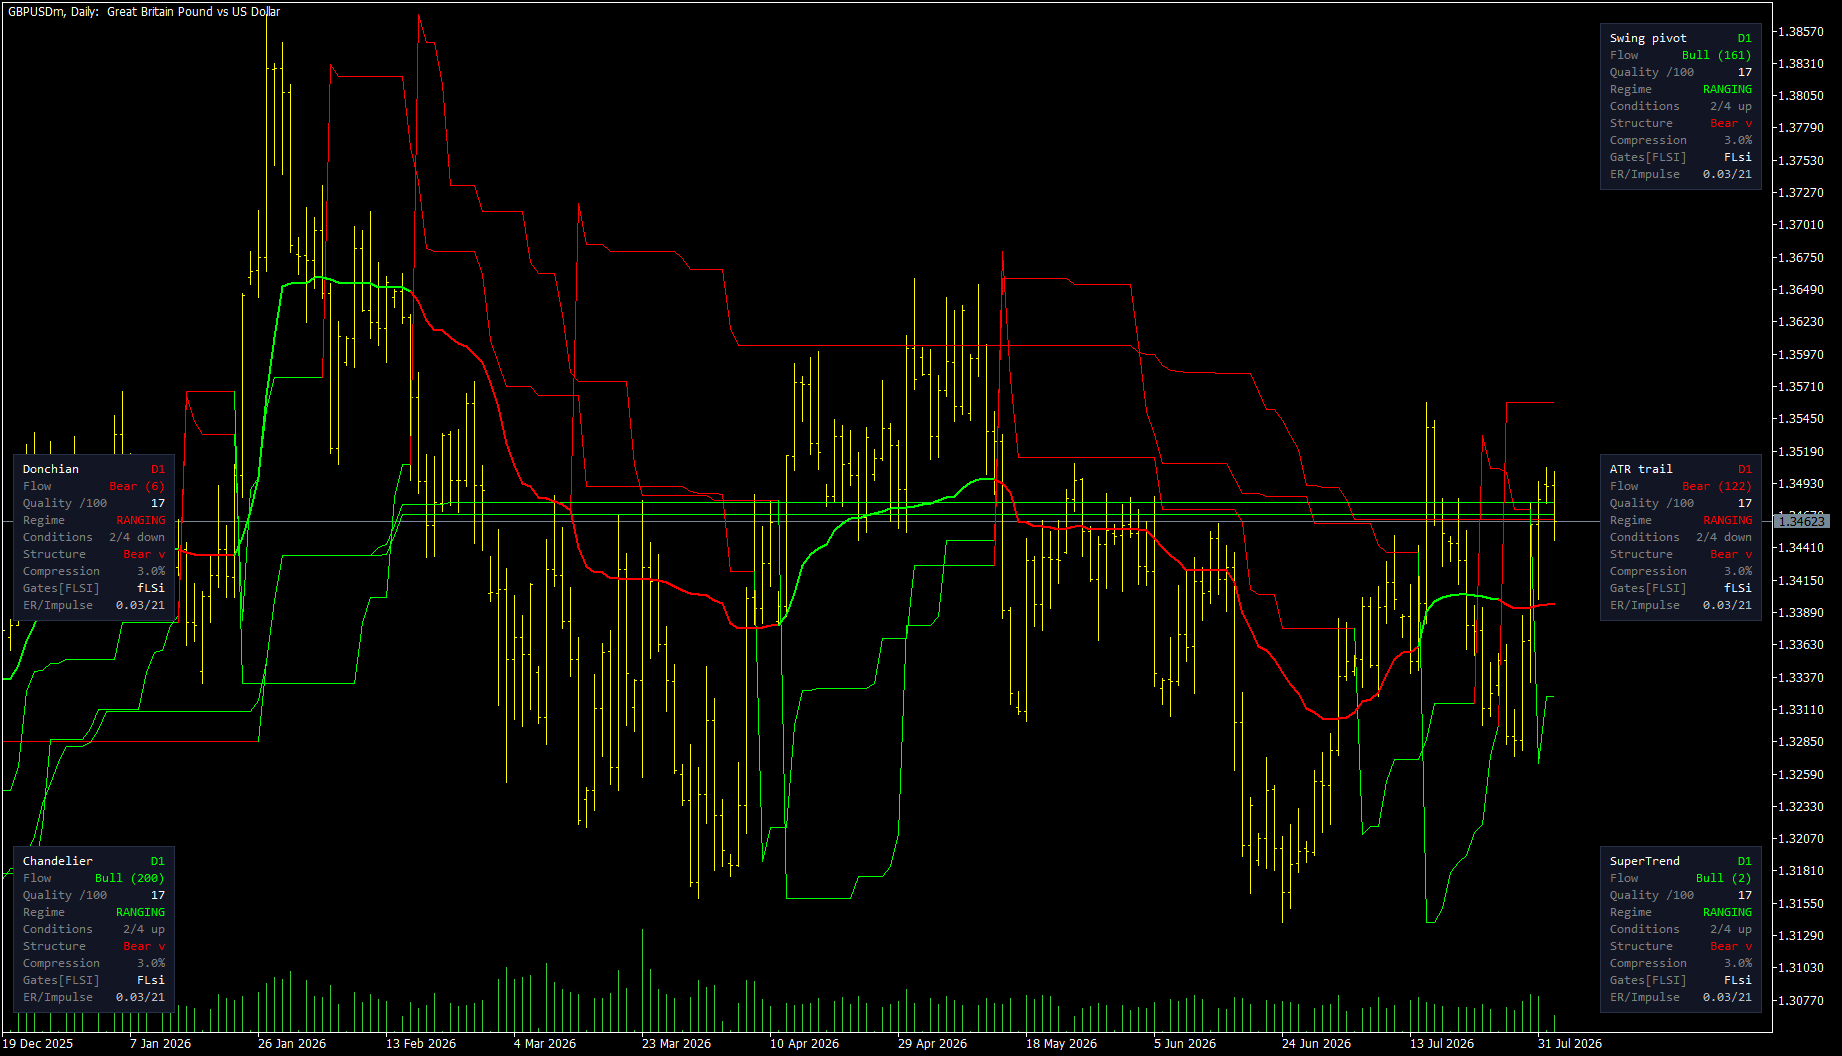
Five trailing stops on one chart. Three say up, two say down.

Same instrument, same daily bars, same settings. GBPUSD.

Swing pivot: bullish, 161 bars. Chandelier: bullish, 200 bars. SuperTrend: bullish, but only 2 bars — it just flipped. ATR trail: bearish, 122 bars. Donchian: bearish, 6 bars.

Five methods, three answers up and two down, and none of them is wrong.

They disagree because they anchor to different things. A trailing stop has to decide what it is trailing behind, and that choice is the whole method:

The swing pivot sits where the market last turned. The ATR trail keeps a fixed volatility distance from a smoothed average. SuperTrend brackets each bar's median price and flips when the close crosses. Chandelier hangs from the highest point of the move so far. Donchian uses only the highest high and lowest low, with no volatility term at all.

Four of those five use ATR. One doesn't. That is deliberate — a single ATR multiple is one opinion about how much room to give, and it is a famously poor one at the moments that matter most, when volatility is compressed right before it expands.

The interesting part is not which method is right. It is that all five panels agree the regime is ranging.

That is what a rangebound market looks like when you measure it five ways: the methods scatter. In a strong trend they converge — same chart, different period, they sit within a narrow band of each other.

So the spread between them carries information that no single stop level does. Wide spread, no structure to anchor to. Narrow spread, the market is doing something all five can agree on.

I have not tested whether that spread predicts anything, and I would want a few thousand samples before saying it does. But as a description of the present it is more honest than any one line.

All five methods are in one indicator — Structure Flow and Trailing Stop, on the MQL5 Market.

#quantitativefinance #algorithmictrading #mql5 #tradingsystems #forex #technicalanalysis
Narayanan Mohanan Mohanan Krishnan Hat ein Produkt angeboten

Dieser Indikator zeichnet zwei Linien in den Kurschart: eine adaptive Flusslinie, die der Richtung des Marktes folgt, und einen Trailing-Stop, der sich nur in diese Richtung bewegt und niemals zurück. Ein kleines Panel zeigt den Zustand, der dahintersteht. Der Trailing-Stop lässt sich auf fünf verschiedene Arten berechnen. Das sind keine Varianten einer Idee — jede verankert sich an etwas anderem, und auf demselben Chart widersprechen sie einander häufig. Die Flusslinie Ein adaptiver

Narayanan Mohanan Mohanan Krishnan Hat ein Produkt angeboten

Dieser Indikator wendet die Konvergenz/Divergenz-Konstruktion — schneller gleitender Durchschnitt minus langsamer, mit einer Signallinie — auf eine aus dem Volumen abgeleitete Reihe an statt auf den Preis. Drei Quellen stehen zur Auswahl: kumulatives Volumendelta, Force Index und On Balance Volume. Über das Ergebnis werden adaptive Volatilitätsbänder gelegt, und jeder abgeschlossene Bar wird einem von fünf Regimezuständen zugeordnet. Dieser Zustand steht als numerischer Puffer zur Verfügung

Narayanan Mohanan Mohanan Krishnan
MACD and OBVCD on the same settings — Bitcoin weekly, 2019 to 2026

Both panes below use 50, 200, 20. The lower one is the standard MetaTrader MACD, computed on price. The upper one is the same construction computed on On Balance Volume — so it measures the convergence and divergence of accumulated volume rather than of price itself.

The chart covers two full Bitcoin cycles.

What I find interesting is not that one leads the other. It is that they answer different questions.

The MACD histogram tracks price momentum, and on a weekly chart across seven years it does that cleanly. But it is describing something you can already see by looking at the candles above it.

The OBV version is describing whether volume was accumulating or distributing while that price move happened. Through 2024 and into 2025 the histogram runs green and expanding — volume building alongside the advance. The turn to red at the right edge comes as that accumulation reverses.

The five colours are the part I actually use. Green above the upper band means momentum expanding; light green means still above the band but fading; grey means inside the bands, no regime; orange and red are the bearish equivalents. The bands are a 20-period standard deviation on the histogram itself, so they widen and contract with activity instead of relying on fixed levels.

That state is also exposed as a buffer — values +2 to −2 — so an EA can read the regime directly rather than re-deriving it from the plot.

Neither indicator predicts anything. Both are descriptive: they tell you what has happened to price momentum and to volume momentum respectively. I mention that because the interesting part of this chart is the disagreement between the two panes, not a signal from either.

Free demo on the product page, and the buffer map is documented in the description.

Five MT5 indicators published, three of them free — currency strength, Force Index, and volume delta, all with documented buffers. Happy to answer questions about any of the calculations.

Five MT5 indicators published, three of them free — currency strength, Force Index, and volume delta, all with documented buffers. Happy to answer questions about any of the calculations.

https://www.mql5.com/en/users/naamo/seller
12