Narayanan Mohanan Mohanan Krishnan
  • 情報
no
経験
18
製品
0
デモバージョン
0
ジョブ
0
シグナル
0
購読者
ML/Python/MQL Developer において Independent
私は MetaTrader 向けの測定ツールを作っています。相場が何をしてきたかを記述し、各測定の限界を隠さずに明示します。

三十年にわたる生産システムと自動化の構築経験を、2020年に定量的な研究へ振り向けました。研究は Python で行っています。バックテスト基盤、ウォークフォワード検証、多数の候補に対する統計的評価——それらを生き延びたものだけがインジケーターまたはエキスパートアドバイザーになります。方針は反証優先です。結果はサンプル外で持ちこたえるまで、まやかしとして扱います。この棚に並ぶものは、自らの測定の限界を明記し、読み取り値が意味を失う地点を示し、二つのプラットフォームが食い違う箇所を、黙って平均するのではなく記録します。
ここで公開しているものはいずれも売買シグナルを出さず、成績に関する主張も一切ありません。
____________________________________________________________________
🔬 MEASUREMENT — point it at any indicator and read what it actually does
▸ Indicator Test Report · 🆓 · MT5 — twelve checks, a plain-language report https://www.mql5.com/en/market/product/191061
▸ Indicator Test Report MT4 · 🆓 · MT4 https://www.mql5.com/en/market/product/192010
____________________________________________________________________
📊 CURRENCY STRENGTH — the eight majors decomposed from all 28 pairs
▸ Multi Timeframe Currency Strength Panel · 🆓 · MT5 https://www.mql5.com/en/market/product/188552
▸ MTF Currency Strength Panel MT4 · 🆓 · MT4 https://www.mql5.com/en/market/product/189304
▸ Currency Strength Oscillator MT5 · $39 · MT5 — the same decomposition as a history https://www.mql5.com/en/market/product/188624
▸ Currency Strength Oscillator MT4 · $39 · MT4 https://www.mql5.com/en/market/product/189507
____________________________________________________________________
📈 VOLUME AND ORDER FLOW
▸ Anchored Volume Delta with Adaptive Bands · 🆓 · MT5 https://www.mql5.com/en/market/product/188383
▸ Anchored Volume Delta with Adaptive Bands MT4 · 🆓 · MT4 https://www.mql5.com/en/market/product/188916
▸ OBVCD Pro · $49 · MT5 https://www.mql5.com/en/market/product/172855
▸ OBVCD Pro MT4 · $49 · MT4 https://www.mql5.com/en/market/product/189055
____________________________________________________________________
⚡ MOMENTUM AND VOLATILITY
▸ Force Index with Adaptive Volatility Bands · 🆓 · MT5 https://www.mql5.com/en/market/product/188434
▸ Force Index with Adaptive Volatility Bands MT4 · 🆓 · MT4 https://www.mql5.com/en/market/product/189058
____________________________________________________________________
🔍 REGIME AND STRUCTURE
▸ Oscillator Regime Suite · $89 · MT5 https://www.mql5.com/en/market/product/188673
▸ Oscillator Regime Suite MT4 · $89 · MT4 https://www.mql5.com/en/market/product/189783
▸ Structure Flow and Trailing Stop · $99 · MT5 https://www.mql5.com/en/market/product/188849
▸ Structure Flow and Trailing Stop MT4 · $99 · MT4 https://www.mql5.com/en/market/product/190923
____________________________________________________________________
📐 TREND PERSISTENCE — how often the current state has survived to the next bar
▸ Trend Survival States · 🆓 · MT5 — the five-state classification https://www.mql5.com/en/market/product/190790
▸ Trend Survival Rate · $99 · MT5 — adds the survival rate and a Brier forecast score https://www.mql5.com/en/market/product/190792
____________________________________________________________________
🧪 テスト環境
ここにあるものはすべて Exness で開発・検証しています。28の主要通貨ペアがすべて利用できるライブ端末で、M1 から MN1 までの履歴の深さを確認済みです。Currency Strength Oscillator の商品説明に記載したデータの欠落も、購入者に見つけさせるのではなく自分で見つけて記録しました。私は Exness の紹介ブローカーです。私のリンク経由で口座を開設された場合、私は報酬を受け取ります。ブローカーは私の基準ではなく、ご自身の基準で選んでください。このプロフィールは Exness が所有・運営するものではありません。

▸ 口座を開設する: https://one.exnessonelink.com/a/d3zld339yo

______________________________________________________________________________________________________________
✉️ 計算方法、バッファ、あるいはご自身のツールと併用する方法についてのご質問は、メッセージをお送りください。必ずお返事します。
Narayanan Mohanan Mohanan Krishnan パブリッシュされたプロダクト

MetaTrader 5 のIndicator Test Report — インジケーターが実際にどのように動作するかを示す再描画チェッカーおよびインジケーター テスター コンパイルされたインジケーターの内部を見ることはできません。Indicator Test Reportは、購入、作成、または MetaTrader に組み込まれたあらゆるインジケーターを読み込み、再描画するのか、どのくらいの履歴が必要なのか、実際に何を公開するのかなど、説明では説明できない質問に答えます。行動を報告してくれます。採点はしません。 ストラテジーテスターに​​任意のインジケーターをロードすると、その動作の 12 の側面に関する平易な言語のレポートが得られます。つまり、発行するバッファーの数、値が意味を持つ前にどれだけの履歴が必要か、閉じたバーの値がその後変更されるかどうか、読み取りにかかるコストなどです。 指標が優れているかどうかについてのスコアや合格点、評決はありません。観察されたことと、それが何を証明し、何が証明しないのかだけが考慮されます。 答えは何ですか 1. バッファー。

Narayanan Mohanan Mohanan Krishnan パブリッシュされたプロダクト

MetaTrader 4 のIndicator Test Report — インジケーターが実際にどのように動作するかを示す MT4 再描画チェッカーおよびインジケーター テスター コンパイルされたインジケーターの内部を見ることはできません。Indicator Test Reportは、購入、作成、または MetaTrader に組み込まれたあらゆるインジケーターを読み込み、再描画するのか、どのくらいの履歴が必要なのか、実際に何を公開するのかなど、説明では説明できない質問に答えます。行動を報告してくれます。採点はしません。 ストラテジーテスターに​​任意のインジケーターをロードすると、その動作の 12 の側面に関する平易な言語のレポートが得られます。つまり、発行するバッファーの数、値が意味を持つ前にどれだけの履歴が必要か、閉じたバーの値がその後変更されるかどうか、読み取りにかかるコストなどです。 指標が優れているかどうかについてのスコアや合格点、評決はありません。観察されたことと、それが何を証明し、何が証明しないのかだけが考慮されます。 答えは何ですか 1. バッファー。

Narayanan Mohanan Mohanan Krishnan パブリッシュされたプロダクト

ストラクチャーフローとトレーリングストップ MT4 — MetaTrader 4 の 5 つのトレーリングストップメソッド、市場構造、流動性バンドを備えた適応型フローライン 5 つのトレーリング ストップ手法、1 つの適応フロー ライン、および一致する測定値の数をレポートする条件パネル。 このインジケーターは、価格チャート上に 2 つの線を描きます。市場の方向に従う適応的なフロー ラインと、その方向にのみ移動し決して戻らないトレーリング ストップです。小さなパネルが彼らの背後の状況を報告します。 トレーリングストップは 5 つの異なる方法で計算できます。これらは 1 つのアイデアのバリエーションではありません。それぞれが異なるものを基にしており、同じチャート上で一致しないことがよくあります。 ストラクチャーフローとトレーリングストップも利用できます。 メタトレーダー5 。この MT4 ビルドはその直接ポートであり、バーごとに検証されています。比較についてはさらに下で説明します。 動線

Narayanan Mohanan Mohanan Krishnan
Crude oil closed at 81.518 on Friday. Three charts of the same instrument, three different measurements, and they do not agree with each other. That is not a fault in any of them. It is what happens when you ask three questions that only sound like the same question...
Narayanan Mohanan Mohanan Krishnan パブリッシュされたプロダクト

Trend Survival States for MetaTrader 5 — 適応ボラティリティバンドと 5 つの状態のトレンド分類を使用して強気圧力と弱気圧力を測定する自由市場体制インジケーター MT5 では、強気圧力と弱気圧力、適応バンド スプレッド、および 5 つの状態の市場分類が無料で利用できます。 現在の動きの背後にある売買圧力を測定し、それを市場の状態(強い強気、弱い強気、中立、弱い弱気、強い弱気)に分類します。 これは完全な体制の指標であり、期限付きの裁判や不自由なデモではありません。チャートに描かれているものはすべて完全な計算です。 有料版で追加されるもの。 トレンド生存率は、現在の状態が次のバーまで生き残った頻度を報告し、ブライアー スコアを使用して実際に起こったことに対して予測するスコアを示します。これら 2 つの数値とそれらを管理する設定は、この無料版には含まれていません。それ以外はすべて同一であり、両方を同じチャート上で同時に実行できるため、違いは説明されるのではなく、目に見える形で表示されます。 仕組み 2

Narayanan Mohanan Mohanan Krishnan パブリッシュされたプロダクト

MetaTrader 5 のトレンド生存率 — 現在のトレンド状態が次の足までどれだけの頻度で生き残るかを測定し、独自の予測をスコア化する市場体制指標 トレンド生存率、市場状態の分類、ライブ ブライアー予測スコアが 1 つの MT5 インジケーター ウィンドウに表示されます。 現在の動きの背後にある売買圧力を測定し、それを市場の状態に分類し、その状態が次の足までどのくらいの頻度で生き残ったかを報告し、実際に起こったことに対して独自の予測を格付けします。 ほとんどのインジケーターは、どのような状態かを示します。これは、その読書の後に同じ読書がどれくらいの頻度で行われているか、そして最近の読書の調子がどの程度であるかを示します。 無料バージョンは、Trend Survival States です。 同一の圧力、スプレッド、バンド、および 5 つの状態分類が描画されます。この有料バージョンでは、生存率と予測スコアが追加されます。両方を同じチャートで同時に実行できます。 仕組み 2 つの圧力コンポーネントが価格から計算されます。上部エンベロープと下部エンベロープであり、それぞれルックバック

Narayanan Mohanan Mohanan Krishnan
Three charts of the same instrument, the same indicator and the same settings. Force Index with adaptive volatility bands at 13, 20 and 2.0 deviations, on BTCUSD monthly, weekly and daily. The Force Index on the closed daily bar of 12 August reads −11,252,859.29...
Narayanan Mohanan Mohanan Krishnan パブリッシュされたプロダクト

本インジケーターは、収束/拡散の構成——短期移動平均から長期移動平均を引き、シグナルラインを添えたもの——を、価格ではなく 出来高から導かれる系列 に適用します。3つのソースから選択できます。累積出来高デルタ、フォースインデックス、オンバランスボリュームです。 その結果の上に適応型ボラティリティバンドを描画し、確定した各バーを5つのレジーム状態のいずれかに分類します。この状態は数値バッファとして公開されるため、エキスパートアドバイザーから直接読み取れます。 ソースが重要な理由 通常のMACDは価格モメンタムを測定しますが、それは上のローソク足を見れば概ね分かることです。この3つのソースが測るのは別のもの——その値動きが起きている間に、出来高が蓄積されていたのか、それとも放出されていたのかです。 3つは互いに置き換えられるものではありません。スクリーンショットの1つでは、同一のチャートに同一の設定で3つすべてを表示し、違いを並べて確認できるようにしています。 累積出来高デルタ —

Narayanan Mohanan Mohanan Krishnan
A daily XAUUSD chart can look fairly simple until several independent measurements are placed beside the price. On the chart below, gold has recovered from the July decline...
Narayanan Mohanan Mohanan Krishnan パブリッシュされたプロダクト

MetaTrader 4 の通貨強弱オシレーター 8 つのメジャーの歴史をプロットした相対通貨強さの指標。 この通貨強さオシレーターは、8 つの主要通貨の相対的な強さを履歴としてプロットし、 28 主要なペア。標準的な通貨強さのメーターは現在の状況を示しますが、これはどのようにしてそこに到達したか、つまりどの通貨が上昇し、どの通貨が反転し、どこでランキングが入れ替わったのかを示します。 8 つのシリーズはすべて文書化された指標バッファーとして公開されているため、エキスパートアドバイザーは MetaTrader 4 から通貨の強さを直接読み取ることができます。 分解の仕組み 8 つの通貨はそれぞれ、28 ペアのうち 7 つのペアに表示されます。その強さはこれら 7 つの読み取り値の平均であり、相場通貨である場合は符号が反転されます。 AUDJPY 円安ではなく円高を意味します。 すべてのペアは正確に 2 つの通貨に寄与し、基準値に対してプラス、相場に対してマイナスとなるため、セット全体でこれらの寄与は相殺され、8

Narayanan Mohanan Mohanan Krishnan パブリッシュされたプロダクト

MTF Currency Strength Panel for MetaTrader 4 マルチタイムフレーム通貨強度インジケーター。主要28通貨ペアを1つのチャートに集約します。 この通貨強度パネルは、主要8通貨の現在の位置関係と、主要28通貨ペアがM1からMN1までの9つの時間足でどのように動いてきたかを同時に表示します。両方の情報が1つのチャート上に並び、タイマーによって更新されます。 ペアを独自にランク付けすることは誤解を招きます。単一の通貨が変動すると、その通貨を含むすべての通貨ペアも変動するため、ペアのランキングのトップは同じ通貨が 7 回繰り返されることがよくあります。このパネルは、マトリックス全体を個別の通貨強さに分解することで、ドライバーを重複から分離します。 分解の仕組み 8 つの通貨はそれぞれ、28 ペアのうち 7 つのペアに表示されます。その強さはこれら 7 つの測定値の平均であり、相場通貨である場合は符号が反転されています。つまり、AUDJPY の下落は円安を意味するのではなく、円高を意味します。 すべてのペアは正確に 2

Narayanan Mohanan Mohanan Krishnan
Elder's Force Index is one of the few classical indicators that combines price and volume in a single line. Each bar contributes (close − previous close) × volume. Positive when buyers carried the bar, negative when sellers did, and proportional to how much was traded doing it...
Narayanan Mohanan Mohanan Krishnan
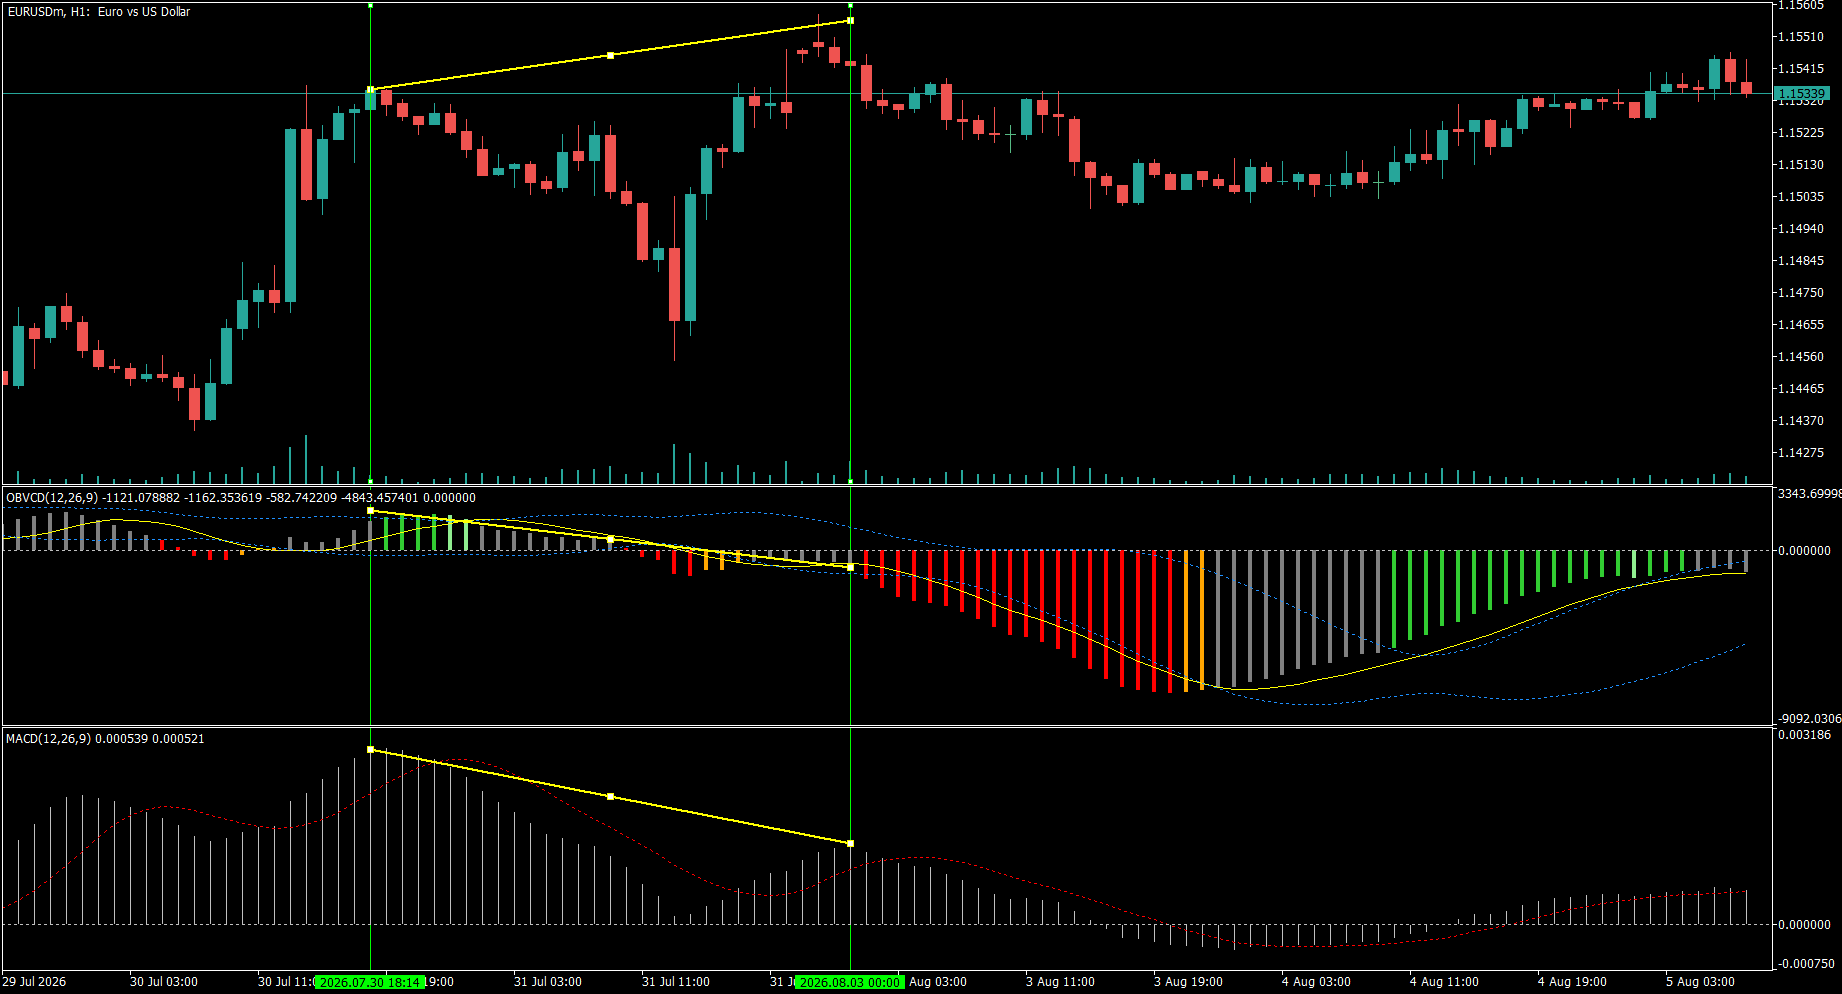
EURUSD H1 — the same divergence, two different answers

Between 30 July and 3 August, price made a higher high. Standard MACD made a lower high. So did OBVCD — the same 12/26/9 construction applied to On-Balance Volume instead of price. Both oscillators disagreed with price, and MACD showed the divergence more steeply of the two.

Then they parted company. At the second marked line OBVCD had crossed below zero — reading -1121 against its signal at -1162. MACD at the same bar was still positive: +0.000539, signal +0.000521. Price rolled over afterwards.

That difference is the whole point of the pane. A divergence is a statement about slope: the new high was made with less momentum than the last. A zero-line cross is a statement about state: the fast average has fallen below the slow one, so the underlying series has actually turned. Price momentum had not turned yet. Cumulative volume flow had.

Neither reading is a signal to act, and the same chart shows why — follow it right and the decline exhausts, OBVCD climbs back through zero, and the histogram turns green again. That is the honest shape of it.

Descriptive, not predictive. One instance on one instrument, shown because the sequence is legible, not because it repeats.

#EURUSD #OBVCD #MACD #divergence #volume #technicalanalysis #MT5 #MT4
Narayanan Mohanan Mohanan Krishnan パブリッシュされたプロダクト

このインジケーターは、 フォースインデックス — 各バーの価格変動にその出来高を乗算した値 — 適応標準偏差バンド内。価格だけで市場が動いたことがわかりますが、フォース指数は市場を動かすのにどれだけの努力が費やされたかを示します。 ローソク足が似ている場合でも、薄い出来高での大きな価格変化と、重い出来高での小さな変化は、まったく異なるイベントです。フォースインデックスは両方を単一の測定値に結合することでそれらを分離し、バンドはその測定値を楽器自体の最近の動作のコンテキストに配置します。 仕組み 各バーの生のフォース インデックスは、現在の終値と前の終値の差に、そのバーの出来高を乗じたものになります。バーがより高く終了するとプラス、より低く終了するとマイナスとなり、取引が行われた量によってスケールされます。デフォルトではティックボリュームが使用されます。実際のボリュームは、ブローカーが提供する場所に自動的に適用されます。 次に、その生の系列は、選択した平均化方法を使用して、選択した期間にわたって平滑化されます。ここでは平滑化が重要です。平滑化されていないフォース

Narayanan Mohanan Mohanan Krishnan パブリッシュされたプロダクト

49.00 USD

OBVCD Pro は、収束/発散解析を適用するモーメンタム オシレーターです。 オンバランスボリューム (OBV) 価格の代わりに、適応ボラティリティ バンドと 5 状態レジーム分類子を組み合わせ、チャート上で視覚的に読み取ることも、Expert Advisor で直接利用することもできます。 ほとんどの古典的なオシレーターは価格のみを分析します。 OBVCD Pro は、累積出来高フローから収束と発散を計算するため、市場の動きそのものだけでなく、その背後にある参加を測定します。結果は、裁量トレーダーとアルゴリズム システムで同様に使用できる単一のレジーム値に変換されます。 仕組み オンバランス ボリューム (OBV) は、選択したボリューム ソースから計算されます。 Tick Volume はデフォルトで使用され、Real Volume はブローカーが提供する場合に自動的に適用されます。 高速移動平均と低速移動平均は、OBV シリーズ (デフォルトでは EMA 12 および EMA 26) に対して計算されます。それらの間の違いが形成されます OBVCD ヒストグラム 。あ 信号線

Narayanan Mohanan Mohanan Krishnan パブリッシュされたプロダクト

本インジケーターは 累積出来高デルタ(CVD) ——各バーの出来高に、そのバーが終値でどちらに引けたかに応じた符号を付けて積み上げた累計——を、適応型の標準偏差バンドの中に描画します。価格だけでは分からないことに答えます。その値動きは参加によって支えられているのか、それとも漂っているだけなのか、という問いです。 累計は、お選びいただいた アンカー ——日次、週次、月次——で再び始まります。したがって表示される値は、チャート履歴の先頭ではなく、常に現在のセッション、週、月に対する相対値になります。この一つの設定こそが、同じインジケーターを為替の1分足チャートでも株価指数の日足チャートでも役立つものにしており、履歴がたまたま始まった地点から増え続けるだけの単純な累積出来高ラインとの違いでもあります。 計算の仕組み 各バーはその出来高を累計に寄与させます。前のバーの終値より高く引ければ加算、低く引ければ減算、同値であれば累計は変わりません。

Narayanan Mohanan Mohanan Krishnan
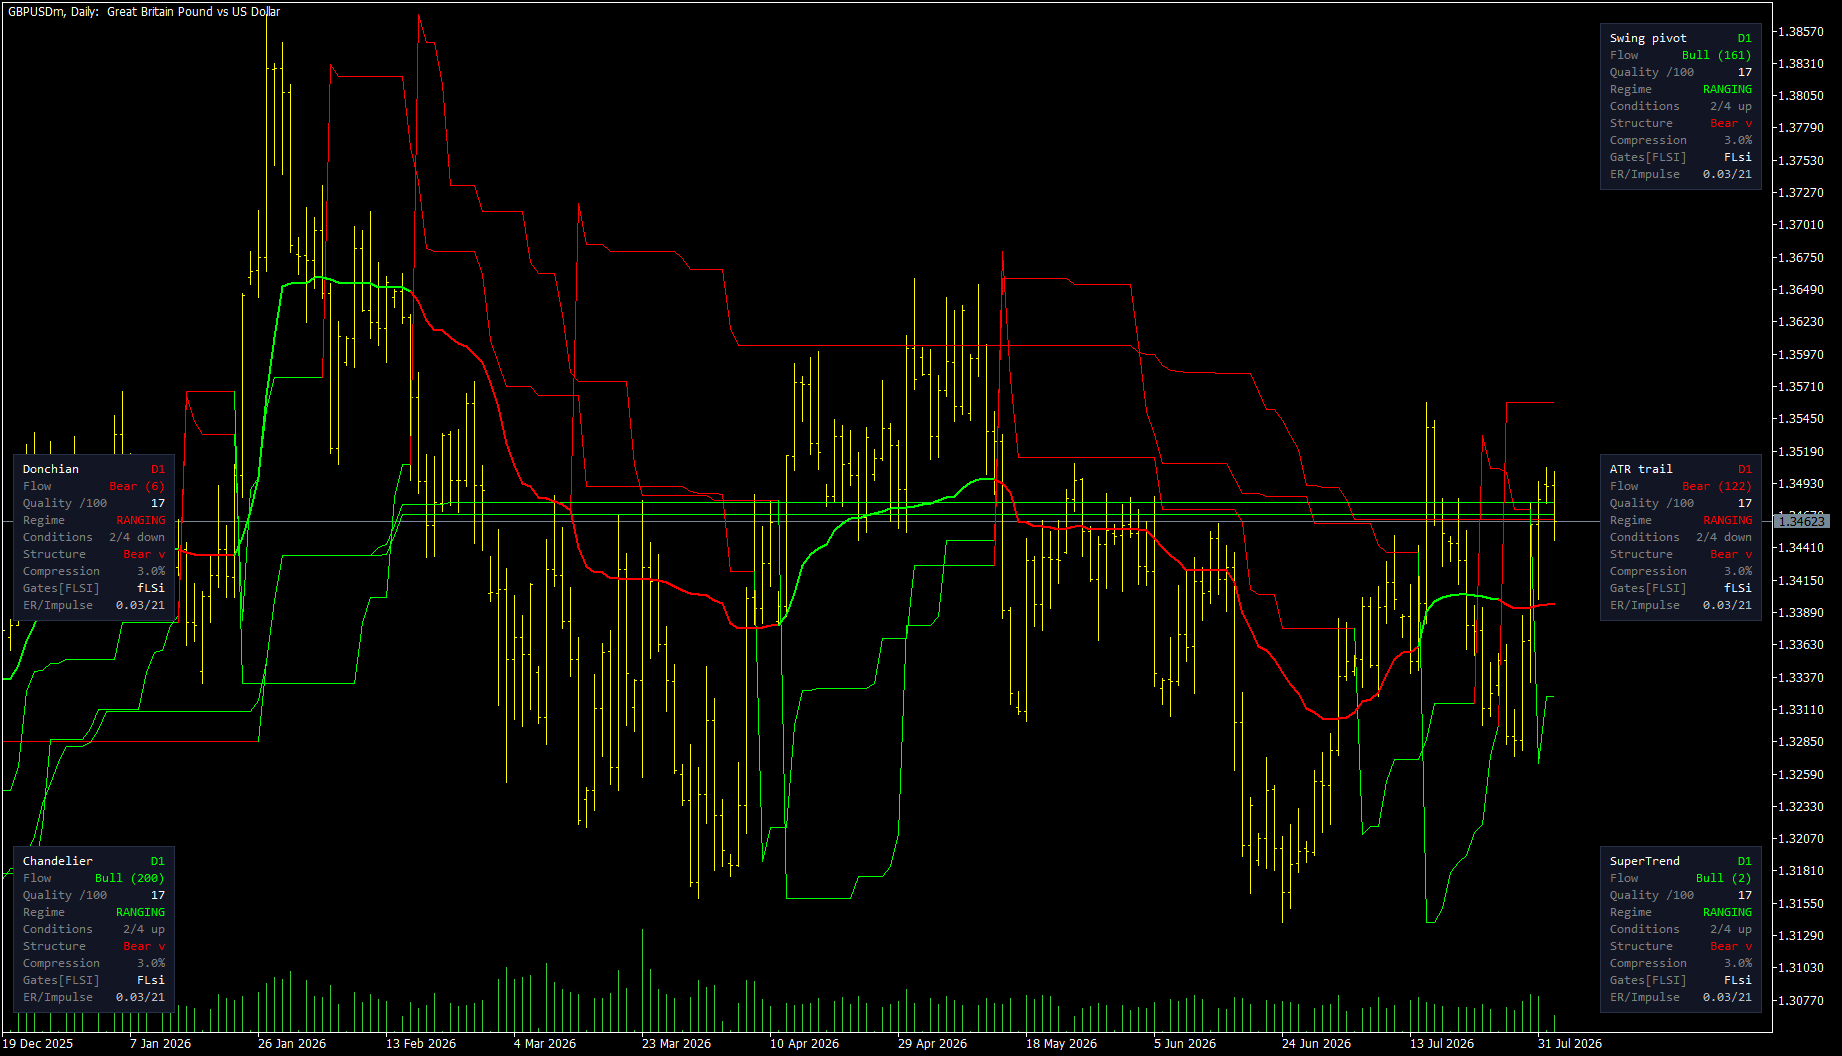
Five trailing stops on one chart. Three say up, two say down.

Same instrument, same daily bars, same settings. GBPUSD.

Swing pivot: bullish, 161 bars. Chandelier: bullish, 200 bars. SuperTrend: bullish, but only 2 bars — it just flipped. ATR trail: bearish, 122 bars. Donchian: bearish, 6 bars.

Five methods, three answers up and two down, and none of them is wrong.

They disagree because they anchor to different things. A trailing stop has to decide what it is trailing behind, and that choice is the whole method:

The swing pivot sits where the market last turned. The ATR trail keeps a fixed volatility distance from a smoothed average. SuperTrend brackets each bar's median price and flips when the close crosses. Chandelier hangs from the highest point of the move so far. Donchian uses only the highest high and lowest low, with no volatility term at all.

Four of those five use ATR. One doesn't. That is deliberate — a single ATR multiple is one opinion about how much room to give, and it is a famously poor one at the moments that matter most, when volatility is compressed right before it expands.

The interesting part is not which method is right. It is that all five panels agree the regime is ranging.

That is what a rangebound market looks like when you measure it five ways: the methods scatter. In a strong trend they converge — same chart, different period, they sit within a narrow band of each other.

So the spread between them carries information that no single stop level does. Wide spread, no structure to anchor to. Narrow spread, the market is doing something all five can agree on.

I have not tested whether that spread predicts anything, and I would want a few thousand samples before saying it does. But as a description of the present it is more honest than any one line.

All five methods are in one indicator — Structure Flow and Trailing Stop, on the MQL5 Market.

#quantitativefinance #algorithmictrading #mql5 #tradingsystems #forex #technicalanalysis
Narayanan Mohanan Mohanan Krishnan パブリッシュされたプロダクト

本インジケーターは価格チャート上に2本のラインを描画します。市場の方向に追随するアダプティブなフローライン、そしてその方向にのみ進み決して戻らないトレーリングストップです。小さなパネルが、その背後にある状態を表示します。 トレーリングストップは5通りの方法で計算できます。これらは一つの考え方の変種ではありません。それぞれ拠り所とするものが異なり、同じチャート上でもしばしば結論が食い違います。 フローライン 適応型の平均線です。価格がもみ合っているときは強く平滑化し、価格が方向性を持って進んでいるときは弱く平滑化します。そのため値動きの最中は価格に近く追随しながら、レンジ内で一つひとつの振れを追いかけることがありません。3つの入力で制御します。測定する期間、そして許容する最速と最遅の平滑度です。 ノイズフィルターは、価格がラインから追随に値するだけ離れるまで、ラインを動かさずに保ちます。このしきい値はATRで指定するため、固定のpip値を前提とせず銘柄に合わせて調整されます。 トレーリングストップと5つの方法

Narayanan Mohanan Mohanan Krishnan パブリッシュされたプロダクト

本インジケーターは、収束/拡散の構成——短期移動平均から長期移動平均を引き、シグナルラインを添えたもの——を、価格ではなく 出来高から導かれる系列 に適用します。3つのソースから選択できます。累積出来高デルタ、フォースインデックス、オンバランスボリュームです。 その結果の上に適応型ボラティリティバンドを描画し、確定した各バーを5つのレジーム状態のいずれかに分類します。この状態は数値バッファとして公開されるため、エキスパートアドバイザーから直接読み取れます。 ソースが重要な理由 通常のMACDは価格モメンタムを測定しますが、それは上のローソク足を見れば概ね分かることです。この3つのソースが測るのは別のもの——その値動きが起きている間に、出来高が蓄積されていたのか、それとも放出されていたのかです。 3つは互いに置き換えられるものではありません。スクリーンショットの1つでは、同一のチャートに同一の設定で3つすべてを表示し、違いを並べて確認できるようにしています。 累積出来高デルタ —

Narayanan Mohanan Mohanan Krishnan
MACD and OBVCD on the same settings — Bitcoin weekly, 2019 to 2026

Both panes below use 50, 200, 20. The lower one is the standard MetaTrader MACD, computed on price. The upper one is the same construction computed on On Balance Volume — so it measures the convergence and divergence of accumulated volume rather than of price itself.

The chart covers two full Bitcoin cycles.

What I find interesting is not that one leads the other. It is that they answer different questions.

The MACD histogram tracks price momentum, and on a weekly chart across seven years it does that cleanly. But it is describing something you can already see by looking at the candles above it.

The OBV version is describing whether volume was accumulating or distributing while that price move happened. Through 2024 and into 2025 the histogram runs green and expanding — volume building alongside the advance. The turn to red at the right edge comes as that accumulation reverses.

The five colours are the part I actually use. Green above the upper band means momentum expanding; light green means still above the band but fading; grey means inside the bands, no regime; orange and red are the bearish equivalents. The bands are a 20-period standard deviation on the histogram itself, so they widen and contract with activity instead of relying on fixed levels.

That state is also exposed as a buffer — values +2 to −2 — so an EA can read the regime directly rather than re-deriving it from the plot.

Neither indicator predicts anything. Both are descriptive: they tell you what has happened to price momentum and to volume momentum respectively. I mention that because the interesting part of this chart is the disagreement between the two panes, not a signal from either.

Free demo on the product page, and the buffer map is documented in the description.

Five MT5 indicators published, three of them free — currency strength, Force Index, and volume delta, all with documented buffers. Happy to answer questions about any of the calculations.

Five MT5 indicators published, three of them free — currency strength, Force Index, and volume delta, all with documented buffers. Happy to answer questions about any of the calculations.

https://www.mql5.com/en/users/naamo/seller
12