Narayanan Mohanan Mohanan Krishnan
  • Informations
Aucun
expérience
18
produits
0
versions de démo
0
offres d’emploi
0
signaux
0
les abonnés
ML/Python/MQL Developer à Independent
Je construis des outils de mesure pour MetaTrader. Ils décrivent ce que le marché a fait et énoncent les limites de chaque mesure plutôt que de les dissimuler.

Trente ans à construire des systèmes de production et d'automatisation, réorientés vers le travail quantitatif en 2020. Mes recherches se font en Python — cadres de backtesting, validation walk-forward, évaluation statistique sur de larges ensembles de candidats — et ce qui y survit devient un indicateur ou un Expert Advisor. La discipline est la falsification d'abord : un résultat est traité comme un artefact tant qu'il ne tient pas hors échantillon. Ce qui arrive sur cette étagère porte les limites de sa propre mesure, indique où une lecture cesse d'être significative, et documente les endroits où deux plateformes divergent, au lieu d'en faire silencieusement la moyenne.
Rien de ce qui est publié ici ne produit de signaux de trading, et rien ici ne comporte de promesse de performance.
____________________________________________________________________
🔬 MEASUREMENT — point it at any indicator and read what it actually does
▸ Indicator Test Report · 🆓 · MT5 — twelve checks, a plain-language report https://www.mql5.com/en/market/product/191061
▸ Indicator Test Report MT4 · 🆓 · MT4 https://www.mql5.com/en/market/product/192010
____________________________________________________________________
📊 CURRENCY STRENGTH — the eight majors decomposed from all 28 pairs
▸ Multi Timeframe Currency Strength Panel · 🆓 · MT5 https://www.mql5.com/en/market/product/188552
▸ MTF Currency Strength Panel MT4 · 🆓 · MT4 https://www.mql5.com/en/market/product/189304
▸ Currency Strength Oscillator MT5 · $39 · MT5 — the same decomposition as a history https://www.mql5.com/en/market/product/188624
▸ Currency Strength Oscillator MT4 · $39 · MT4 https://www.mql5.com/en/market/product/189507
____________________________________________________________________
📈 VOLUME AND ORDER FLOW
▸ Anchored Volume Delta with Adaptive Bands · 🆓 · MT5 https://www.mql5.com/en/market/product/188383
▸ Anchored Volume Delta with Adaptive Bands MT4 · 🆓 · MT4 https://www.mql5.com/en/market/product/188916
▸ OBVCD Pro · $49 · MT5 https://www.mql5.com/en/market/product/172855
▸ OBVCD Pro MT4 · $49 · MT4 https://www.mql5.com/en/market/product/189055
____________________________________________________________________
⚡ MOMENTUM AND VOLATILITY
▸ Force Index with Adaptive Volatility Bands · 🆓 · MT5 https://www.mql5.com/en/market/product/188434
▸ Force Index with Adaptive Volatility Bands MT4 · 🆓 · MT4 https://www.mql5.com/en/market/product/189058
____________________________________________________________________
🔍 REGIME AND STRUCTURE
▸ Oscillator Regime Suite · $89 · MT5 https://www.mql5.com/en/market/product/188673
▸ Oscillator Regime Suite MT4 · $89 · MT4 https://www.mql5.com/en/market/product/189783
▸ Structure Flow and Trailing Stop · $99 · MT5 https://www.mql5.com/en/market/product/188849
▸ Structure Flow and Trailing Stop MT4 · $99 · MT4 https://www.mql5.com/en/market/product/190923
____________________________________________________________________
📐 TREND PERSISTENCE — how often the current state has survived to the next bar
▸ Trend Survival States · 🆓 · MT5 — the five-state classification https://www.mql5.com/en/market/product/190790
▸ Trend Survival Rate · $99 · MT5 — adds the survival rate and a Brier forecast score https://www.mql5.com/en/market/product/190792
____________________________________________________________________
🧪 ENVIRONNEMENT DE TEST
Tout ici est développé et testé sur Exness, sur un terminal réel disposant des 28 paires majeures et dont la profondeur d'historique a été vérifiée de M1 à MN1 — y compris les trous de données que j'ai trouvés et documentés dans la fiche du Currency Strength Oscillator, plutôt que de les laisser à la découverte d'un acheteur. Je suis apporteur d'affaires (introducing broker) pour Exness ; si vous ouvrez un compte via mon lien, je perçois une commission, et vous devriez choisir un courtier selon vos propres critères plutôt que les miens. Ce profil n'est ni détenu ni exploité par Exness.

▸ Ouvrir un compte : https://one.exnessonelink.com/a/d3zld339yo
______________________________________________________________________________________________________________
✉️ Des questions sur les calculs, les buffers, ou sur l'utilisation de ces outils aux côtés des vôtres — écrivez-moi. Je réponds.
Narayanan Mohanan Mohanan Krishnan Produits publiés

Indicator Test Report pour MetaTrader 5 - un vérificateur de repaint et un testeur d'indicateur qui montre comment n'importe quel indicateur se comporte réellement Vous ne pouvez pas voir l'intérieur d'un indicateur compilé. Le rapport de test d'indicateur charge n'importe quel indicateur (acheté, écrit ou intégré à MetaTrader) et répond à la question qu'une description ne peut pas : fait-il du repaint, de quelle quantité d'historique a-t-il besoin et que publie-t-il réellement ? Il rapporte le

Narayanan Mohanan Mohanan Krishnan Produits publiés

Indicator Test Report pour MetaTrader 4 - un vérificateur de repaint MT4 et un testeur d'indicateur qui montre comment n'importe quel indicateur se comporte réellement Vous ne pouvez pas voir l'intérieur d'un indicateur compilé. Le rapport de test d'indicateur charge n'importe quel indicateur (acheté, écrit ou intégré à MetaTrader) et répond à la question qu'une description ne peut pas : fait-il du repaint, de quelle quantité d'historique a-t-il besoin et que publie-t-il réellement ? Il rapporte

Narayanan Mohanan Mohanan Krishnan Produits publiés

Structure Flow et Trailing Stop MT4 — une ligne de flux adaptative avec cinq méthodes de trailing stop, une structure de marché et des bandes de liquidité pour MetaTrader 4 Cinq méthodes d'arrêt suiveur, une ligne de flux adaptative et un panneau de conditions qui indique le nombre de mesures concordantes. Cet indicateur trace deux lignes sur le graphique des prix : une ligne de flux adaptative qui suit la direction du marché et un stop suiveur qui se déplace uniquement dans cette direction et

Narayanan Mohanan Mohanan Krishnan
Crude oil closed at 81.518 on Friday. Three charts of the same instrument, three different measurements, and they do not agree with each other. That is not a fault in any of them. It is what happens when you ask three questions that only sound like the same question...
Narayanan Mohanan Mohanan Krishnan Produits publiés

Trend Survival States pour MetaTrader 5 — un indicateur de régime de marché libre mesurant la pression haussière et baissière avec des bandes de volatilité adaptatives et une classification de tendance à cinq états Pressions haussières et baissières, écart de bande adaptatif et classification du marché à cinq États, gratuits pour MT5. Il mesure la pression d'achat et de vente derrière le mouvement actuel et la classe selon un état de marché : haussier fort, haussier faible, neutre, ours faible

Narayanan Mohanan Mohanan Krishnan Produits publiés

Taux de survie de tendance pour MetaTrader 5 — un indicateur du régime du marché qui mesure la fréquence à laquelle l'état de tendance actuel a survécu jusqu'à la barre suivante et évalue sa propre prévision. Taux de survie des tendances, classification de l'état du marché et score de prévision du Brier en direct, dans une fenêtre d'indicateur MT5. Il mesure la pression d'achat et de vente derrière le mouvement actuel, la classe dans un état de marché et indique la fréquence à laquelle cet état

Narayanan Mohanan Mohanan Krishnan
Three charts of the same instrument, the same indicator and the same settings. Force Index with adaptive volatility bands at 13, 20 and 2.0 deviations, on BTCUSD monthly, weekly and daily. The Force Index on the closed daily bar of 12 August reads −11,252,859.29...
Narayanan Mohanan Mohanan Krishnan Produits publiés

Cet indicateur applique la construction de convergence/divergence — moyenne mobile rapide moins lente, avec une ligne de signal — à une série dérivée du volume plutôt qu'au prix. Trois sources sont proposées : le Delta de Volume Cumulé, le Force Index et l'On Balance Volume. Des bandes de volatilité adaptatives sont tracées par-dessus le résultat, et chaque bougie clôturée est classée dans l'un de cinq états de régime. Cet état est exposé sous forme de buffer numérique, de sorte qu'un Expert

Narayanan Mohanan Mohanan Krishnan
A daily XAUUSD chart can look fairly simple until several independent measurements are placed beside the price. On the chart below, gold has recovered from the July decline...
Narayanan Mohanan Mohanan Krishnan Produits publiés

Oscillateur de force monétaire pour MetaTrader 4 Un indicateur de force relative de la monnaie qui retrace l’histoire des huit majors. Cet oscillateur de force monétaire trace la force relative des huit principales devises sous forme d'histoire, décomposée à partir du 28 paires majeures. Alors qu'un indicateur standard de la force monétaire vous indique où en sont les choses à l'heure actuelle, il montre comment elles y sont arrivées : quelle devise s'est renforcée, laquelle s'est inversée et où

Narayanan Mohanan Mohanan Krishnan Produits publiés

MTF Currency Strength Panel for MetaTrader 4 Indicateur de force des devises multi-unités de temps : les 28 paires majeures sur un seul graphique. Ce panneau de force des devises montre où se situent les huit principales devises à l'instant présent, et comment chacune des 28 paires majeures a évolué sur neuf unités de temps à la fois, de M1 à MN1. Les deux lectures tiennent sur un seul graphique et sont actualisées par un minuteur. Le classement des paires en soi est trompeur. Lorsqu'une seule

Narayanan Mohanan Mohanan Krishnan
Elder's Force Index is one of the few classical indicators that combines price and volume in a single line. Each bar contributes (close − previous close) × volume. Positive when buyers carried the bar, negative when sellers did, and proportional to how much was traded doing it...
Narayanan Mohanan Mohanan Krishnan
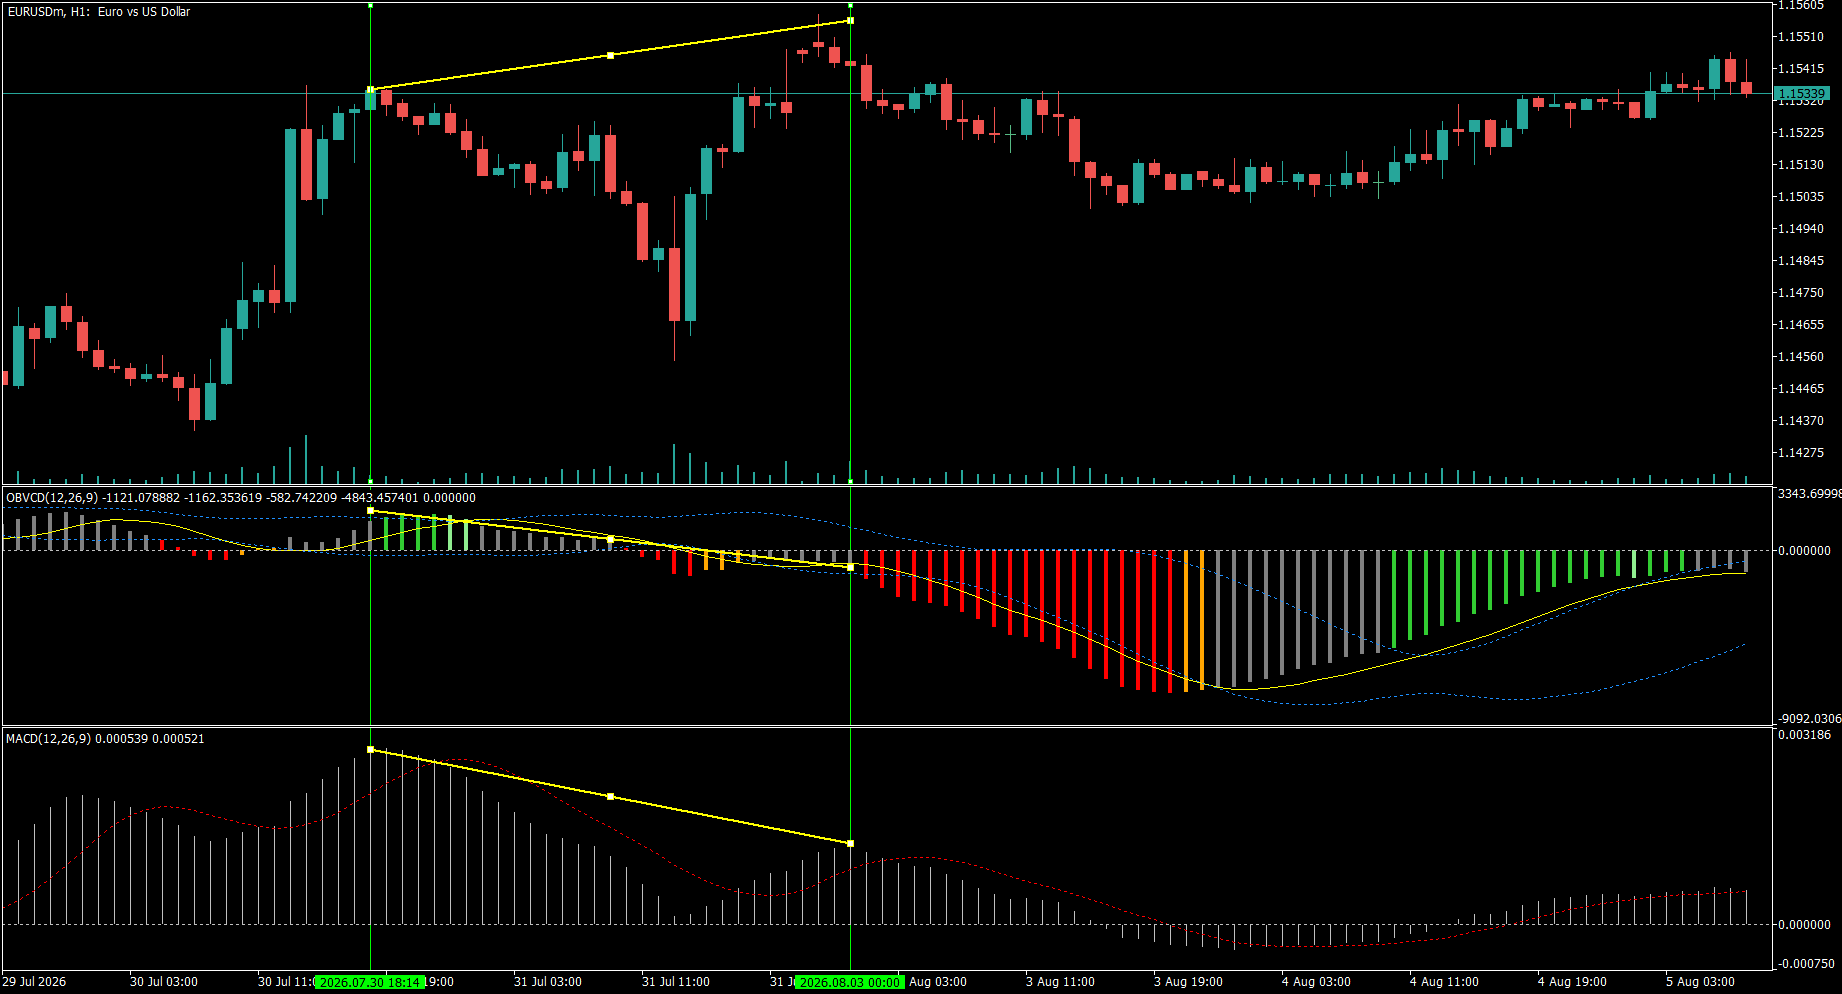
EURUSD H1 — the same divergence, two different answers

Between 30 July and 3 August, price made a higher high. Standard MACD made a lower high. So did OBVCD — the same 12/26/9 construction applied to On-Balance Volume instead of price. Both oscillators disagreed with price, and MACD showed the divergence more steeply of the two.

Then they parted company. At the second marked line OBVCD had crossed below zero — reading -1121 against its signal at -1162. MACD at the same bar was still positive: +0.000539, signal +0.000521. Price rolled over afterwards.

That difference is the whole point of the pane. A divergence is a statement about slope: the new high was made with less momentum than the last. A zero-line cross is a statement about state: the fast average has fallen below the slow one, so the underlying series has actually turned. Price momentum had not turned yet. Cumulative volume flow had.

Neither reading is a signal to act, and the same chart shows why — follow it right and the decline exhausts, OBVCD climbs back through zero, and the histogram turns green again. That is the honest shape of it.

Descriptive, not predictive. One instance on one instrument, shown because the sequence is legible, not because it repeats.

#EURUSD #OBVCD #MACD #divergence #volume #technicalanalysis #MT5 #MT4
Narayanan Mohanan Mohanan Krishnan Produits publiés

Cet indicateur trace le Indice de force — la variation de prix de chaque barre multipliée par son volume — à l'intérieur de bandes d'écart type adaptatives. Là où le prix à lui seul vous indique qu'un marché a évolué, l'indice de force vous indique les efforts déployés pour le faire évoluer. Un changement de prix important sur un volume faible et un petit changement sur un volume important sont des événements très différents, même lorsque les bougies se ressemblent. L'indice de force les sépare

Narayanan Mohanan Mohanan Krishnan Produits publiés

49.00 USD

OBVCD Pro est un oscillateur d'impulsion qui applique une analyse de convergence/divergence à Volume en solde (OBV) au lieu du prix, combinant des bandes de volatilité adaptatives avec un classificateur de régime à 5 états qui peut être lu visuellement sur le graphique ou consommé directement par un conseiller expert. La plupart des oscillateurs classiques analysent uniquement le prix. OBVCD Pro calcule la convergence et la divergence à partir du flux de volume cumulé, il mesure donc la

Narayanan Mohanan Mohanan Krishnan Produits publiés

Cet indicateur trace le Delta de Volume Cumulé (CVD) — le total cumulé du volume de chaque bougie, signé selon le sens de sa clôture — à l'intérieur de bandes adaptatives d'écart type. Il répond à une question à laquelle le prix seul ne répond pas : le mouvement est-il porté par la participation, ou ne fait-il que dériver ? Le total cumulé repart d'un ancrage que vous choisissez — quotidien, hebdomadaire ou mensuel —, de sorte que la lecture se rapporte toujours à la séance, à la semaine ou au

Narayanan Mohanan Mohanan Krishnan
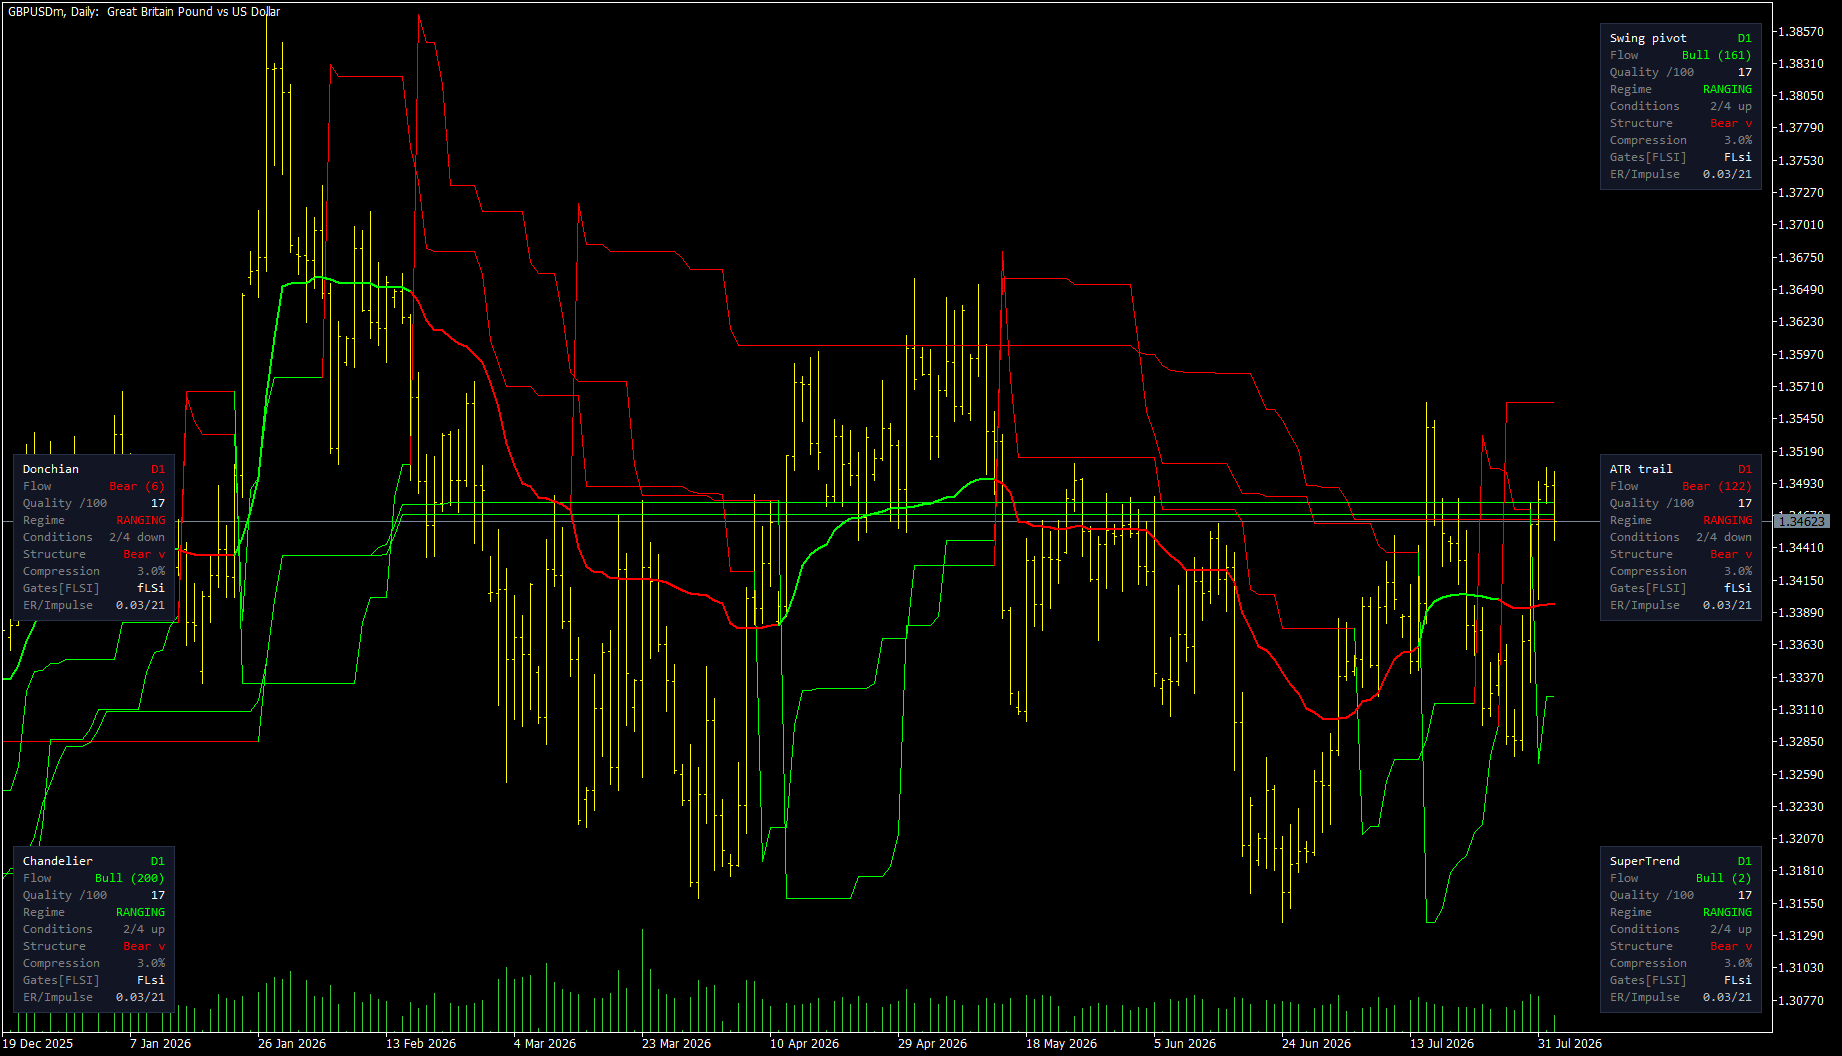
Five trailing stops on one chart. Three say up, two say down.

Same instrument, same daily bars, same settings. GBPUSD.

Swing pivot: bullish, 161 bars. Chandelier: bullish, 200 bars. SuperTrend: bullish, but only 2 bars — it just flipped. ATR trail: bearish, 122 bars. Donchian: bearish, 6 bars.

Five methods, three answers up and two down, and none of them is wrong.

They disagree because they anchor to different things. A trailing stop has to decide what it is trailing behind, and that choice is the whole method:

The swing pivot sits where the market last turned. The ATR trail keeps a fixed volatility distance from a smoothed average. SuperTrend brackets each bar's median price and flips when the close crosses. Chandelier hangs from the highest point of the move so far. Donchian uses only the highest high and lowest low, with no volatility term at all.

Four of those five use ATR. One doesn't. That is deliberate — a single ATR multiple is one opinion about how much room to give, and it is a famously poor one at the moments that matter most, when volatility is compressed right before it expands.

The interesting part is not which method is right. It is that all five panels agree the regime is ranging.

That is what a rangebound market looks like when you measure it five ways: the methods scatter. In a strong trend they converge — same chart, different period, they sit within a narrow band of each other.

So the spread between them carries information that no single stop level does. Wide spread, no structure to anchor to. Narrow spread, the market is doing something all five can agree on.

I have not tested whether that spread predicts anything, and I would want a few thousand samples before saying it does. But as a description of the present it is more honest than any one line.

All five methods are in one indicator — Structure Flow and Trailing Stop, on the MQL5 Market.

#quantitativefinance #algorithmictrading #mql5 #tradingsystems #forex #technicalanalysis
Narayanan Mohanan Mohanan Krishnan Produits publiés

Cet indicateur trace deux lignes sur le graphique des prix : une ligne de flux adaptative qui suit la direction du marché, et un stop suiveur qui ne se déplace que dans cette direction et jamais en arrière. Un petit panneau indique l'état qui les sous-tend. Le stop suiveur peut être calculé de cinq façons différentes. Ce ne sont pas des variantes d'une même idée : chacune s'ancre à quelque chose de différent et, sur le même graphique, elles divergent souvent. La ligne de flux Une moyenne

Narayanan Mohanan Mohanan Krishnan Produits publiés

Cet indicateur applique la construction de convergence/divergence — moyenne mobile rapide moins lente, avec une ligne de signal — à une série dérivée du volume plutôt qu'au prix. Trois sources sont proposées : le Delta de Volume Cumulé, le Force Index et l'On Balance Volume. Des bandes de volatilité adaptatives sont tracées par-dessus le résultat, et chaque bougie clôturée est classée dans l'un de cinq états de régime. Cet état est exposé sous forme de buffer numérique, de sorte qu'un Expert

Narayanan Mohanan Mohanan Krishnan
MACD and OBVCD on the same settings — Bitcoin weekly, 2019 to 2026

Both panes below use 50, 200, 20. The lower one is the standard MetaTrader MACD, computed on price. The upper one is the same construction computed on On Balance Volume — so it measures the convergence and divergence of accumulated volume rather than of price itself.

The chart covers two full Bitcoin cycles.

What I find interesting is not that one leads the other. It is that they answer different questions.

The MACD histogram tracks price momentum, and on a weekly chart across seven years it does that cleanly. But it is describing something you can already see by looking at the candles above it.

The OBV version is describing whether volume was accumulating or distributing while that price move happened. Through 2024 and into 2025 the histogram runs green and expanding — volume building alongside the advance. The turn to red at the right edge comes as that accumulation reverses.

The five colours are the part I actually use. Green above the upper band means momentum expanding; light green means still above the band but fading; grey means inside the bands, no regime; orange and red are the bearish equivalents. The bands are a 20-period standard deviation on the histogram itself, so they widen and contract with activity instead of relying on fixed levels.

That state is also exposed as a buffer — values +2 to −2 — so an EA can read the regime directly rather than re-deriving it from the plot.

Neither indicator predicts anything. Both are descriptive: they tell you what has happened to price momentum and to volume momentum respectively. I mention that because the interesting part of this chart is the disagreement between the two panes, not a signal from either.

Free demo on the product page, and the buffer map is documented in the description.

Five MT5 indicators published, three of them free — currency strength, Force Index, and volume delta, all with documented buffers. Happy to answer questions about any of the calculations.

Five MT5 indicators published, three of them free — currency strength, Force Index, and volume delta, all with documented buffers. Happy to answer questions about any of the calculations.

https://www.mql5.com/en/users/naamo/seller
12