Narayanan Mohanan Mohanan Krishnan
  • Bilgiler
yok
deneyim
18
ürünler
0
demo sürümleri
0
işler
0
sinyaller
0
aboneler
ML/Python/MQL Developer at Independent
MetaTrader için ölçüm araçları geliştiriyorum. Piyasanın ne yaptığını tarif ederler ve her ölçümün sınırlarını gizlemek yerine açıkça belirtirler.

Otuz yıl boyunca üretim sistemleri ve otomasyon kurdum; 2020'de bunu niceliksel çalışmaya yönlendirdim. Araştırmalarımı Python'da yürütüyorum — geriye dönük test altyapıları, walk-forward doğrulama, geniş aday kümeleri üzerinde istatistiksel değerlendirme — ve bunlardan sağ çıkan bir gösterge ya da Expert Advisor hâline geliyor. Yöntem önce yanlışlamadır: bir sonuç, örneklem dışında da geçerliliğini koruyana kadar yapay bir bulgu sayılır. Bu rafa ulaşan her şey kendi ölçümünün sınırlarını taşır, bir okumanın nerede anlamlı olmaktan çıktığını söyler ve iki platformun ayrıştığı noktaları sessizce ortalamak yerine belgeler.
Burada yayımlananların hiçbiri işlem sinyali üretmez ve hiçbiri performans iddiası taşımaz.
____________________________________________________________________
🔬 MEASUREMENT — point it at any indicator and read what it actually does
▸ Indicator Test Report · 🆓 · MT5 — twelve checks, a plain-language report https://www.mql5.com/en/market/product/191061
▸ Indicator Test Report MT4 · 🆓 · MT4 https://www.mql5.com/en/market/product/192010
____________________________________________________________________
📊 CURRENCY STRENGTH — the eight majors decomposed from all 28 pairs
▸ Multi Timeframe Currency Strength Panel · 🆓 · MT5 https://www.mql5.com/en/market/product/188552
▸ MTF Currency Strength Panel MT4 · 🆓 · MT4 https://www.mql5.com/en/market/product/189304
▸ Currency Strength Oscillator MT5 · $39 · MT5 — the same decomposition as a history https://www.mql5.com/en/market/product/188624
▸ Currency Strength Oscillator MT4 · $39 · MT4 https://www.mql5.com/en/market/product/189507
____________________________________________________________________
📈 VOLUME AND ORDER FLOW
▸ Anchored Volume Delta with Adaptive Bands · 🆓 · MT5 https://www.mql5.com/en/market/product/188383
▸ Anchored Volume Delta with Adaptive Bands MT4 · 🆓 · MT4 https://www.mql5.com/en/market/product/188916
▸ OBVCD Pro · $49 · MT5 https://www.mql5.com/en/market/product/172855
▸ OBVCD Pro MT4 · $49 · MT4 https://www.mql5.com/en/market/product/189055
____________________________________________________________________
⚡ MOMENTUM AND VOLATILITY
▸ Force Index with Adaptive Volatility Bands · 🆓 · MT5 https://www.mql5.com/en/market/product/188434
▸ Force Index with Adaptive Volatility Bands MT4 · 🆓 · MT4 https://www.mql5.com/en/market/product/189058
____________________________________________________________________
🔍 REGIME AND STRUCTURE
▸ Oscillator Regime Suite · $89 · MT5 https://www.mql5.com/en/market/product/188673
▸ Oscillator Regime Suite MT4 · $89 · MT4 https://www.mql5.com/en/market/product/189783
▸ Structure Flow and Trailing Stop · $99 · MT5 https://www.mql5.com/en/market/product/188849
▸ Structure Flow and Trailing Stop MT4 · $99 · MT4 https://www.mql5.com/en/market/product/190923
____________________________________________________________________
📐 TREND PERSISTENCE — how often the current state has survived to the next bar
▸ Trend Survival States · 🆓 · MT5 — the five-state classification https://www.mql5.com/en/market/product/190790
▸ Trend Survival Rate · $99 · MT5 — adds the survival rate and a Brier forecast score https://www.mql5.com/en/market/product/190792
____________________________________________________________________
🧪 TEST ORTAMI
Buradaki her şey Exness üzerinde geliştirilip test ediliyor; 28 ana paritenin tamamının bulunduğu canlı bir terminalde, M1'den MN1'e kadar geçmiş veri derinliği kontrol edilerek. Buna, Currency Strength Oscillator ürün açıklamasında bulup belgelediğim veri boşlukları da dâhil — alıcının keşfetmesine bırakmak yerine. Exness için tanıtıcı aracıyım (introducing broker); bağlantım üzerinden hesap açarsanız komisyon alırım ve aracı kurumu benim ölçütlerime göre değil kendi ölçütlerinize göre seçmelisiniz. Bu profil Exness'e ait değildir ve Exness tarafından işletilmemektedir.

▸ Hesap açın: https://one.exnessonelink.com/a/d3zld339yo
______________________________________________________________________________________________________________
✉️ Hesaplamalar, tamponlar veya bunları kendi araçlarınızla birlikte kullanmak hakkındaki sorularınız için bana mesaj gönderin. Yanıtlıyorum.
Narayanan Mohanan Mohanan Krishnan ürün yayınladı

MetaTrader 5 için Indicator Test Report — herhangi bir göstergenin gerçekte nasıl davrandığını gösteren bir repaint denetleyicisi ve gösterge test cihazı Derlenmiş bir göstergenin içini göremezsiniz. Indicator Test Report, satın alınmış, yazılmış veya MetaTrader'a yerleştirilmiş herhangi bir göstergeyi yükler ve bir açıklamanın yapamayacağı soruyu yanıtlar: repaint yapıyor mu, ne kadar geçmişe ihtiyacı var ve gerçekte ne yayınlıyor? Davranışı bildirir. Derecelendirme yapmıyor. Herhangi bir

Narayanan Mohanan Mohanan Krishnan ürün yayınladı

MetaTrader 4 için Indicator Test Report — herhangi bir göstergenin gerçekte nasıl davrandığını gösteren bir MT4 repaint denetleyicisi ve gösterge test cihazı Derlenmiş bir göstergenin içini göremezsiniz. Indicator Test Report, satın alınmış, yazılmış veya MetaTrader'a yerleştirilmiş herhangi bir göstergeyi yükler ve bir açıklamanın yapamayacağı soruyu yanıtlar: repaint yapıyor mu, ne kadar geçmişe ihtiyacı var ve gerçekte ne yayınlıyor? Davranışı bildirir. Derecelendirme yapmıyor. Herhangi bir

Narayanan Mohanan Mohanan Krishnan ürün yayınladı

Yapı Akışı ve İzleyen Durdurma MT4 — MetaTrader 4 için beş takip eden durdurma yöntemi, piyasa yapısı ve likidite bantları içeren uyarlanabilir bir akış çizgisi Beş takip eden durdurma yöntemi, bir uyarlanabilir akış çizgisi ve kaç ölçümün uyumlu olduğunu bildiren bir durum paneli. Bu gösterge fiyat tablosunda iki çizgi çizer: piyasanın yönünü takip eden uyarlanabilir bir akış çizgisi ve yalnızca o yönde hareket eden ve asla geri dönmeyen takip eden bir durak. Küçük bir panel arkalarındaki

Narayanan Mohanan Mohanan Krishnan
Crude oil closed at 81.518 on Friday. Three charts of the same instrument, three different measurements, and they do not agree with each other. That is not a fault in any of them. It is what happens when you ask three questions that only sound like the same question...
Narayanan Mohanan Mohanan Krishnan ürün yayınladı

MetaTrader 5 için Trend Survival States — uyarlanabilir volatilite bantları ve beş durumlu trend sınıflandırmasıyla boğa ve ayı baskısını ölçen bir serbest piyasa rejimi göstergesi Boğa ve ayı baskısı, uyarlanabilir bant yayılımı ve beş eyaletli piyasa sınıflandırması, MT5 için ücretsiz. Mevcut hareketin ardındaki alım ve satım baskısını ölçer ve bunu piyasa durumuna göre sınıflandırır: güçlü boğa, zayıf boğa, nötr, zayıf ayı, güçlü ayı. Bu tam bir rejim göstergesidir, sınırlı süreli bir deneme

Narayanan Mohanan Mohanan Krishnan ürün yayınladı

MetaTrader 5 için Trend Hayatta Kalma Oranı — mevcut trend durumunun bir sonraki çubuğa kadar ne sıklıkla hayatta kaldığını ölçen ve kendi tahminini puanlayan bir piyasa rejimi göstergesi Tek bir MT5 gösterge penceresinde trend hayatta kalma oranı, piyasa durumu sınıflandırması ve canlı Brier tahmin puanı. Mevcut hareketin ardındaki alım ve satım baskısını ölçer, bunu bir piyasa durumu olarak sınıflandırır ve bu durumun bir sonraki çubuğa kadar ne sıklıkla hayatta kaldığını bildirir ve ardından

Narayanan Mohanan Mohanan Krishnan
Three charts of the same instrument, the same indicator and the same settings. Force Index with adaptive volatility bands at 13, 20 and 2.0 deviations, on BTCUSD monthly, weekly and daily. The Force Index on the closed daily bar of 12 August reads −11,252,859.29...
Narayanan Mohanan Mohanan Krishnan ürün yayınladı

Bu gösterge, yakınsama/ıraksama yapısını — hızlı hareketli ortalama eksi yavaş hareketli ortalama ve bir sinyal çizgisi — fiyat yerine hacimden türetilen bir seriye uygular. Üç kaynak arasından seçim yapılabilir: Kümülatif Hacim Farkı, Force Index ve On Balance Volume. Sonucun üzerine uyarlanabilir volatilite bantları çizilir ve kapanmış her mum beş rejim durumundan birine sınıflandırılır. Bu durum sayısal bir buffer olarak sunulur; böylece bir Expert Advisor onu doğrudan okuyabilir. Kaynak

Narayanan Mohanan Mohanan Krishnan
A daily XAUUSD chart can look fairly simple until several independent measurements are placed beside the price. On the chart below, gold has recovered from the July decline...
Narayanan Mohanan Mohanan Krishnan ürün yayınladı

MetaTrader 4 için Döviz Gücü Osilatörü Sekiz ana dalın geçmişini gösteren göreceli bir para birimi gücü göstergesi. Bu para birimi gücü osilatörü, sekiz ana para biriminin göreceli gücünü geçmiş olarak gösterir; 28 büyük çiftler. Standart bir para birimi gücü ölçer size işlerin şu anda nerede durduğunu söylerken, bu da o noktaya nasıl gelindiğini, yani hangi para biriminin güçlendiğini, hangisinin değer kaybettiğini ve sıralamanın nerede el değiştirdiğini gösterir. Sekiz serinin tümü belgelenmiş

Narayanan Mohanan Mohanan Krishnan ürün yayınladı

MTF Currency Strength Panel for MetaTrader 4 Çoklu zaman dilimli döviz gücü göstergesi: 28 ana paritenin tamamı tek bir grafikte. Bu döviz gücü paneli, sekiz ana para biriminin şu anda nerede durduğunu ve 28 ana paritenin her birinin M1'den MN1'e dokuz zaman diliminde nasıl hareket ettiğini birlikte gösterir. Her iki okuma tek bir grafikte yer alır ve bir zamanlayıcıyla güncellenir. Çiftleri kendi başlarına sıralamak yanıltıcıdır. Tek bir para birimi hareket ettiğinde, onu içeren her çift onunla

Narayanan Mohanan Mohanan Krishnan
Elder's Force Index is one of the few classical indicators that combines price and volume in a single line. Each bar contributes (close − previous close) × volume. Positive when buyers carried the bar, negative when sellers did, and proportional to how much was traded doing it...
Narayanan Mohanan Mohanan Krishnan
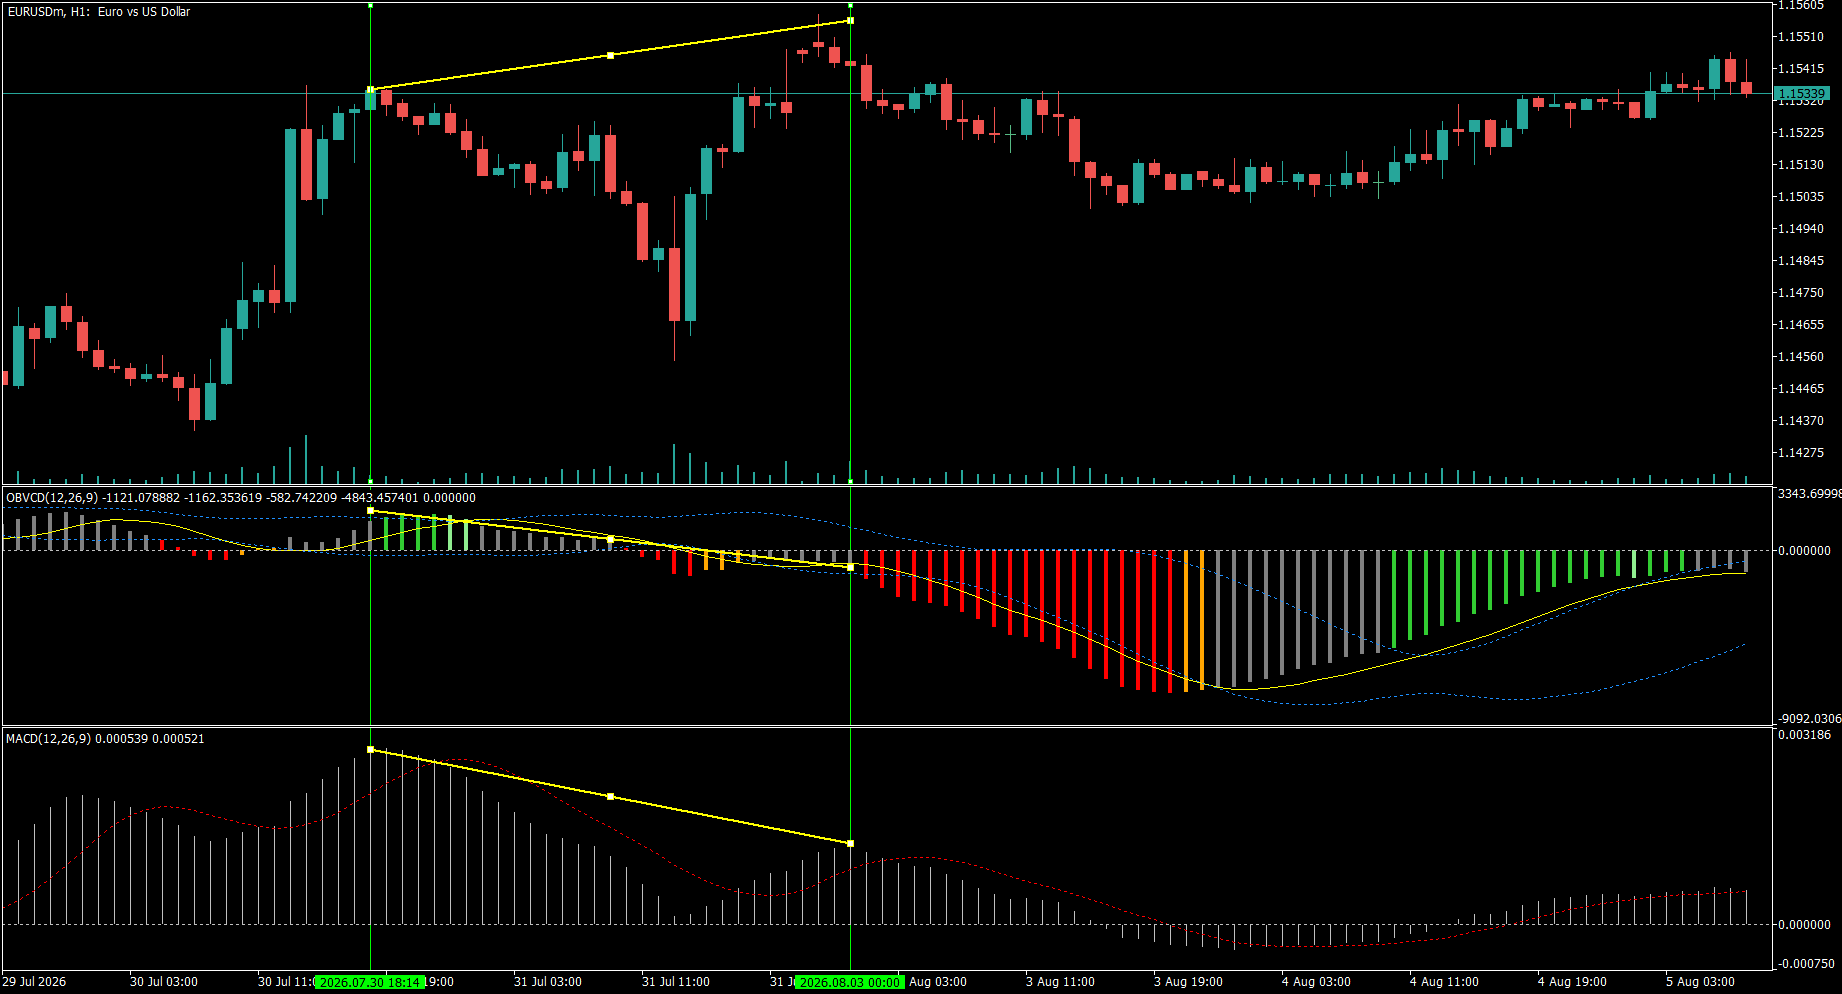
EURUSD H1 — the same divergence, two different answers

Between 30 July and 3 August, price made a higher high. Standard MACD made a lower high. So did OBVCD — the same 12/26/9 construction applied to On-Balance Volume instead of price. Both oscillators disagreed with price, and MACD showed the divergence more steeply of the two.

Then they parted company. At the second marked line OBVCD had crossed below zero — reading -1121 against its signal at -1162. MACD at the same bar was still positive: +0.000539, signal +0.000521. Price rolled over afterwards.

That difference is the whole point of the pane. A divergence is a statement about slope: the new high was made with less momentum than the last. A zero-line cross is a statement about state: the fast average has fallen below the slow one, so the underlying series has actually turned. Price momentum had not turned yet. Cumulative volume flow had.

Neither reading is a signal to act, and the same chart shows why — follow it right and the decline exhausts, OBVCD climbs back through zero, and the histogram turns green again. That is the honest shape of it.

Descriptive, not predictive. One instance on one instrument, shown because the sequence is legible, not because it repeats.

#EURUSD #OBVCD #MACD #divergence #volume #technicalanalysis #MT5 #MT4
Narayanan Mohanan Mohanan Krishnan ürün yayınladı

Bu gösterge, Kuvvet Endeksi - her çubuğun fiyat değişiminin hacmiyle çarpımı - uyarlanabilir standart sapma bantları içinde. Fiyat tek başına size bir pazarın hareket ettiğini söylerken, Güç Endeksi size onu hareket ettirmek için ne kadar çaba harcandığını söyler. Mumlar benzer görünse bile, ince hacimde büyük bir fiyat değişimi ile yoğun hacimde küçük bir fiyat değişimi çok farklı olaylardır. Kuvvet Endeksi, her ikisini de tek bir okumada birleştirerek bunları ayırır ve gruplar bu okumayı

Narayanan Mohanan Mohanan Krishnan ürün yayınladı

49.00 USD

OBVCD Pro, yakınsama/ıraksama analizini uygulayan bir momentum osilatörüdür. Bakiye Hacmi (OBV) fiyat yerine uyarlanabilir volatilite bantlarını, grafikte görsel olarak okunabilen veya doğrudan bir Uzman Danışman tarafından tüketilebilen 5 durumlu bir rejim sınıflandırıcıyla birleştirmek. Çoğu klasik osilatör yalnızca fiyatı analiz eder. OBVCD Pro, kümülatif hacim akışındaki yakınsama ve sapmayı hesaplar, böylece yalnızca hareketin kendisinden ziyade piyasa hareketinin arkasındaki katılımı

Narayanan Mohanan Mohanan Krishnan ürün yayınladı

Bu gösterge, Kümülatif Hacim Deltası'nı (CVD) — her mumun hacminin, o mumun kapanış yönüne göre işaretlenerek biriktirilmiş toplamını — uyarlanabilir standart sapma bantlarının içinde çizer. Fiyatın tek başına yanıtlamadığı bir soruyu yanıtlar: hareketi katılım mı taşıyor, yoksa yalnızca sürükleniyor mu? Birikimli toplam, sizin seçtiğiniz bir çıpada yeniden başlar — günlük, haftalık veya aylık. Böylece okuma her zaman grafik geçmişinin başlangıcına değil, içinde bulunulan seansa, haftaya ya da

Narayanan Mohanan Mohanan Krishnan
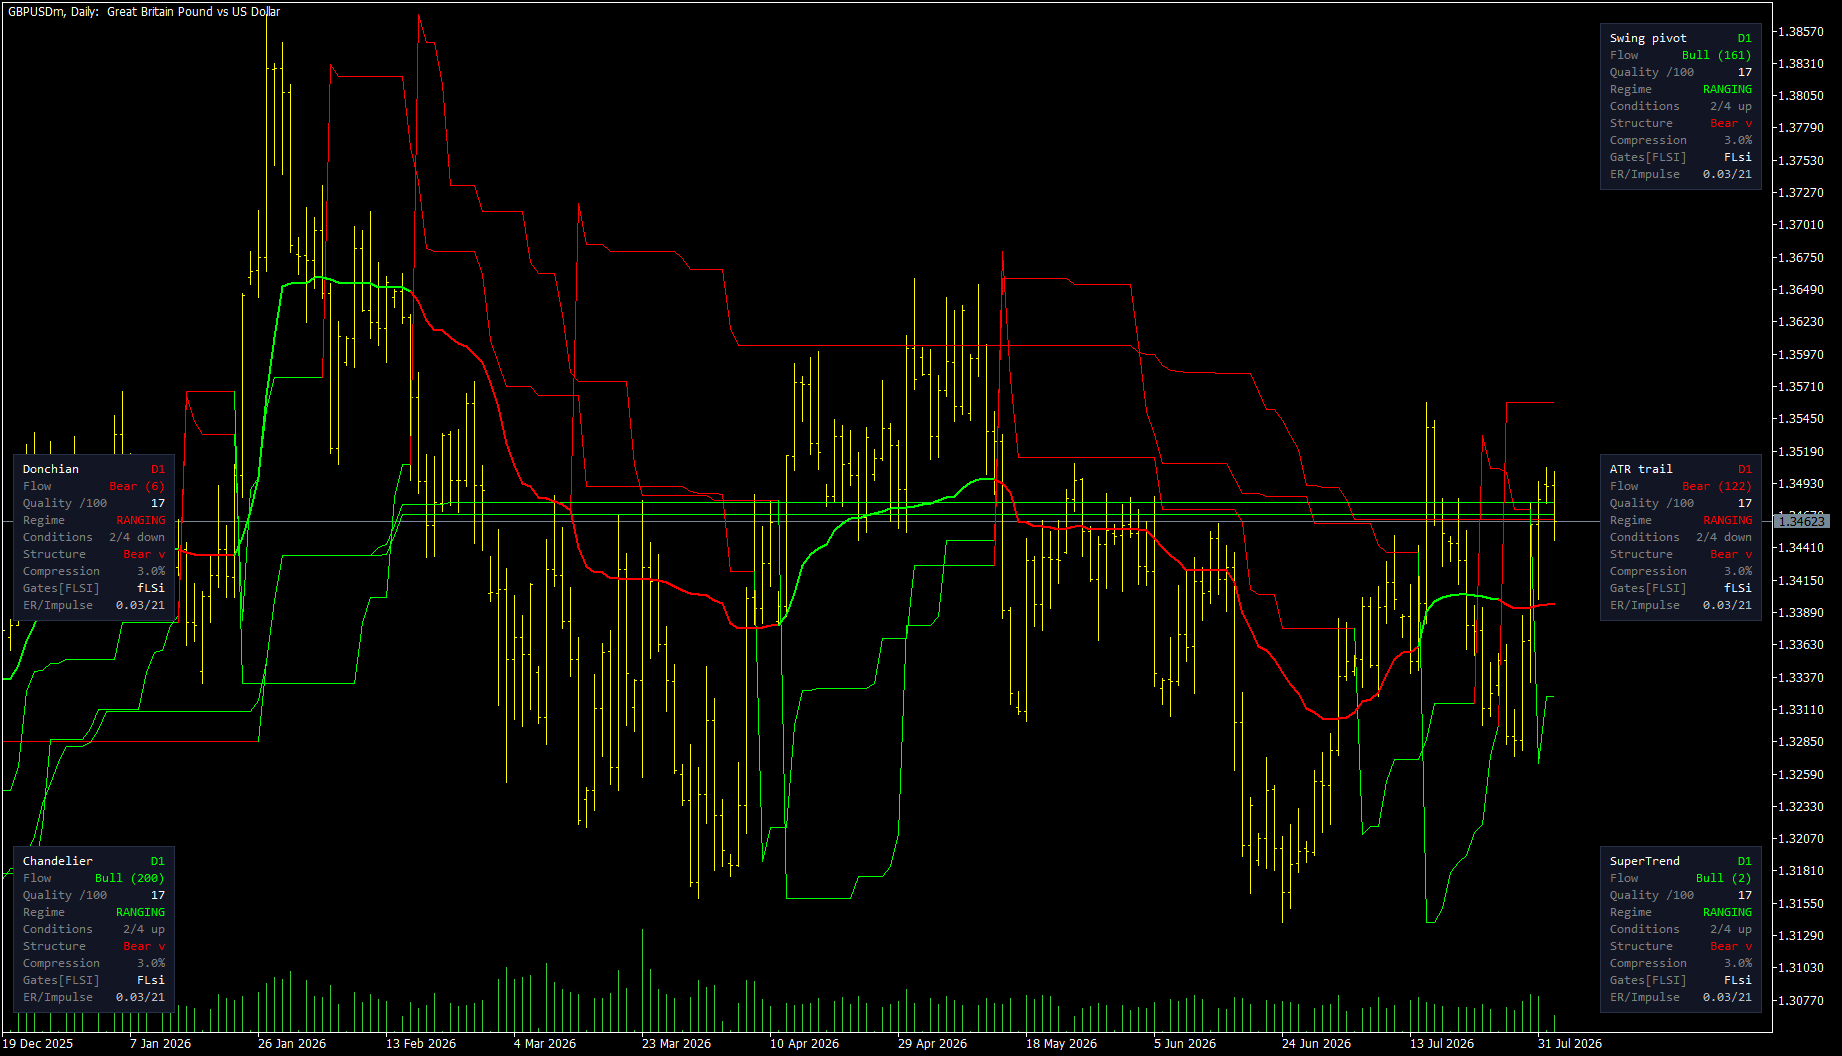
Five trailing stops on one chart. Three say up, two say down.

Same instrument, same daily bars, same settings. GBPUSD.

Swing pivot: bullish, 161 bars. Chandelier: bullish, 200 bars. SuperTrend: bullish, but only 2 bars — it just flipped. ATR trail: bearish, 122 bars. Donchian: bearish, 6 bars.

Five methods, three answers up and two down, and none of them is wrong.

They disagree because they anchor to different things. A trailing stop has to decide what it is trailing behind, and that choice is the whole method:

The swing pivot sits where the market last turned. The ATR trail keeps a fixed volatility distance from a smoothed average. SuperTrend brackets each bar's median price and flips when the close crosses. Chandelier hangs from the highest point of the move so far. Donchian uses only the highest high and lowest low, with no volatility term at all.

Four of those five use ATR. One doesn't. That is deliberate — a single ATR multiple is one opinion about how much room to give, and it is a famously poor one at the moments that matter most, when volatility is compressed right before it expands.

The interesting part is not which method is right. It is that all five panels agree the regime is ranging.

That is what a rangebound market looks like when you measure it five ways: the methods scatter. In a strong trend they converge — same chart, different period, they sit within a narrow band of each other.

So the spread between them carries information that no single stop level does. Wide spread, no structure to anchor to. Narrow spread, the market is doing something all five can agree on.

I have not tested whether that spread predicts anything, and I would want a few thousand samples before saying it does. But as a description of the present it is more honest than any one line.

All five methods are in one indicator — Structure Flow and Trailing Stop, on the MQL5 Market.

#quantitativefinance #algorithmictrading #mql5 #tradingsystems #forex #technicalanalysis
Narayanan Mohanan Mohanan Krishnan ürün yayınladı

Bu gösterge fiyat grafiğine iki çizgi çizer: piyasanın yönünü izleyen uyarlanabilir bir akış çizgisi ve yalnızca o yönde ilerleyip asla geri dönmeyen bir takip eden zarar durdurma seviyesi. Küçük bir panel, bunların arkasındaki durumu bildirir. Takip eden durdurma seviyesi beş farklı yöntemle hesaplanabilir. Bunlar tek bir fikrin çeşitlemeleri değildir: her biri farklı bir şeye tutunur ve aynı grafik üzerinde çoğu zaman birbirinden ayrışırlar. Akış çizgisi Uyarlanabilir bir ortalama. Fiyat bir

Narayanan Mohanan Mohanan Krishnan ürün yayınladı

Bu gösterge, yakınsama/ıraksama yapısını — hızlı hareketli ortalama eksi yavaş hareketli ortalama ve bir sinyal çizgisi — fiyat yerine hacimden türetilen bir seriye uygular. Üç kaynak arasından seçim yapılabilir: Kümülatif Hacim Farkı, Force Index ve On Balance Volume. Sonucun üzerine uyarlanabilir volatilite bantları çizilir ve kapanmış her mum beş rejim durumundan birine sınıflandırılır. Bu durum sayısal bir buffer olarak sunulur; böylece bir Expert Advisor onu doğrudan okuyabilir. Kaynak

Narayanan Mohanan Mohanan Krishnan
MACD and OBVCD on the same settings — Bitcoin weekly, 2019 to 2026

Both panes below use 50, 200, 20. The lower one is the standard MetaTrader MACD, computed on price. The upper one is the same construction computed on On Balance Volume — so it measures the convergence and divergence of accumulated volume rather than of price itself.

The chart covers two full Bitcoin cycles.

What I find interesting is not that one leads the other. It is that they answer different questions.

The MACD histogram tracks price momentum, and on a weekly chart across seven years it does that cleanly. But it is describing something you can already see by looking at the candles above it.

The OBV version is describing whether volume was accumulating or distributing while that price move happened. Through 2024 and into 2025 the histogram runs green and expanding — volume building alongside the advance. The turn to red at the right edge comes as that accumulation reverses.

The five colours are the part I actually use. Green above the upper band means momentum expanding; light green means still above the band but fading; grey means inside the bands, no regime; orange and red are the bearish equivalents. The bands are a 20-period standard deviation on the histogram itself, so they widen and contract with activity instead of relying on fixed levels.

That state is also exposed as a buffer — values +2 to −2 — so an EA can read the regime directly rather than re-deriving it from the plot.

Neither indicator predicts anything. Both are descriptive: they tell you what has happened to price momentum and to volume momentum respectively. I mention that because the interesting part of this chart is the disagreement between the two panes, not a signal from either.

Free demo on the product page, and the buffer map is documented in the description.

Five MT5 indicators published, three of them free — currency strength, Force Index, and volume delta, all with documented buffers. Happy to answer questions about any of the calculations.

Five MT5 indicators published, three of them free — currency strength, Force Index, and volume delta, all with documented buffers. Happy to answer questions about any of the calculations.

https://www.mql5.com/en/users/naamo/seller
12