Narayanan Mohanan Mohanan Krishnan
  • 信息
经验
18
产品
0
演示版
0
工作
0
信号
0
订阅者
ML/Python/MQL Developer Independent
我为 MetaTrader 开发测量工具。它们描述市场已经发生了什么,并明确说明每项测量的局限,而不是加以掩饰。

三十年的生产系统与自动化经验,2020 年转向量化研究。研究工作在 Python 中进行——回测框架、前向验证、对大量候选策略的统计评估——经受住检验的成果才会成为指标或智能交易系统。方法论以证伪为先:在样本外得到验证之前,任何结果都被视为假象。上架的每件工具都载明自身测量的局限,说明读数在何处不再具有意义,并记录两个平台出现分歧之处,而不是悄悄取平均值。
此处发布的任何产品都不产生交易信号,也都不附带任何业绩宣称。
____________________________________________________________________
🔬 MEASUREMENT — point it at any indicator and read what it actually does
▸ Indicator Test Report · 🆓 · MT5 — twelve checks, a plain-language report https://www.mql5.com/en/market/product/191061
▸ Indicator Test Report MT4 · 🆓 · MT4 https://www.mql5.com/en/market/product/192010
____________________________________________________________________
📊 CURRENCY STRENGTH — the eight majors decomposed from all 28 pairs
▸ Multi Timeframe Currency Strength Panel · 🆓 · MT5 https://www.mql5.com/en/market/product/188552
▸ MTF Currency Strength Panel MT4 · 🆓 · MT4 https://www.mql5.com/en/market/product/189304
▸ Currency Strength Oscillator MT5 · $39 · MT5 — the same decomposition as a history https://www.mql5.com/en/market/product/188624
▸ Currency Strength Oscillator MT4 · $39 · MT4 https://www.mql5.com/en/market/product/189507
____________________________________________________________________
📈 VOLUME AND ORDER FLOW
▸ Anchored Volume Delta with Adaptive Bands · 🆓 · MT5 https://www.mql5.com/en/market/product/188383
▸ Anchored Volume Delta with Adaptive Bands MT4 · 🆓 · MT4 https://www.mql5.com/en/market/product/188916
▸ OBVCD Pro · $49 · MT5 https://www.mql5.com/en/market/product/172855
▸ OBVCD Pro MT4 · $49 · MT4 https://www.mql5.com/en/market/product/189055
____________________________________________________________________
⚡ MOMENTUM AND VOLATILITY
▸ Force Index with Adaptive Volatility Bands · 🆓 · MT5 https://www.mql5.com/en/market/product/188434
▸ Force Index with Adaptive Volatility Bands MT4 · 🆓 · MT4 https://www.mql5.com/en/market/product/189058
____________________________________________________________________
🔍 REGIME AND STRUCTURE
▸ Oscillator Regime Suite · $89 · MT5 https://www.mql5.com/en/market/product/188673
▸ Oscillator Regime Suite MT4 · $89 · MT4 https://www.mql5.com/en/market/product/189783
▸ Structure Flow and Trailing Stop · $99 · MT5 https://www.mql5.com/en/market/product/188849
▸ Structure Flow and Trailing Stop MT4 · $99 · MT4 https://www.mql5.com/en/market/product/190923
____________________________________________________________________
📐 TREND PERSISTENCE — how often the current state has survived to the next bar
▸ Trend Survival States · 🆓 · MT5 — the five-state classification https://www.mql5.com/en/market/product/190790
▸ Trend Survival Rate · $99 · MT5 — adds the survival rate and a Brier forecast score https://www.mql5.com/en/market/product/190792
____________________________________________________________________
🧪 测试环境
这里的一切均在 Exness 上开发和测试,使用可提供全部 28 个主要货币对的实盘终端,并已核查从 M1 到 MN1 的历史深度——包括我在 Currency Strength Oscillator listing 中发现并记录的数据缺口,而不是留给买家去发现。我是 Exness 的介绍经纪人;若您通过我的链接开户,我将获得佣金,您应当依据自己的标准而非我的标准来选择经纪商。本主页并非由 Exness 拥有或运营。

▸ 开设账户: https://one.exnessonelink.com/a/d3zld339yo
______________________________________________________________________________________________________________
✉️ 关于计算方法、缓冲区,或如何将这些工具与您自己的工具配合使用——请给我留言。我会回复。
Narayanan Mohanan Mohanan Krishnan 已发布产品

MetaTrader 5 的Indicator Test Report — 重绘检查器和指标测试器,显示任何指标的实际行为 您无法看到编译指标的内部情况。Indicator Test Report加载任何指标(购买的、编写的或内置到 MetaTrader 中)并回答描述无法回答的问题:它是否重新绘制、它需要多少历史记录以及它真正发布了什么?它报告行为。它不评分。 将任何指标加载到策略测试器中,并获得有关其行为的十二个方面的简单语言报告:它发布了多少缓冲区,在其值有意义之前需要多少历史记录,闭合柱上的值随后是否会发生变化,以及读取成本。 没有分数,没有及格分数,也没有关于指标是否良好的判断——只有观察到的内容,以及它证明了什么和没有证明什么。 它回答什么 1. 缓冲器。 该指标实际发布了多少个编号数据系列,以及响应的最高指数。这通常比图表显示的要多:两线指标可能会发布 6 个缓冲区,而 EA 按索引读取需要实数。报告指出,如果索引不连续,则通过计数进行索引会读取错误的序列。 2. 计算状态。 目标根据存在的柱数计算了多少柱。填充缓冲区为零是一种真实的命名状态,而不是错误。

Narayanan Mohanan Mohanan Krishnan 已发布产品

MetaTrader 4 的Indicator Test Report — MT4 重绘检查器和指标测试器,显示任何指标的实际行为 您无法看到编译指标的内部情况。Indicator Test Report加载任何指标(购买的、编写的或内置到 MetaTrader 中)并回答描述无法回答的问题:它是否重新绘制、它需要多少历史记录以及它真正发布了什么?它报告行为。它不评分。 将任何指标加载到策略测试器中,并获得有关其行为的十二个方面的简单语言报告:它发布了多少缓冲区,在其值有意义之前需要多少历史记录,闭合柱上的值随后是否会发生变化,以及读取成本。 没有分数,没有及格分数,也没有关于指标是否良好的判断——只有观察到的内容,以及它证明了什么和没有证明什么。 它回答什么 1. 缓冲器。 该指标实际发布了多少个编号数据系列,以及响应的最高指数。这通常比图表显示的要多:两线指标可能会发布 6 个缓冲区,而 EA 按索引读取需要实数。报告指出,如果索引不连续,则通过计数进行索引会读取错误的序列。 2. 计算状态。 目标根据存在的柱数计算了多少柱。填充缓冲区为零是一种真实的命名状态,而不是错误。

Narayanan Mohanan Mohanan Krishnan 已发布产品

结构流程和追踪止损 MT4 — 具有五种追踪止损方法、市场结构和 MetaTrader 4 流动性范围的自适应流程线 五种追踪止损方法、一种自适应流程线以及一个报告有多少测量值一致的条件面板。 该指标在价格图表上绘制两条线:一条跟随市场方向的自适应流动线,以及一条仅沿该方向移动且永不返回的追踪止损线。一个小小组报告了他们背后的状态。 追踪止损可以用五种不同的方式计算。这些并不是同一个想法的变体——每个想法都有不同的锚点,并且在同一张图表上他们经常存在分歧。 结构流和追踪止损也可用于 元交易者 5 。这个 MT4 版本是它的直接移植,逐条验证 - 比较将在下面进一步描述。 流线 自适应平均值。当价格旋转时,它会严重平滑,而当价格波动时,它会轻微平滑,因此它在移动过程中保持接近,而无需追逐范围内的每个波动。三个输入控制它:它测量的窗口,以及它可能使用的最快和最慢的平滑。 当价格尚未偏离该线足够远以至于不值得关注时,噪声滤波器会保持该线不变。该阈值以 ATR 表示,因此它与工具成比例,而不是假定点值。 追踪止损及其五种方法

Narayanan Mohanan Mohanan Krishnan
Crude oil closed at 81.518 on Friday. Three charts of the same instrument, three different measurements, and they do not agree with each other. That is not a fault in any of them. It is what happens when you ask three questions that only sound like the same question...
Narayanan Mohanan Mohanan Krishnan 已发布产品

Trend Survival States for MetaTrader 5 — 一种自由市场制度指标,通过自适应波动带和五种状态趋势分类来衡量牛市和熊市压力 牛市和熊市压力、自适应区间价差以及五种状态的市场分类,MT5 免费。 它衡量当前走势背后的买卖压力,并将其分为市场状态:强牛、弱牛、中性、弱熊、强熊。 这是一个完整的制度指标,不是限时试用,也不是残缺的演示。图表上绘制的所有内容都是完整的计算。 付费版本添加了什么。 趋势生存率报告当前状态存活到下一个柱的频率,并使用 Brier 分数预测实际发生的情况。此免费版本不包含这两个数字以及管理它们的设置。其他一切都是相同的 - 并且两者可以同时在同一个图表上运行,因此差异是可见的而不是描述的。 它是如何运作的 根据价格计算出两个压力分量:上包络线和下包络线,每个压力分量都通过回溯窗口进行测量。它们之间的区别在于传播,其符号表示哪一方占主导地位。价差上的自适应标准差带表明该工具的主导地位是普通还是不寻常。 符号和条带一起将每个完成的条形分为五个状态之一。标志决定方向;乐队决定信念。

Narayanan Mohanan Mohanan Krishnan 已发布产品

MetaTrader 5 的趋势存活率 — 一种市场状况指标,用于衡量当前趋势状态存活到下一个柱的频率,并对其自己的预测进行评分 趋势生存率、市场状态分类和实时 Brier 预测分数,位于一个 MT5 指标窗口中。 它衡量当前走势背后的买卖压力,将其分类为市场状态,并报告该状态持续到下一个柱的频率 - 然后根据实际发生的情况对自己的预测进行评级。 大多数指标都会告诉您具体情况。这还可以告诉你,在读完这篇文章之后,有多少次会出现更多相同的内容,以及最近的表现如何。 提供免费版本:Trend Survival States。 它绘制了相同的压力、分布、范围和五种状态分类——生存率和预测分数是这个付费版本添加的。两者可以同时在同一个图表上运行。 它是如何运作的 根据价格计算出两个压力分量:上包络线和下包络线,每个压力分量都通过回溯窗口进行测量。它们之间的区别在于传播,其符号表示哪一方占主导地位。价差上的自适应标准差带表明该工具的主导地位是普通还是不寻常。 符号和带一起将每个完整的柱形分为五种状态之一:强牛、弱牛、中性、弱熊、强熊。标志决定方向;乐队决定信念。

Narayanan Mohanan Mohanan Krishnan
Three charts of the same instrument, the same indicator and the same settings. Force Index with adaptive volatility bands at 13, 20 and 2.0 deviations, on BTCUSD monthly, weekly and daily. The Force Index on the closed daily bar of 12 August reads −11,252,859.29...
Narayanan Mohanan Mohanan Krishnan 已发布产品

本指标将收敛/发散结构——快速移动平均线减去慢速移动平均线,并配以信号线——应用于 由成交量派生的序列 ,而非价格。可选择三种数据源:累积成交量差额、强力指数与能量潮。 结果之上绘制自适应波动率通道,并将每一根已完成的K线归类为五种市场状态之一。该状态以数值缓冲区的形式开放,因此 EA 可以直接读取。 数据源为何重要 标准 MACD 衡量的是价格动量,而这在上方的K线中本就一目了然。这三种数据源衡量的是另一件事:在价格发生该走势的同时,成交量究竟在积累还是在派发。 三者并不可以互相替代。其中一张截图在同一图表上以完全相同的参数同时显示三者,以便并排观察差异。 累积成交量差额 — 带符号成交量的累积值,在每日、每周或每月开始时重新锚定。正是这一锚定使其成为一种交易时段度量,而非全历史度量。 强力指数 — 该K线的价格变动乘以其成交量,再进行平滑。与另外两者属于不同的量。 能量潮 — 带符号成交量的累积值,自历史起点连续累加,不做重置。

Narayanan Mohanan Mohanan Krishnan
A daily XAUUSD chart can look fairly simple until several independent measurements are placed beside the price. On the chart below, gold has recovered from the July decline...
Narayanan Mohanan Mohanan Krishnan 已发布产品

MetaTrader 4 的货币强弱振荡器 绘制八个主要货币历史的相对货币强弱指标。 该货币强弱振荡器绘制了八种主要货币的相对强弱历史图,由 28 主要对。虽然标准货币强弱表可以告诉您目前的情况,但它显示了它们是如何到达那里的——哪种货币一直在走强,哪种货币已经转手,以及排名在哪里易手。 所有八个系列均作为记录的指标缓冲区公开,因此 Expert Advisor 可以直接从 MetaTrader 4 读取货币强度。 分解如何进行 八种货币中的每一种都出现在二十八对中的七对中。它的强度是这七个读数的平均值,无论报价货币在哪里,符号都是倒置的——下跌 AUDJPY 意味着日元走强,而不是走弱。 每对货币对恰好两种货币有贡献,对其基础货币为正值,对其报价为负值,因此在整个货币对中,这些贡献相互抵消,八种优势之和为零。该指标将其用作内部检查:如果值不平衡,则分解将是错误的。这也意味着读数是相对的而不是绝对的。一种货币本身并不坚挺,只是相对于其他货币坚挺。 由于计算读取的是货币而不是图表,因此无论指标位于哪个符号上,都会出现相同的八条线。 历史表明快照不能

Narayanan Mohanan Mohanan Krishnan 已发布产品

MTF Currency Strength Panel for MetaTrader 4 多时间框架货币强度指标:全部 28 个主要货币对集中显示在一张图表上。 这款货币强度面板显示八大货币当前的相对位置,以及 28 个主要货币对在九个时间框架(M1 至 MN1)上的走势。两组读数同处一张图表,并按计时器刷新。 单独对对进行排名是有误导性的。当单一货币移动时,包含该货币的每对货币都会随之移动,因此货币对排名的顶部通常是重复七次的同一种货币。该面板通过将整个矩阵分解为单独的货币强度,将驱动因素与重复因素分开。 分解如何进行 八种货币中的每一种都出现在二十八对中的七对中。它的强度是这七个读数的平均值,无论报价货币是什么,符号都是倒置的——澳元兑日元下跌意味着日元走强,而不是走弱。 每对货币对两种货币都有贡献——对其基础货币为正值,对其报价为负值——因此在全部 28 种货币中,这些贡献相互抵消,八种货币的优势之和为零。专家组将其用作内部检查:如果数值不平衡,分解就会错误。这也意味着读数是相对的而不是绝对的。一种货币本身并不坚挺,只是相对于其他货币坚挺。

Narayanan Mohanan Mohanan Krishnan
Elder's Force Index is one of the few classical indicators that combines price and volume in a single line. Each bar contributes (close − previous close) × volume. Positive when buyers carried the bar, negative when sellers did, and proportional to how much was traded doing it...
Narayanan Mohanan Mohanan Krishnan
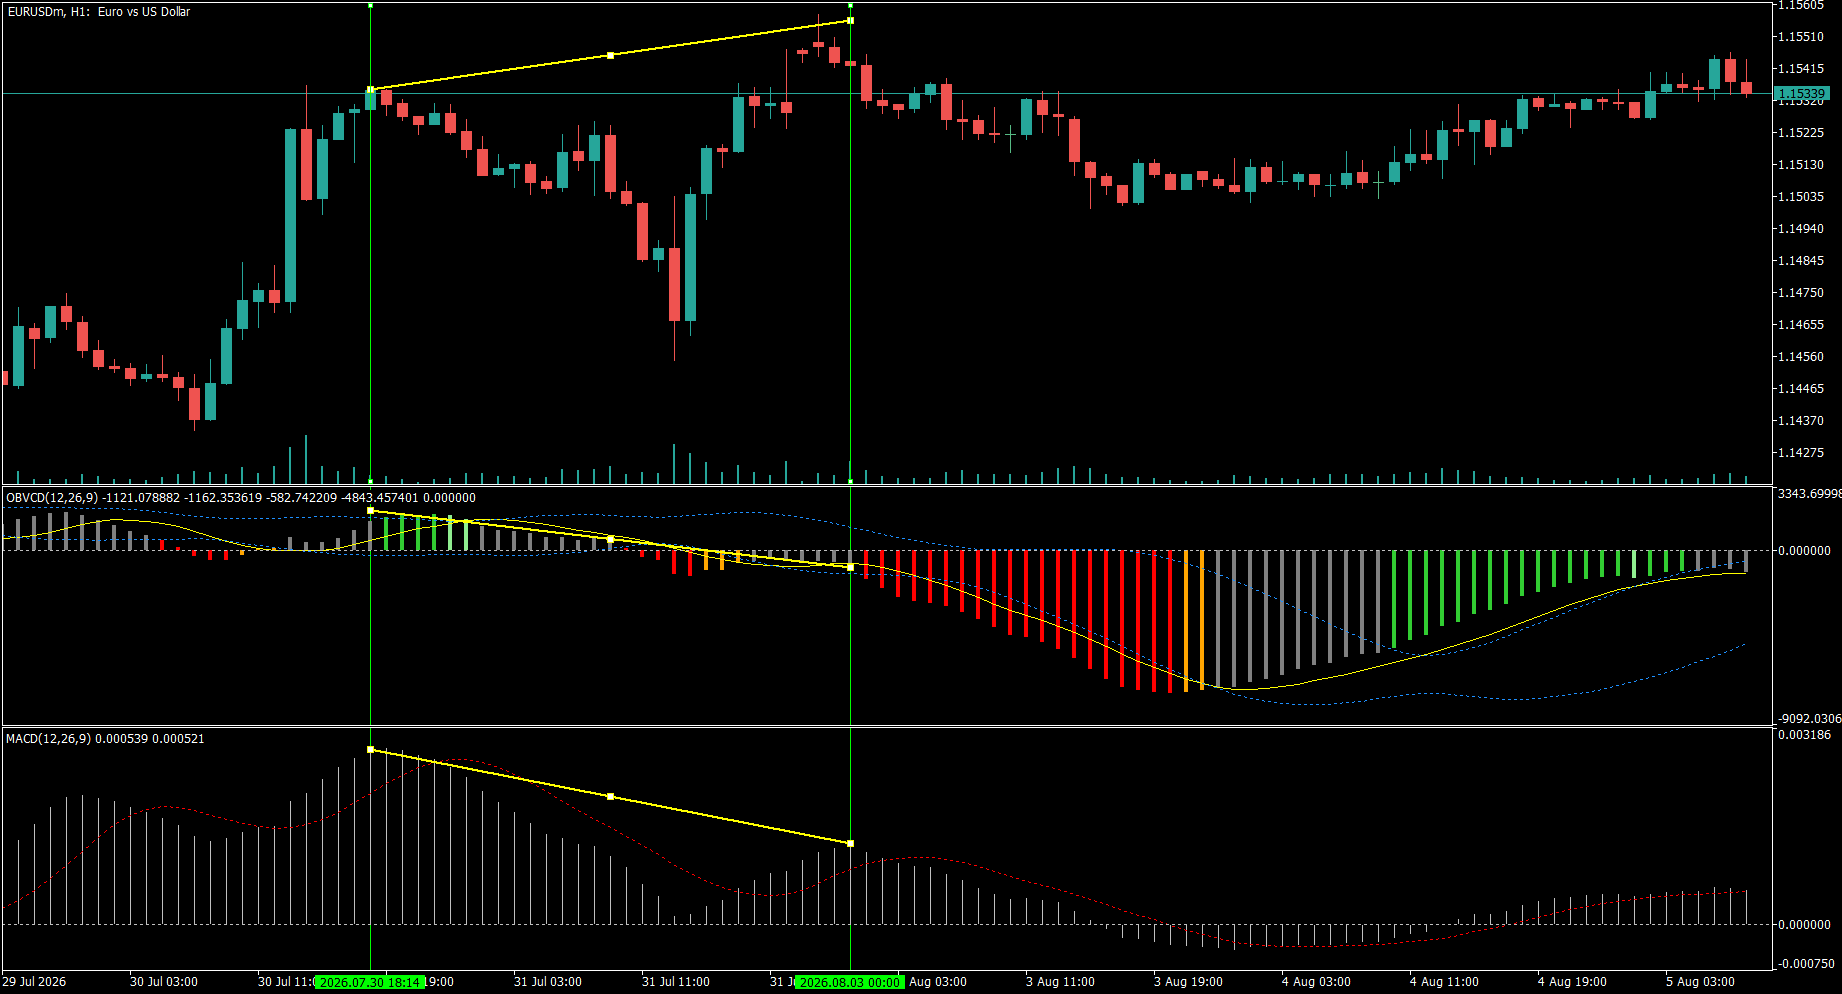
EURUSD H1 — the same divergence, two different answers

Between 30 July and 3 August, price made a higher high. Standard MACD made a lower high. So did OBVCD — the same 12/26/9 construction applied to On-Balance Volume instead of price. Both oscillators disagreed with price, and MACD showed the divergence more steeply of the two.

Then they parted company. At the second marked line OBVCD had crossed below zero — reading -1121 against its signal at -1162. MACD at the same bar was still positive: +0.000539, signal +0.000521. Price rolled over afterwards.

That difference is the whole point of the pane. A divergence is a statement about slope: the new high was made with less momentum than the last. A zero-line cross is a statement about state: the fast average has fallen below the slow one, so the underlying series has actually turned. Price momentum had not turned yet. Cumulative volume flow had.

Neither reading is a signal to act, and the same chart shows why — follow it right and the decline exhausts, OBVCD climbs back through zero, and the histogram turns green again. That is the honest shape of it.

Descriptive, not predictive. One instance on one instrument, shown because the sequence is legible, not because it repeats.

#EURUSD #OBVCD #MACD #divergence #volume #technicalanalysis #MT5 #MT4
Narayanan Mohanan Mohanan Krishnan 已发布产品

该指标绘制了 力指数 — 每个条形的价格变化乘以其交易量 — 在自适应标准偏差带内。仅价格可以告诉您市场的变化,而力量指数则可以告诉您为推动市场变化付出了多少努力。 即使蜡烛看起来很相似,成交量较小时价格的大变化和成交量大时价格的小变化是非常不同的事件。力指数通过将两者合并为一个读数来将它们分开,并且乐队将该读数置于仪器自身最近行为的背景下。 它是如何运作的 对于每个柱,原始力量指数是当前收盘价与前一收盘价之间的差值乘以该柱的交易量。当柱线收盘走高时为正值,当收盘走低时为负值,并根据交易量进行调整。默认使用报价量;实际交易量在经纪商提供的地方自动应用。 然后使用您选择的平均方法在选定的时间段内对该原始序列进行平滑处理。平滑在这里很重要:未平滑的力量指数非常嘈杂,您选择的时间段决定您是关注短期努力还是长期波动。 20 个周期的基础及其标准偏差是在平滑序列上计算的,并且上限和下限放置在选定的偏差倍数处。因为这些频段是根据系列自身的可变性构建的,所以当努力变得不稳定时,它们会变宽,而当稳定时,它们会收缩。 为什么乐队很重要

Narayanan Mohanan Mohanan Krishnan 已发布产品

49.00 USD

OBVCD Pro 是一款动量振荡器,将收敛/发散分析应用于 能量潮指标(OBV) 而非价格,并结合自适应波动通道与五状态市场划分——既可在图表上直观读取,也可由 EA 直接读取。 大多数经典震荡指标仅分析价格。 OBVCD Pro 根据累积交易量计算收敛和发散,因此它衡量市场变动背后的参与度,而不仅仅是变动本身。结果被简化为单一制度值,该值对于自由交易者和算法系统同样可用。 它是如何运作的 平衡交易量 (OBV) 根据所选交易量源计算。默认情况下使用逐笔交易量,并在经纪商提供的地方自动应用实际交易量。 快速和慢速移动平均线是在 OBV 系列上计算的(默认为 EMA 12 和 EMA 26)。它们之间的差异形成了 OBVCD 直方图 。一个 信号线 然后根据该直方图进行计算,默认使用 9 周期 SMA。 波动率上限和下限是根据 20 周期标准差和 1.618 偏差乘数计算得出的。这些波段可以应用于信号线或直接应用于直方图。 由于区间基于标准差,因此它们在市场活动活跃期间自动扩大,并​​在市场活动下降时收缩。这允许一组默认设置在非常不同的仪器上保持可用,而不是依赖于固定阈值。

Narayanan Mohanan Mohanan Krishnan 已发布产品

本指标绘制 累积成交量差(CVD) ——将每根K线的成交量按其收盘方向赋予正负后累加得到的滚动总和——并置于自适应标准差通道之中。它回答了单看价格无法回答的问题:这波行情是由参与度推动的,还是只是在漂移? 累积总和会在您选择的 锚定点 重新开始——按日、按周或按月——因此读数始终相对于当前的交易日、当周或当月,而不是相对于图表历史的起点。正是这一个设置,使同一个指标既适用于一分钟的外汇图表,也适用于日线的指数图表;也正是它,把本指标与那种只会从您历史数据碰巧开始之处不断累加的普通累积成交量线区分开来。 工作原理 每根K线将其成交量计入累积总和:收盘高于前一根收盘时相加,低于时相减,收平时不变。 随后在该累积序列上计算20周期的中轨及其标准差,上下轨则置于标准差的指定倍数处。由于通道由序列自身的波动性构建,参与度剧烈时通道变宽,趋于平稳时收窄——无需为每个品种重新调整固定阈值。 当累积总和到达锚定边界时会归零并重新开始。在图表上这表现为线条的一次干净重启,通道随即围绕新的周期重新成形。 通道说明什么

Narayanan Mohanan Mohanan Krishnan
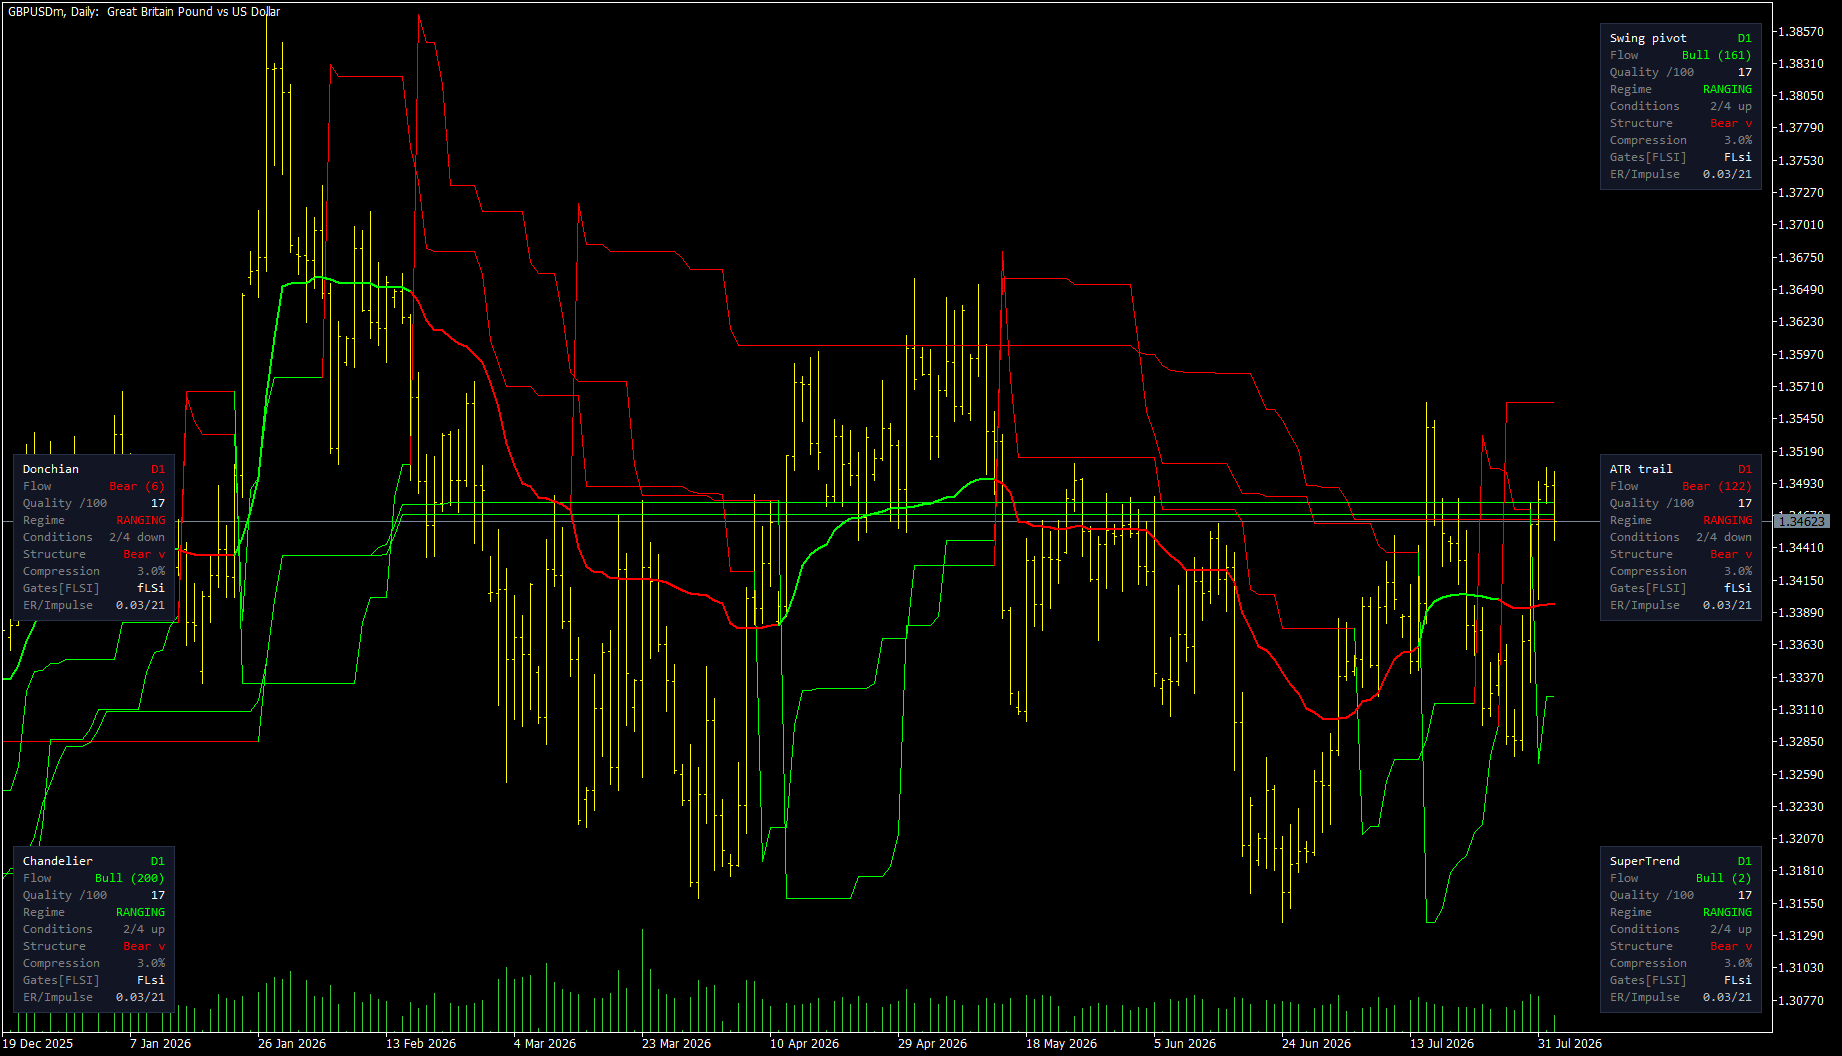
Five trailing stops on one chart. Three say up, two say down.

Same instrument, same daily bars, same settings. GBPUSD.

Swing pivot: bullish, 161 bars. Chandelier: bullish, 200 bars. SuperTrend: bullish, but only 2 bars — it just flipped. ATR trail: bearish, 122 bars. Donchian: bearish, 6 bars.

Five methods, three answers up and two down, and none of them is wrong.

They disagree because they anchor to different things. A trailing stop has to decide what it is trailing behind, and that choice is the whole method:

The swing pivot sits where the market last turned. The ATR trail keeps a fixed volatility distance from a smoothed average. SuperTrend brackets each bar's median price and flips when the close crosses. Chandelier hangs from the highest point of the move so far. Donchian uses only the highest high and lowest low, with no volatility term at all.

Four of those five use ATR. One doesn't. That is deliberate — a single ATR multiple is one opinion about how much room to give, and it is a famously poor one at the moments that matter most, when volatility is compressed right before it expands.

The interesting part is not which method is right. It is that all five panels agree the regime is ranging.

That is what a rangebound market looks like when you measure it five ways: the methods scatter. In a strong trend they converge — same chart, different period, they sit within a narrow band of each other.

So the spread between them carries information that no single stop level does. Wide spread, no structure to anchor to. Narrow spread, the market is doing something all five can agree on.

I have not tested whether that spread predicts anything, and I would want a few thousand samples before saying it does. But as a description of the present it is more honest than any one line.

All five methods are in one indicator — Structure Flow and Trailing Stop, on the MQL5 Market.

#quantitativefinance #algorithmictrading #mql5 #tradingsystems #forex #technicalanalysis
Narayanan Mohanan Mohanan Krishnan 已发布产品

本指标在价格图表上绘制两条线:一条跟随市场方向的自适应流向线,以及一条只朝该方向移动、绝不回退的跟踪止损。一个小面板显示其背后的市场状态。 跟踪止损可以用五种不同的方法计算。它们并非同一思路的变体——每一种锚定的对象都不同,在同一张图表上它们经常给出不一致的结论。 流向线 一条自适应均线。当价格来回震荡时它平滑得更重,当价格单向行进时平滑得更轻,因此在行情推进时紧贴价格,又不会在震荡区间里追逐每一次波动。三个参数控制它:测量窗口,以及所允许的最快与最慢平滑程度。 噪声过滤会在价格尚未离开该线足够远时保持它不动。该阈值以 ATR 表示,因而会随品种自动缩放,而不是假定某个固定的点值。 跟踪止损及其五种方法 止损只朝趋势方向推进。它绝不逆趋势移动,也绝不回撤,因此在盘整期间会保持原有水平,而不会向价格靠拢。当价格穿越它时,趋势反转,止损移至另一侧。 摆动枢轴 — 锚定于流向线最近一次的摆动位置,若 ATR 跟踪更贴近则改用后者。属于结构型:它位于市场上一次转向的位置。 ATR 跟踪 — 与流向线保持固定的 ATR

Narayanan Mohanan Mohanan Krishnan 已发布产品

本指标将收敛/发散结构——快速移动平均线减去慢速移动平均线,并配以信号线——应用于 由成交量派生的序列 ,而非价格。可选择三种数据源:累积成交量差额、强力指数与能量潮。 结果之上绘制自适应波动率通道,并将每一根已完成的K线归类为五种市场状态之一。该状态以数值缓冲区的形式开放,因此 EA 可以直接读取。 数据源为何重要 标准 MACD 衡量的是价格动量,而这在上方的K线中本就一目了然。这三种数据源衡量的是另一件事:在价格发生该走势的同时,成交量究竟在积累还是在派发。 三者并不可以互相替代。其中一张截图在同一图表上以完全相同的参数同时显示三者,以便并排观察差异。 累积成交量差额 — 带符号成交量的累积值,在每日、每周或每月开始时重新锚定。正是这一锚定使其成为一种交易时段度量,而非全历史度量。 强力指数 — 该K线的价格变动乘以其成交量,再进行平滑。与另外两者属于不同的量。 能量潮 — 带符号成交量的累积值,自历史起点连续累加,不做重置。

Narayanan Mohanan Mohanan Krishnan
MACD and OBVCD on the same settings — Bitcoin weekly, 2019 to 2026

Both panes below use 50, 200, 20. The lower one is the standard MetaTrader MACD, computed on price. The upper one is the same construction computed on On Balance Volume — so it measures the convergence and divergence of accumulated volume rather than of price itself.

The chart covers two full Bitcoin cycles.

What I find interesting is not that one leads the other. It is that they answer different questions.

The MACD histogram tracks price momentum, and on a weekly chart across seven years it does that cleanly. But it is describing something you can already see by looking at the candles above it.

The OBV version is describing whether volume was accumulating or distributing while that price move happened. Through 2024 and into 2025 the histogram runs green and expanding — volume building alongside the advance. The turn to red at the right edge comes as that accumulation reverses.

The five colours are the part I actually use. Green above the upper band means momentum expanding; light green means still above the band but fading; grey means inside the bands, no regime; orange and red are the bearish equivalents. The bands are a 20-period standard deviation on the histogram itself, so they widen and contract with activity instead of relying on fixed levels.

That state is also exposed as a buffer — values +2 to −2 — so an EA can read the regime directly rather than re-deriving it from the plot.

Neither indicator predicts anything. Both are descriptive: they tell you what has happened to price momentum and to volume momentum respectively. I mention that because the interesting part of this chart is the disagreement between the two panes, not a signal from either.

Free demo on the product page, and the buffer map is documented in the description.

Five MT5 indicators published, three of them free — currency strength, Force Index, and volume delta, all with documented buffers. Happy to answer questions about any of the calculations.

Five MT5 indicators published, three of them free — currency strength, Force Index, and volume delta, all with documented buffers. Happy to answer questions about any of the calculations.

https://www.mql5.com/en/users/naamo/seller
12