Why the Force Index is almost unusable across instruments — and the fix is older than the problem

Elder's Force Index is one of the few classical indicators that combines price and volume in a single line. Each bar contributes (close − previous close) × volume. Positive when buyers carried the bar, negative when sellers did, and proportional to how much was traded doing it.
It deserves more use than it gets. The reason it does not get it is arithmetic.
The problem, measured
Here is the same indicator, the same 13-period setting, read from six charts:
| Instrument | Timeframe | Force Index |
| ETHBTC | H1 | −0.01 |
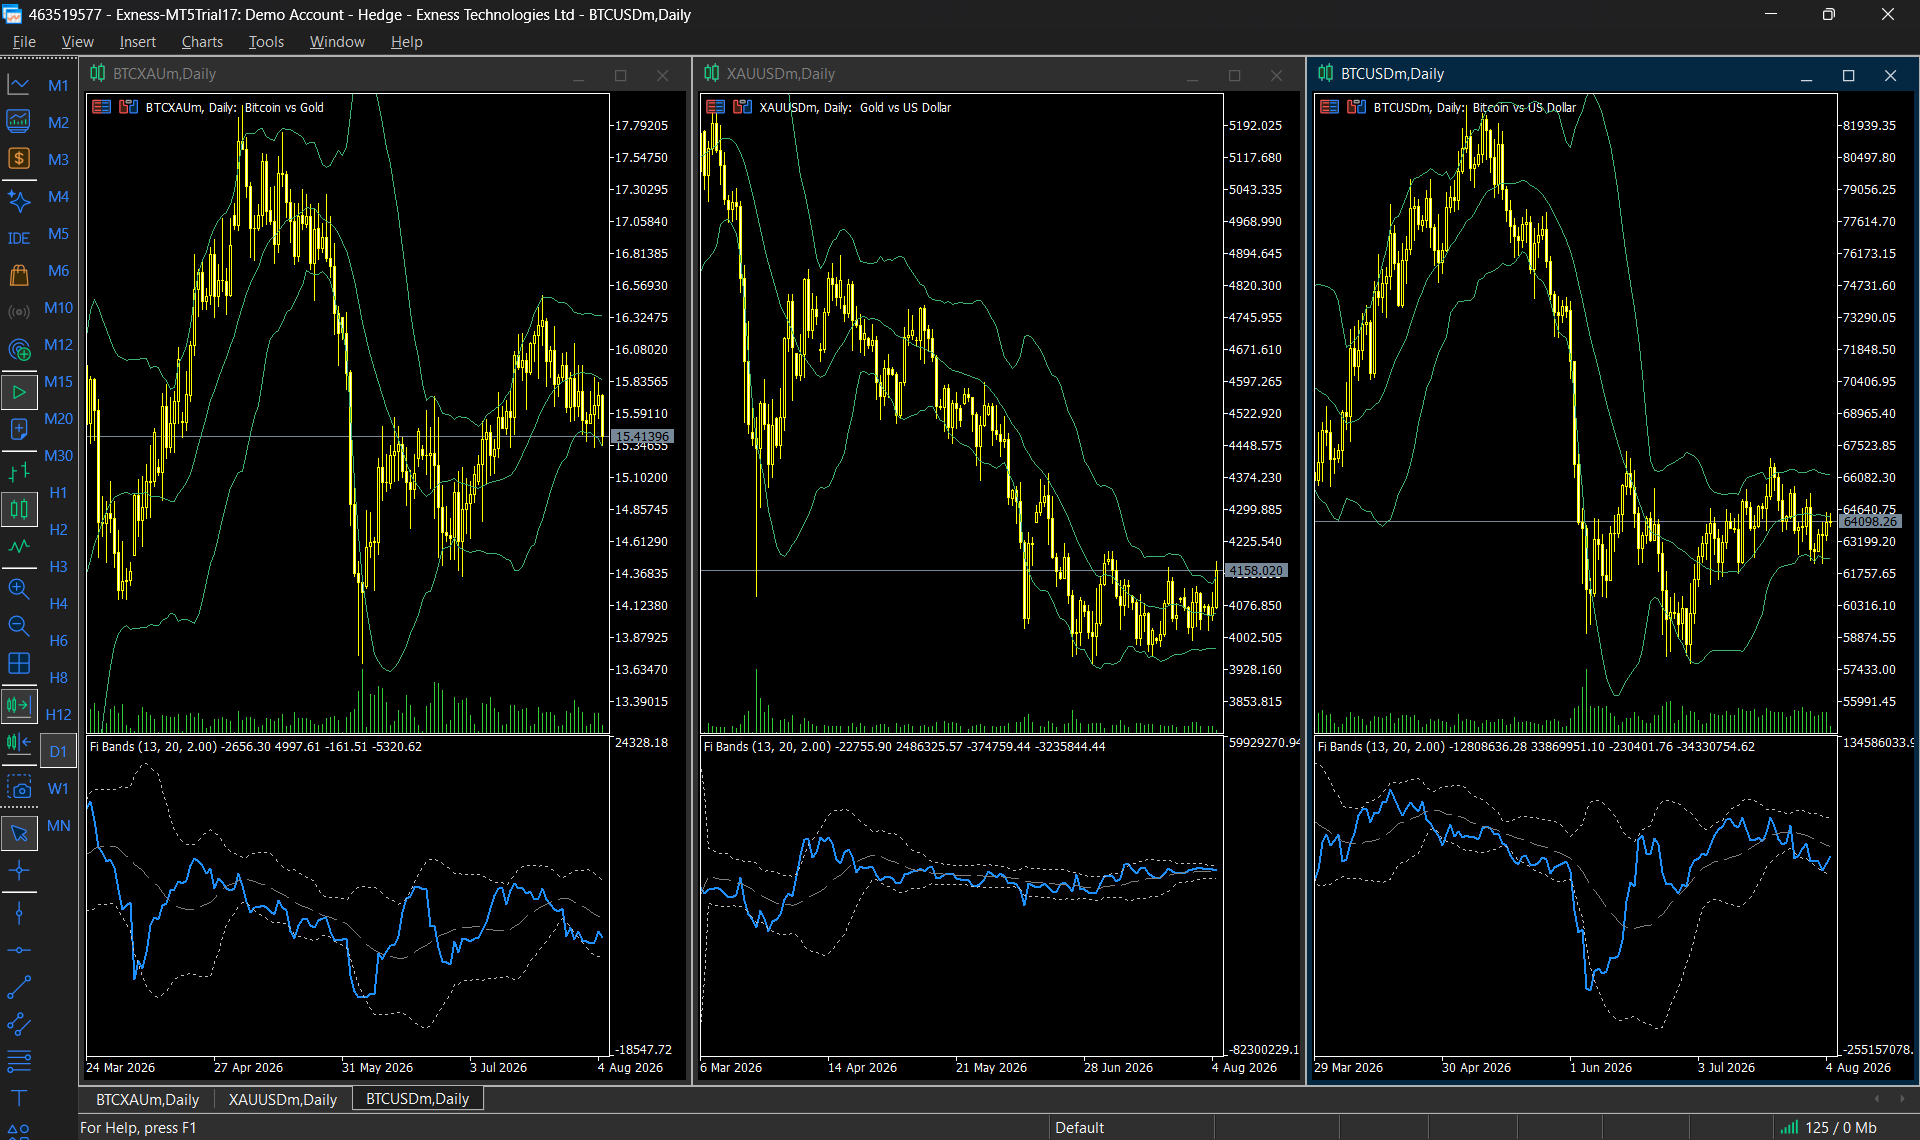
| BTCXAU | Daily | −2,656.30 |
| XAUUSD | Daily | −22,755.90 |
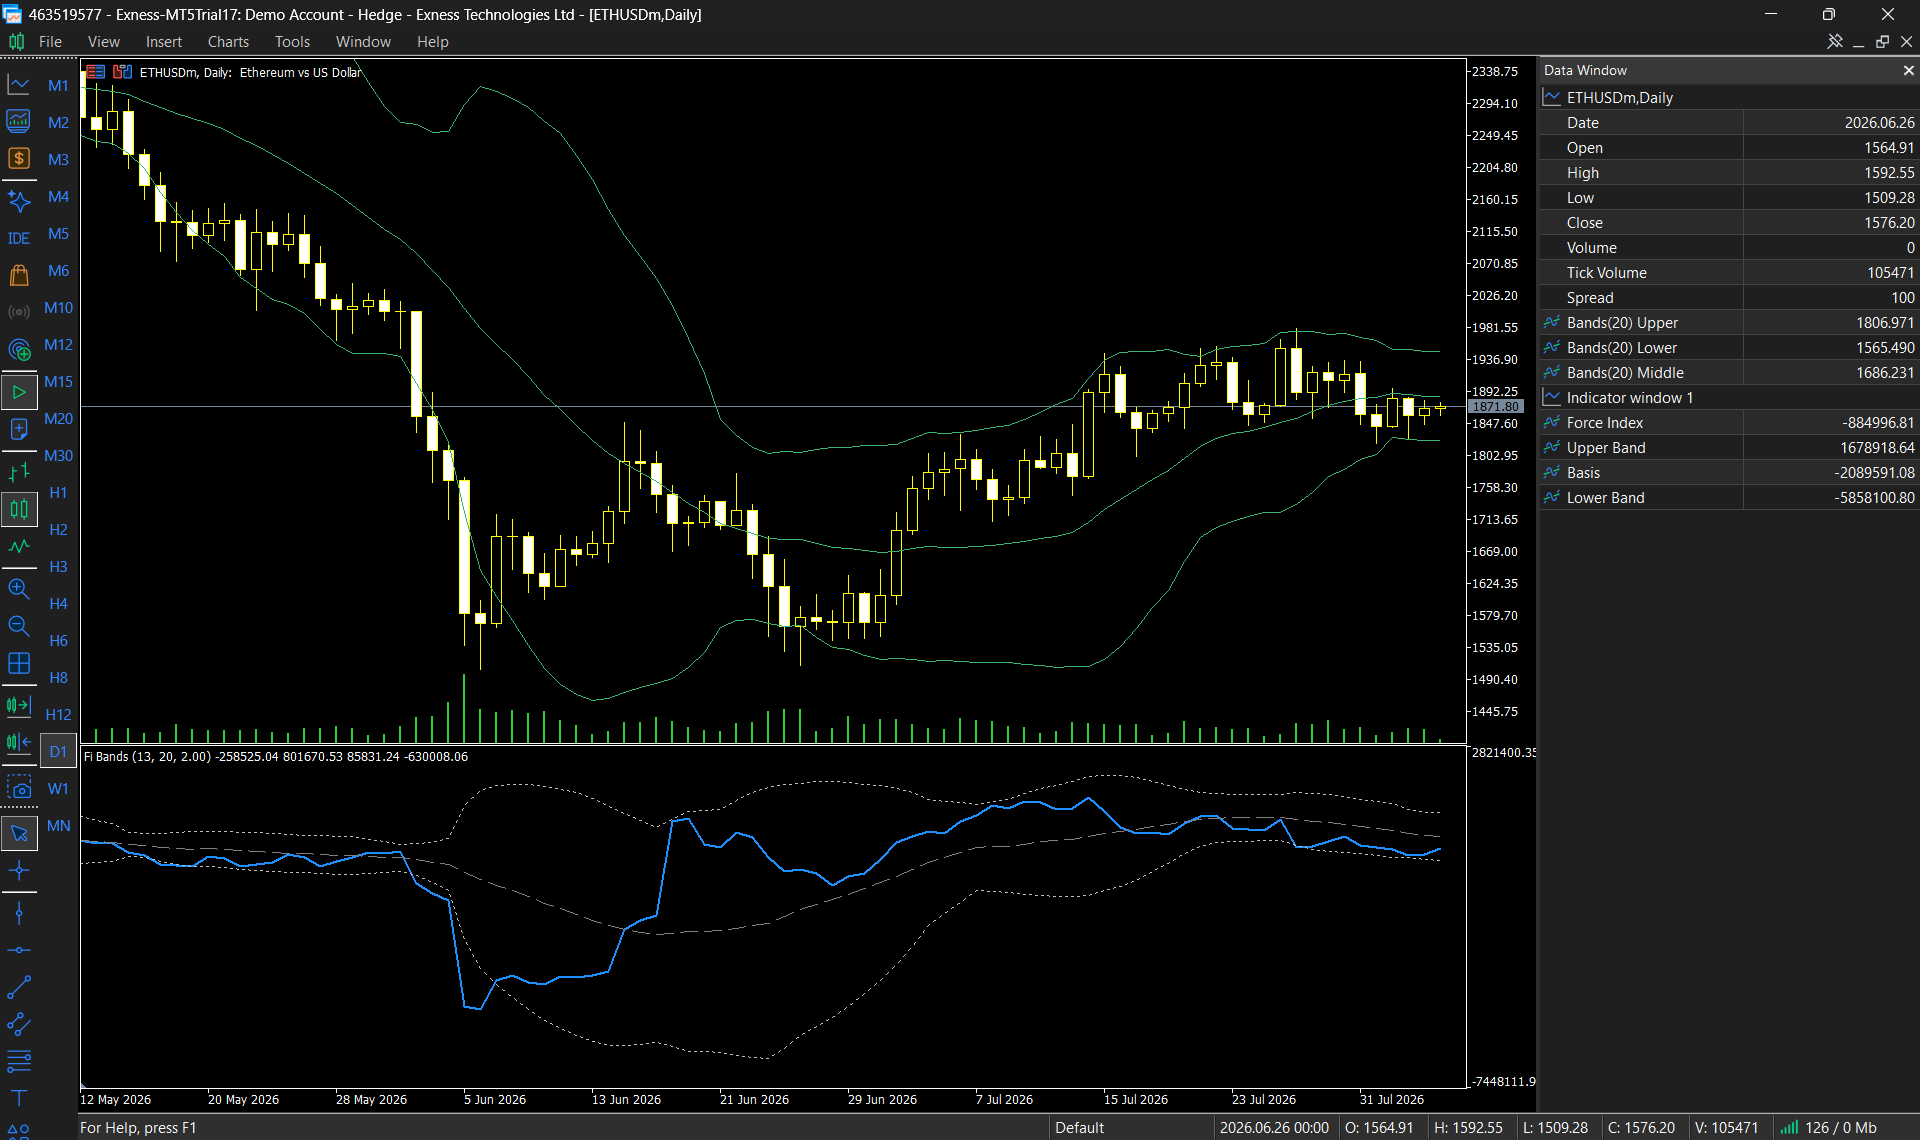
| ETHUSD | Daily | −884,996.81 |
| BTCUSD | Daily | −12,808,636.28 |
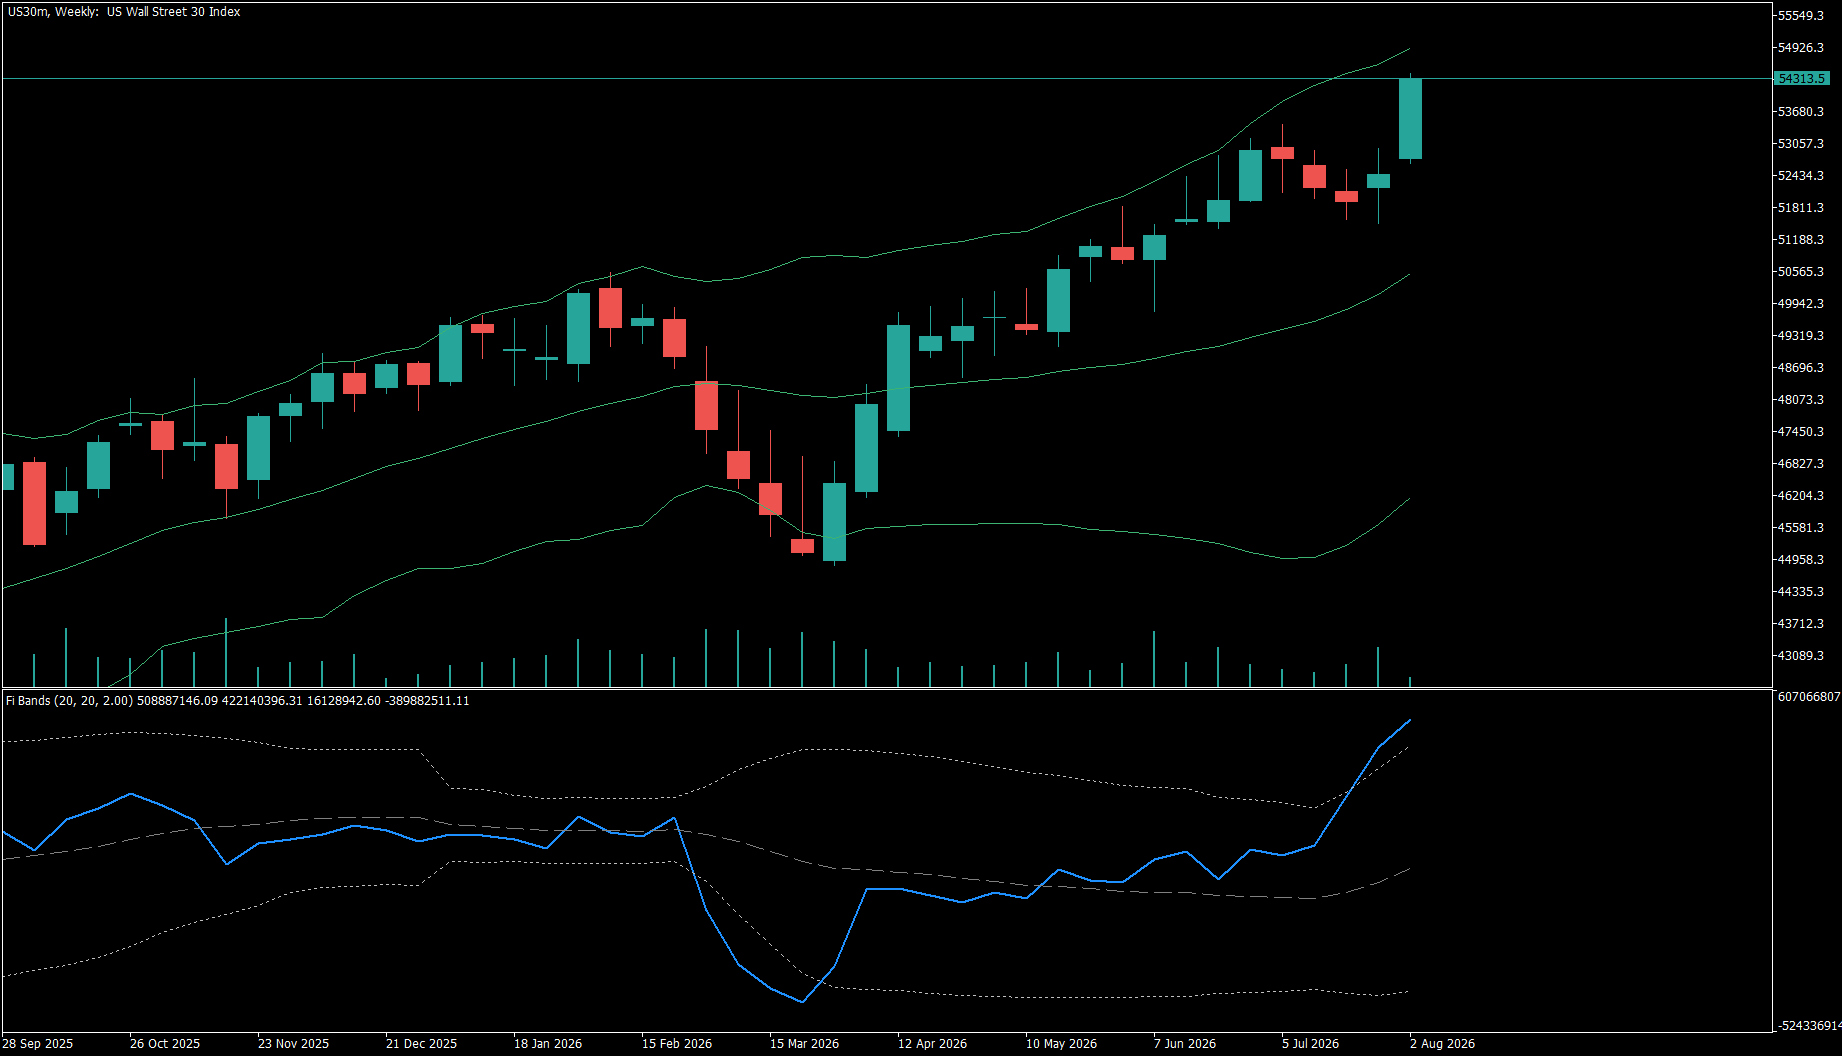
| US30 | Weekly | 508,887,146.09 |
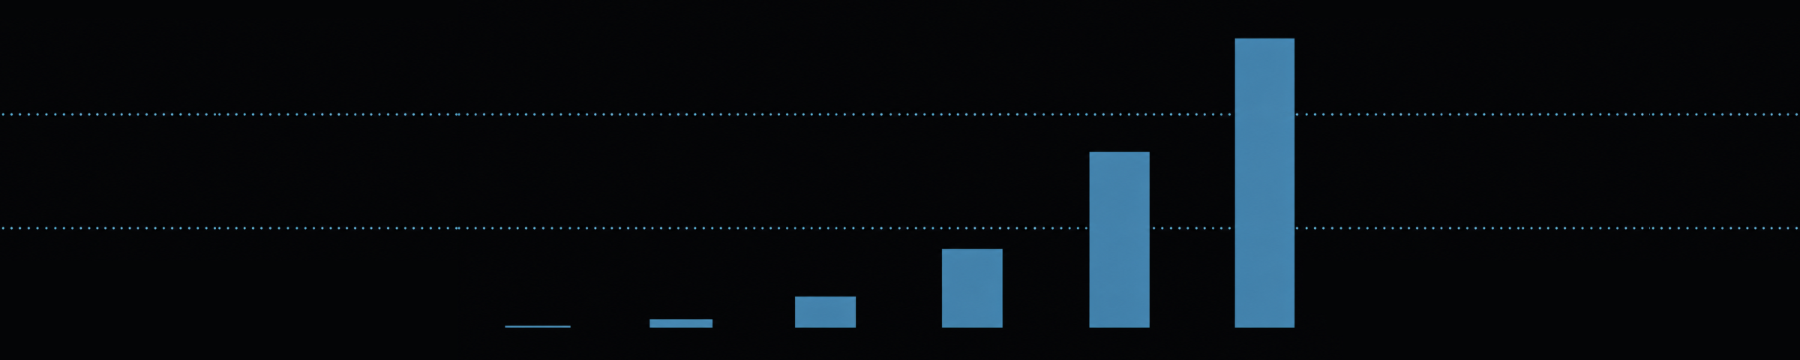
The US30 reading is about fifty billion times the ETHBTC one. Not because the markets differ in character, but because the Force Index carries the units of price multiplied by the units of volume — and neither is normalised. ETHBTC prices in fractions of a bitcoin; US30 prices in index points with index-scale volume behind it.
The consequence is practical. Any rule of the form "act when the Force Index exceeds X" is valid on exactly one symbol and one timeframe. Change either and X is meaningless. There is no default that travels, which is why most people who try the Force Index abandon it: the first thing they do is put it on a second instrument and find the scale unrecognisable.
Why the obvious fixes do not work
Dividing by average volume gives you back something close to price change. Dividing by price gives you something close to volume. Both discard the interaction that made the indicator interesting in the first place.
Normalising to a fixed range — 0 to 100, say — requires choosing a lookback for the maximum, and the result then depends entirely on whether an outlier sits inside that window. A single extreme bar compresses everything after it.
The fix
Express the value in standard deviations of its own recent history.
Take a 20-period moving average of the Force Index. Compute the standard deviation of the Force Index over the same 20 periods. Place bands at two deviations either side. This is the Bollinger construction, applied to the Force Index instead of price.
The units cancel. A reading outside the band means the same thing on every chart: this value is unusual relative to how this instrument has been behaving recently. Whether the raw number is 0.04 or 400 million stops mattering.
What this does and does not give you
It gives you one parameter set that works everywhere. No per-symbol calibration, no threshold table, nothing to re-tune moving from crypto to metals to an index.
It gives you an adaptive definition of "unusual". When volatility expands the bands expand with it, so a quiet market and a violent one are each judged against themselves.
It does not give you a signal. A band excursion says a reading is statistically unusual for this instrument right now. Price frequently continues in the same direction afterwards, and frequently does not. The Force Index leaves its bands considerably more often than markets reverse — if you take band exits as entries you will be wrong most of the time, and the construction is not making any claim to the contrary.
What it is good for is context: knowing whether the effort behind a move is ordinary or extreme for this market, in a form that reads the same everywhere.
Building it
The whole thing is about twenty lines. The Force Index is a running series of (close − previous close) × volume, then smoothed — Elder specified a 13-period EMA; I default to an SMA over the same 13 because it makes the band statistics easier to reason about, and the smoothing method is an input either way. Then a moving average of that smoothed series over 20 bars, a standard deviation over the same window, and the bands at basis ± 2 × deviation.
Two details that matter in MQL5. Compute the Force Index into its own buffer first and take the moving average of that buffer, not of price — it is easy to wire the deviation to the wrong series. And use the tick volume the terminal supplies unless the broker provides real volume; mixing the two across instruments reintroduces exactly the comparability problem you just solved.
I have published this as 'Force Index with Adaptive Volatility Bands', free for MT5 and MT4, with all four series exposed as documented buffers so an Expert Advisor can read the values rather than infer them from colours. But the construction is the useful part and it is public — if you would rather build it yourself, everything needed is above.
Presets
There is not much to tune, which is the point. Three configurations worth knowing:
- Default (13, 20, 2.0) — Elder's period, standard Bollinger window. Works unchanged on every instrument I have tried.
- Responsive (13, 10, 2.0) — shorter band window. More excursions, faster adaptation after a regime change. Useful on higher timeframes where 20 bars is a long time.
- Selective (13, 20, 2.5) — wider bands. Fewer excursions, each more extreme. Useful on instruments that spend a lot of time outside two deviations, which some crypto pairs do.
Changing the 13 changes what you are measuring rather than how it is judged, so I would leave it alone unless you have a reason.
Developed and maintained by Narayanan Mohanan, MT5/MQL5 Developer.